

- Market Size (2026)
- USD 310.0 Mn
- Forecast (2036)
- USD 1033.8 Mn
- CAGR (2026 to 2036)
- 12.8%
How big is the Probiotics for Biopesticides Market in 2026?
USD 310.0 million in 2026 and USD 1,033.8 million by 2036 at a 12.8% CAGR.
The probiotics for biopesticides market was valued at USD 274.8 million in 2025, driven by residue scrutiny and field-supported biological crop-input programs. It is forecast to expand from USD 310.0 million in 2026 to USD 1,033.8 million by 2036 at 12.8% CAGR. Residue management is moving agricultural biological inputs from trial lots into planned crop programs for crop-input retailers. Eurostat reported in May 2026 that EU pesticide sales reached 316 thousand tonnes in 2024, which keeps residue and substitution pressure visible for dealers. Growers are testing microbial and biochemical tools that support biorational pesticide adoption without changing full crop-protection plans.
Early qualification is expected to be led by crop-input retailers and cooperatives that evaluate product performance after initial field trials.Their agronomy teams need biological products that fit spray schedules and dealer training routines before seasonal booking. Many accounts compare probiotics for biopesticides against biocontrol solutions that already promise crop protection and residue relief. Products that explain microbial action in practical field terms are expected to win more trial slots than products sold through broad biological claims.
Established markets are expected to weight label files and residue review more heavily than dealer demonstrations. India and China are likely to weight dealer access and field proof before broader seasonal booking. The same value-chain pattern appears in agricultural microbials programs that depend on strain quality and field guidance.
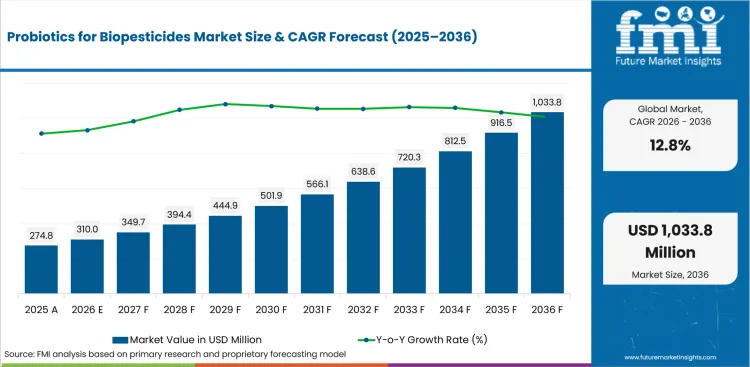
| Metric | Value |
|---|---|
| 2025 Market Size | USD 274.8 million |
| 2026 Market Size | USD 310.0 million |
| 2036 Market Size | USD 1,033.8 million |
| Forecast CAGR (2026-2036) | 12.8% |
| Product Type Focus | Liquid |
| Liquid Share (2026) | 38.5% |
| Source Focus | Microbial |
| Microbial Share (2026) | 36.0% |
| Crop Type Focus | Cereals & Grains |
| Cereals & Grains Share (2026) | 42.5% |
| Fastest-growing Country | India |
| India CAGR by 2036 | 11.5% |
Summary of the Probiotics for Biopesticides Market
| Market Signal | Commercial Impact |
|---|---|
| Demand and Growth Drivers | Soil-health pressure and residue scrutiny are expected to move spending toward microbial crop-input programs. Documentation and field guidance are set to shape account urgency before grower trials expand.
|
| Product and Segment View | Liquid, microbial and cereals & grains are projected to lead their respective categories in 2026. Crop protection is estimated to remain the application anchor due to grower need for practical pest-control alternatives.
|
| Geography and Growth Outlook | India, China and South Korea form the higher-growth tier for field-supported biological programs across dealer channels. Germany, Japan and the United States reflect steadier conversion shaped by registration discipline and dealer proof.
|
| Competitive Landscape | Competition is moderately concentrated at the research and registration layer where field proof controls channel access. Field evidence, dealer service and crop-specific instructions are expected to govern vendor selection criteria before crop-input accounts approve broader listing.
|
| Analyst Perspective | The analyst view centers on proof quality after the first field trial and local application support. Long-term retention is expected to depend on practical help during seasonal application windows and dealer training requirements.
- Nikhil Kaitwade, Principal Analyst at Future Market Insights |
Source: FMI's proprietary forecasting model and primary research
How is the probiotics for biopesticides market segmented?
The probiotics for biopesticides market is segmented by product type, source, crop type, application, and region.
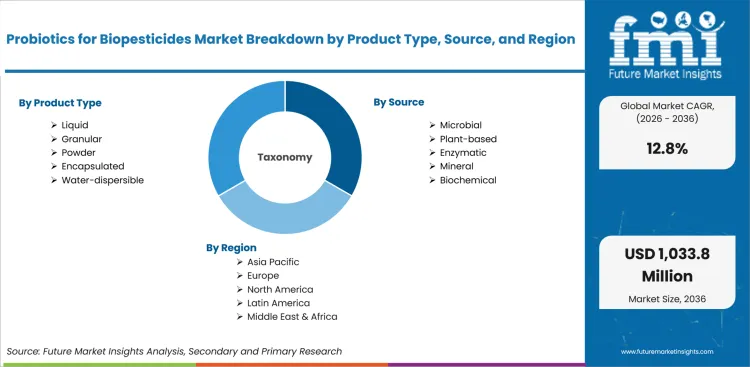
The probiotics for biopesticides market is segmented by product type, source, crop type, application, and region. By product type, the market covers liquid, granular, powder, encapsulated, and water-dispersible formats used in retailer-led biological programs. Source coverage includes microbial, plant-based, enzymatic, mineral, and biochemical inputs used in crop-input positioning. Crop type covers cereals & grains, oilseeds & pulses, fruits & vegetables, turf & ornamentals, and plantation crops. Application covers soil treatment, foliar, seed treatment, crop protection, and compost & residue programs used in field planning. Regional coverage spans North America, Latin America, Western Europe, Eastern Europe, East Asia, South Asia and Pacific, and Middle East and Africa for comparison with biofertilizer programs.
What supports liquid demand within the product type category?
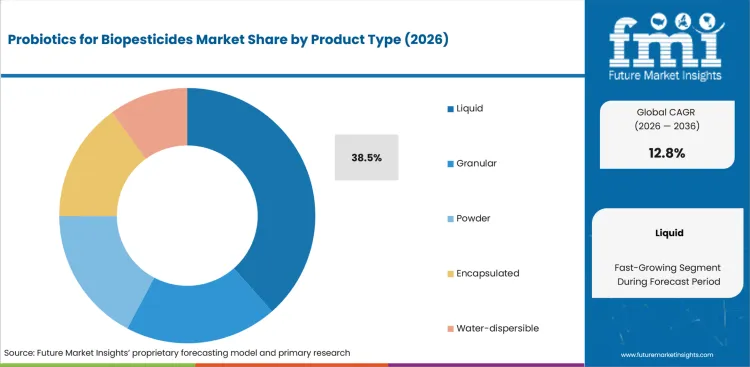
Liquid formulations are assessed on storage stability, tank mixing and field dosing rather than ingredient name alone. EPA's What are Biopesticides page was updated in October 2025 and defines biopesticides as products derived from plants, bacteria and minerals. The definition keeps liquid probiotic biopesticide products tied to practical use directions before dealers place them inside seasonal spray programs. Retailers also check whether product viscosity supports ordinary sprayer handling during early product demonstrations.
- Based on product type, liquid is projected to account for 38.5% of demand in 2026 due to easier field dosing and dealer instruction. EPA's October 2025 definition supports liquid formats used in residue-conscious crop programs that need clear use directions. The format helps agronomy teams connect label use and storage checks before grower trials expand into repeat acreage.
- Liquid demand is expected to rise in retailer-led crop protection programs supported by faster mixing decisions and less equipment disruption. The format also fits agrochemical additives planning, driven by compatibility and drift-control routines that agronomists compare before recommendations. Dealer teams use liquid formats to reduce mixing questions during early product trials and local grower demonstrations.
How is microbial positioned within source choices?
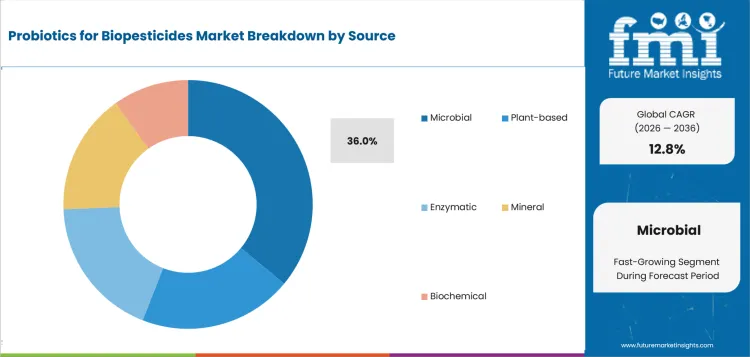
Microbial sourcing is screened for strain identity, batch behavior and crop-specific response before dealers accept commercial listing risk. BASF commissioned its BioHub fermentation plant in May 2026 for biological and biotechnology-based crop protection products. The BioHub supports demand for microbial biological products that show production depth and repeatable performance evidence in real cropping systems. Dealer teams also ask whether storage guidance protects viable strain performance during regional distribution.
- By source, microbial is estimated to hold 36.0% of demand in 2026 owing to strain-specific activity and field proof needs. BASF said in May 2026 that commercial production of specified biological active ingredients had already started at the BioHub. Those production files help cooperatives explain microbial value beyond broad soil-health claims during listing reviews.
- Demand for microbial is expected to grow among agronomists attributable to strain traceability and crop response documentation. Related microbial input programs use similar proof screens, driven by cooperative evidence needs for storage survival and local field timing. Cooperatives use these records to compare strain survival before ordering seasonal demonstration plots and field training.
How do growers evaluate cereals & grains within the crop type category?
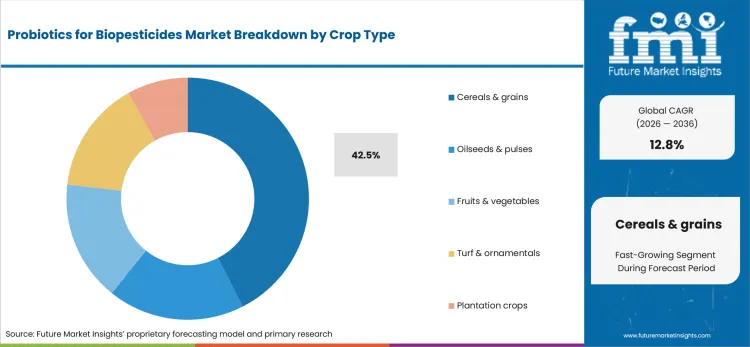
Cereal and grain programs require crop-input products that handle broad acreage, disease timing and narrow application windows. FAO reported in June 2026 that global cereal production for 2025 was estimated at 3 043 million tonnes, which keeps broadacre field reliability central for biological products.
Cereals & grains is anticipated to lead crop type demand at 42.5% share in 2026 driven by broadacre application economics and disease-management routines. The FAO cereal figure highlights global scale pressure, which means crop advisors need biological products that work inside planned spray and soil programs. Those products must support local field comparisons before growers extend use across larger acreage blocks during seasonal planning.
- Growers are expected to favor cereals & grains applications over alternatives due to larger acreage exposure and clearer cost tracking. The segment also connects to seed treatment materials demand, driven by early disease-control decisions before crop protection spend is finalized. Broadacre managers use those records to plan biological trials across larger acreage blocks during seasonal programs.
What drives crop protection within application decisions?
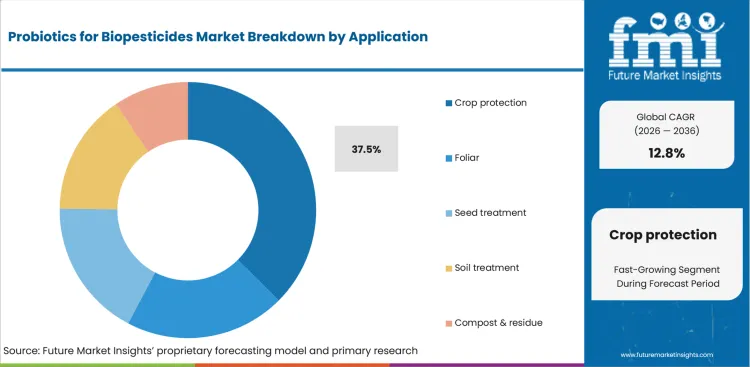
Application decisions shift once growers ask whether probiotics reduce pest or disease risk inside real spray programs. Corteva announced in November 2025 that Goltrevo became the first bioinsecticide in its Biologicals portfolio. The announcement ties crop protection applications to microbial-based pest control and field usability rather than broad biological positioning. Dealer teams compare target-pest fit before assigning demonstration plots to local seasonal programs and retailer training schedules.
- By application, crop protection is forecast to represent 37.5% of demand in 2026 propelled by residue pressure and pest-control substitution needs. Corteva said in November 2025 that Goltrevo is a microbial-based solution, which supports the field screen for biological pest-control products. Dealer teams use these details to avoid unclear biological pest claims during retailer review.
- Sales of crop protection applications are forecast to gain traction in specialty and row-crop programs reinforced by residue scrutiny. Agronomists comparing bioinsecticide demand need products that explain target pest fit and rotation use before field crews adopt new routines. Field teams also need application timing guidance that reduces seasonal training gaps before dealer-led demonstrations.
How does North America influence regional planning?
North American planning is shaped by registration review, large dealership networks and grower demand for local technical service. EPA said in February 2026 that its Biopesticides and Pollution Prevention Division handles biologically based pesticides and emerging technologies. The regulatory role gives crop-input retailers a clearer qualification path for products that need label support and field instructions. Dealer networks also expect training material that fits local crop planning before seasonal listing.
- North America is set to lead regional demand at 30.0% share in 2026 strengthened by crop-input networks and regulatory discipline. EPA's February 2026 division description places biopesticide review inside a specialized regulatory structure, which supports regional demand for documentation-ready products and trained technical staff. Dealer teams use those regulatory files to compare biological products before seasonal listing decisions across crop-input accounts.
- Purchase activity for North America is anticipated to rise driven by dealer programs that combine field trials and residue guidance for growers. Related microbial seed treatment programs show why local service and product fit influence repeat account access. Crop advisors need proof packages before adding new biological inputs to spring programs and dealer recommendation lists.
What are the drivers, restraints, and opportunities in the probiotics for biopesticides market?
Near-term purchases are being shaped by residue pressure, field-performance variability and retailer-backed agronomy programs outlined below.
- Driver: Residue pressure and soil-health programs are expected to push growers toward biological inputs that include field-use proof.
- Restraint: Adoption is likely to slow if microbial performance varies across soil conditions and application timing in local crop programs.
- Opportunity: Retailer agronomy programs are projected to open access for suppliers that pair strains with field instructions.
Residue limits and soil-health goals are expected to increase biological trials inside crop protection planning. Syngenta and Ceres Biotics signed an agreement in February 2025 to bring VIXERAN to farmers globally. The agreement is expected to widen access to microbial tools that fit nutrient-efficiency programs. Dealer teams are then able to compare biological inputs against conventional crop-protection options during seasonal planning. Growers are expected to ask for application support before repeat purchases expand into wider seasonal programs.
Registration uncertainty is likely to slow accounts that lack clear label ownership and local trial responsibility. EPA's February 2026 biopesticides division description places biologically based pesticides inside a specialized review structure. The review structure keeps registrants focused on data packages and use directions before dealers expand sales. Adoption slows if products arrive without field protocols that advisors trust during high-pressure crop windows. Technical files must connect label wording to crop advisor training before account expansion across dealer networks.
Retailer-backed programs are expected to turn the restraint into a service route for credible biological input suppliers. Novonesis announced in March 2024 that FMC would distribute selected agricultural biosolutions in Canada from the 2025 growing season. The agreement points to scale models linking distribution support and technical guidance for dealer-led biological programs. Suppliers using similar service logic in seed biostimulant usage are likely to earn repeat attention from agronomy teams. Retail teams are expected to treat those agreements like templates for local demonstration programs.
Which country CAGRs are profiled in the probiotics for biopesticides market?
.webp "Top Country Growth Comparison Probiotics For Biopesticides Market Cagr (2026 2036)")
| Country | CAGR |
|---|---|
| United States | 7.7% |
| China | 9.6% |
| India | 11.5% |
| Germany | 6.5% |
| United Kingdom | 7.0% |
| Japan | 5.5% |
| South Korea | 7.4% |
Source: FMI's proprietary forecasting model and primary research
How do country-level CAGRs compare in the probiotics for biopesticides market?
India is projected to expand at 11.5% CAGR through 2036 and China is forecast to post 9.6% CAGR over the forecast period. The United States and South Korea are anticipated to advance at 7.7% CAGR and 7.4% CAGR respectively over the assessment period. The United Kingdom is set to record 7.0% CAGR during the same forecast window. Germany is estimated at 6.5% CAGR under tighter evidence review conditions in cooperative channels. Japan is estimated at 5.5% CAGR under careful distributor proof requirements and limited acreage exposure. The variation reflects field-demonstration needs, dealer depth and regulatory proof requirements across crop-input channels.
- United States demand is projected to grow at 7.7% CAGR by 2036, driven by large corn programs that need disease-control alternatives across routine crop plans. USDA NASS reported in January 2026 that corn for grain production reached 17.0 billion bushels in 2025. The output volume places biological field evidence inside decisions for broadacre programs that cannot rely on product claims alone. EPA oversight keeps adoption risk connected to registration files and dealer training requirements across retailer listing programs. Large distributor programs also need proof that products match soil and foliar timing across spring spray windows. Distributors are expected to concentrate listings among companies that pair microbial evidence with label support before seasonal stocking windows.
- China's probiotics for biopesticides outlook is anticipated to advance at 9.6% CAGR over the assessment period, attributable to yield-improvement policy pressure in grain and oilseed systems. National Bureau of Statistics of China reported in December 2025 that total grain production reached 714.88 million tons in 2025. The production base keeps field consistency central for biological products pitched to cereals and oilseed rotations. Local adoption faces proof pressure from provincial trial differences and distributor responsibility for application timing. Provincial trial records also shape acceptance for products used across climatic zones and pest-pressure patterns. Agronomy teams are expected to favor suppliers that document strain behavior across humid and dry growing regions.
- Probiotics for biopesticides demand in India is forecast to rise at 11.5% CAGR over the forecast period, supported by foodgrain scale and input-efficiency programs. Press Information Bureau reported in May 2026 that total foodgrain production was estimated at 376.563 million tonnes for 2025 to 2026. The production base gives microbial and biochemical products a route into programs that need yield protection without heavier chemical use. Adoption remains shaped by dealer education and farmer confidence in field guidance during first-season trials. Village-level dealer support also affects grower confidence during early biological crop-input trial seasons and local booking cycles. Cooperatives are expected to favor suppliers that provide local demonstrations before kharif and rabi input booking cycles.
- Adoption of probiotics for biopesticides in Germany is estimated to expand at 6.5% CAGR through 2036, owing to cereal intensity and EU residue scrutiny. Destatis reported in January 2026 that German farms harvested 45 million tons of grain in 2025. The grain base raises the value of biopesticide options that fit wheat disease programs and rotation planning. Retailer and cooperative adoption remains constrained by residue documentation, field-trial proof and conventional spray compatibility. Cooperatives also need spray compatibility evidence before adding products to cereal programs and advisor-led demonstrations. Suppliers with registration support and agronomy files are expected to receive stronger consideration in accounts that require EU documentation discipline.
- The United Kingdom sector is projected to record 7.0% CAGR during the assessment period, shaped by farm-level pressure to rebuild cereal performance after variable harvests and disease-control uncertainty. Defra reported in January 2026 that UK wheat production reached 12 million tonnes in 2025. The wheat base makes crop-protection alternatives more relevant for agronomists managing disease pressure and input cost exposure. Adoption friction comes from retailer confidence and advisory capacity rather than product access alone. Advisors also need storage and mixing records before recommending biological crop inputs to cereal accounts. Crop-input retailers are expected to concentrate purchases among suppliers that provide local trial summaries before autumn cropping programs.
- In Japan, probiotics for biopesticides demand is predicted to advance at 5.5% CAGR through 2036, led by precision crop management and careful product consistency requirements. USDA FAS Tokyo estimated in December 2025 that Japan's MY2025/26 rice production reached 7.54 million MT. The rice base supports biological testing in programs that prioritize residue control and predictable application windows. Growers remain careful with new inputs due to limited acreage, weather exposure and tight distributor relationships. Distributor guidance also shapes uptake in accounts that avoid untested seasonal changes during rice planning. Channel programs are expected to draw attention from cooperatives that want clear storage and mixing instructions.
- South Korea is estimated to post 7.4% CAGR over the forecast period, led by intensive rice systems and protected horticulture that reward precise input timing. Statistics Korea recorded in November 2025 that rice production reached 3.539 million tons in 2025. The production base keeps field performance proof central for biological crop inputs entering cooperative and dealer channels. Adoption constraints come from shrinking cultivated area and the need to show performance under compact farm structures. Cooperatives also need trial records that reflect compact farms and protected production cycles before product listing. Bayer and Syngenta are positioned to gain traction in distributor accounts that need technical crop-protection files and broader account service.
Who are the notable companies in the probiotics for biopesticides market?
Bayer, Syngenta, BASF, Corteva Agriscience, Novonesis, UPL, Valent BioSciences, and Lallemand are the notable companies shaping this market.
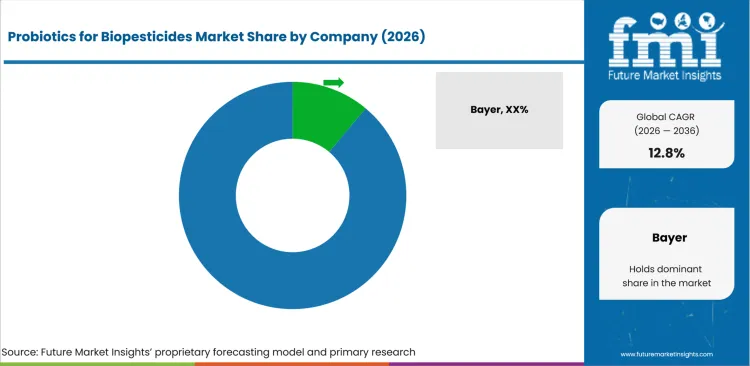
Competition is moderately concentrated at the multinational discovery and distribution layer, yet regional biological formulators still compete in crop-specific niches. Company scale is controlled by strain libraries and dealership access before registration files enter procurement reviews. Smaller specialists compete in local crops that reward trial history and agronomy support from nearby technical teams. Competition centers on microbial proof, crop protection fit and service continuity across dealership networks. Dealer service remains central to repeat listing because crop-input accounts need field evidence before wider conversion. Adjacent biostimulant programs show the same need for application evidence and account support before broader crop-input conversion.
- Crop-protection access gives Bayer and Syngenta a practical advantage in cooperatives that need registration support before stocking microbial products. Their biological crop-protection work links discovery depth to distributor infrastructure, which helps dealer teams turn product claims into field instructions. The combination gives agronomy managers a clearer route from portfolio review to seasonal listing decisions across crop-input accounts.
- Microbial strain expertise places Novonesis and Lallemand among suppliers evaluated for probiotic applications across biopesticides, biofertilizers, and biostimulants. Agronomists use product data and application guidance to understand strain function and batch performance before recommending local field trials. Storage guidance then helps cooperatives assess products that depend on viable organisms.
- Retailer planning places BASF and Corteva Agriscience in accounts that want biological products connected to broader crop protection programs. Their commercial value is linked to portfolio adjacency and technical service during spray planning. Dealer accounts look for claims discipline and compatibility evidence before adding biological products to seasonal crop programs.
- Distribution depth gives UPL and Valent BioSciences a route into accounts that need biological crop protection options and regional service. Their fit is visible in programs that value application support and crop-specific field records. Companies that document field evidence and dealer training are expected to protect repeat orders after first-year trials.
Competitive Benchmarking: Probiotics for Biopesticides Market
| Company | Field Evidence Fit | Registration Support | Agronomy Service Fit | Dealer Access |
|---|---|---|---|---|
| Bayer | High | High | Strong | Global |
| Syngenta | High | High | Strong | Global |
| BASF | Strong | High | Strong | Global |
| Corteva Agriscience | Strong | High | Strong | Global |
| Novonesis | High | Medium | Strong | Global |
| UPL | Strong | Strong | Strong | Global |
| Valent BioSciences | Strong | Strong | Medium | Regional |
| Lallemand | High | Medium | Strong | Global |
Source: Future Market Insights competitive analysis, 2026. Ratings reflect relative portfolio relevance, workflow fit, and service reach across the evaluated market landscape.
Key Developments in the Probiotics for Biopesticides Market
- In February 2025, Syngenta acquired the Novartis repository of natural compounds and genetic strains for agricultural use. The transaction added natural products and strain assets to its biologicals research base for agriculture-focused discovery work.
- In February 2025, Syngenta and Ceres Biotics signed an agreement to bring VIXERAN to farmers globally. VIXERAN is positioned around nitrogen fertilizer use and biological farm practice support in commercial crop programs. The partnership is expected to widen retailer access to microbial tools that fit nutrient-efficiency programs.
- In July 2025, Bayer expanded its partnership with M2i Group for pheromone-based biological crop protection solutions. The agreement covered exclusive distribution of pheromone gels for Asia-Pacific, Latin America and the United States. The development points to channel-led scaling in biological crop protection across distributor programs and crop-protection dealer networks.
- In January 2025, Bayer and Ecospray reached a distribution agreement for Velsinum across European vegetable and potato programs. The product is a garlic-sourced biological liquid nematicide for vegetable and potato crops in the European Union.
Key Players in the Probiotics for Biopesticides Market
Integrated crop protection and biologicals companies
- Bayer
- Syngenta
- BASF
- Corteva Agriscience
- UPL
Microbial and biological crop-input specialists
- Novonesis
- Valent BioSciences
- Lallemand
Probiotics for Biopesticides Market - Report Scope
| Coverage field | Report scope |
|---|---|
| Market breakdown | Probiotics for Biopesticides Market Breakdown By Product Type, Source, Crop Type, Application, and Region |
| Market Definition | Probiotics for biopesticides are microbial or biologically derived crop-input products used by growers and agronomists to support pest control, soil treatment and crop resilience. |
| Regions Covered | North America, Latin America, Western Europe, Eastern Europe, East Asia, South Asia and Pacific, Middle East and Africa |
| Countries Covered | United States, China, India, Germany, United Kingdom, Japan, South Korea, and 30+ countries |
| Key Companies Profiled | Bayer, Syngenta, BASF, Corteva Agriscience, Novonesis, UPL, Valent BioSciences, Lallemand |
| Forecast Period | 2026 to 2036 |
| Approach | Hybrid bottom-up and top-down methodology using product formulation adoption and crop type exposure alongside application intensity and country-level biological input readiness |
Source: Future Market Insights - analysis driven by proprietary forecasting models and primary research
Probiotics for Biopesticides Market - Research Methodology
| Method | Approach |
|---|---|
| Primary Research | FMI analysts reviewed field inputs from growers and agronomists across crop-input retail and biological product accounts. Interviews focused on field-trial barriers, dealer listing criteria and microbial handling rules before repeat-use triggers were tested. The research also assessed how cooperatives compare liquid, microbial and crop protection products before seasonal account expansion. Respondents explained how label wording affects dealer training and grower confidence during first-season use programs. |
| Desk Research | Desk research covered USDA crop statistics and FAO cereal data alongside Eurostat pesticide sales and EPA biopesticide references. Company evidence was checked through official releases from crop protection and biologicals suppliers during portfolio validation. Product relevance was verified against microbial source fit, application guidance and residue positioning before crop-type coverage was mapped. The review separated crop-protection products from general soil inputs before evidence entered the sizing model. |
| Market Sizing and Forecasting | Market sizing combined the 2026 value anchor and product type shares before application intensity and country CAGRs were applied. The model used crop exposure and regional dealer-readiness assumptions to forecast 2036 demand by country. Segment assumptions were adjusted for liquid formulation use, microbial proof needs and crop protection channel fit. Forecast assumptions were checked against retailer demonstration cycles and country-level registration readiness before final allocation by segment. |
| Data Validation | Forecasts were checked against crop production scale and regulatory evidence before supplier portfolios and official company developments were reviewed. Validation excluded generic biofertilizer or biostimulant products without crop protection relevance during company screening. Company portfolios were reviewed to avoid counting adjacent biological products that lack field-use fit in probiotics for biopesticides. Each company was checked for direct biological crop-protection relevance before inclusion in the competitive set. |
Source: Future Market Insights (FMI) analysis, based on proprietary forecasting model and primary research
Probiotics for Biopesticides Market by Segments
Probiotics for Biopesticides Market segmented by Product Type:
- Liquid
- Granular
- Powder
- Encapsulated
- Water-dispersible
Probiotics for Biopesticides Market segmented by Source:
- Microbial
- Plant-based
- Enzymatic
- Mineral
- Biochemical
Probiotics for Biopesticides Market segmented by Crop Type:
- Cereals & grains
- Oilseeds & pulses
- Fruits & vegetables
- Turf & ornamentals
- Plantation crops
Probiotics for Biopesticides Market segmented by Application:
- Soil treatment
- Foliar
- Seed treatment
- Crop protection
- Compost & residue
Probiotics for Biopesticides Market by Region:
- North America
- United States
- Canada
- Latin America
- Brazil
- Mexico
- Chile
- Rest of Latin America
- Western Europe
- Germany
- United Kingdom
- Italy
- Spain
- France
- Nordic
- BENELUX
- Rest of Western Europe
- Eastern Europe
- Poland
- Hungary
- Balkan and Baltic
- Rest of Eastern Europe
- East Asia
- China
- Japan
- South Korea
- South Asia and Pacific
- India
- ASEAN
- Australia and New Zealand
- Rest of South Asia and Pacific
- Middle East and Africa
- Kingdom of Saudi Arabia
- Other GCC Countries
- Turkiye
- South Africa
- Other African Union
- Rest of Middle East and Africa
Research Sources and Bibliography
- USA Department of Agriculture, National Agricultural Statistics Service. (2026, January). Crop Production 2025 Summary. United States Department of Agriculture.
- National Bureau of Statistics of China. (2025, December). Bulletin on the National Grain Production in 2025. National Bureau of Statistics of China.
- Press Information Bureau. (2026, May). Union Minister Shri Shivraj Singh Chouhan Approves Third Advance Estimates of Production of Major Agricultural Crops for the Year 2025-26. Government of India.
- Federal Statistical Office of Germany. (2026, January). 2025 grain and potato harvest: 45 million tons of grain and 14 million tons of potatoes. Destatis.
- Department for Environment, Food & Rural Affairs. (2026, January). Cereal and oilseed production in the United Kingdom 2025. GOV.UK.
- USA Department of Agriculture, Foreign Agricultural Service. (2025, December). Grain and Feed Update. United States Department of Agriculture.
- Ministry of Data and Statistics. (2025, November). Final Results of the Cultivated Area and Production of Rice in 2025. Statistics Korea.
- Eurostat. (2026, May). Sales of pesticides in the EU rebounded by 8% in 2024. European Commission.
- Food and Agriculture Organization of the United Nations. (2026, June). FAO Cereal Supply and Demand Brief. Food and Agriculture Organization of the United Nations.
- USA Environmental Protection Agency. (2025, October). What are Biopesticides? USA Environmental Protection Agency.
- USA Environmental Protection Agency. (2026, February). Contacts in the Office of Pesticide Programs, Biopesticides and Pollution Prevention Division. USA Environmental Protection Agency.
- BASF. (2026, May). BASF Agricultural Solutions successfully commissions new fermentation plant for crop protection products in Ludwigshafen. BASF.
- Corteva Agriscience. (2025, November). Corteva Announces Nature-Inspired Solutions to Control Insects, Help Farmers Protect Yield. Corteva Agriscience.
- Novonesis. (2024, March). FMC to Distribute Novonesis’ Biosolutions for Plant Health in Canada. Novonesis.
- Syngenta. (2025, February). Syngenta strengthens global leadership in agricultural biologicals. Syngenta.
- Syngenta. (2025, February). Sustainability in agriculture gets a boost with global biologicals partnership. Syngenta.
- Bayer. (2025, July). Bayer to expand partnership with M2i Group to distribute pheromone-based biological crop protection solutions globally. Bayer.
- Bayer. (2025, January). Bayer and Ecospray Reach Distribution Agreement for New Garlic-Sourced Biological Crop Protection Product. Bayer.
This bibliography is provided for reader reference and uses primary government, official statistics, regulator and company sources.
This Report Answers
- What is the expected value of the probiotics for biopesticides market in 2026 and 2036?
- What CAGR is forecast for the probiotics for biopesticides market from 2026 to 2036?
- Which segments shape demand across product type, source, crop type and application categories?
- Which residue, soil-health and field-performance pressures support purchase activity?
- How do country CAGRs differ across the United States, China, India, Germany, the United Kingdom, Japan and South Korea?
- Which companies compete across discovery depth, registration support, agronomy service and dealer access?
- What should procurement leaders address before wider account expansion or sourcing commitment?
- How do registration review, label documentation and residue pressure affect supplier selection?
Frequently Asked Questions
Why should executives track the Probiotics for Biopesticides Market?
Executives should track this market because biological input choices directly affect residue exposure, field reliability, and dealer account confidence. Supplier credibility increasingly shapes seasonal program commitments across crop portfolios.
What business problem does the Probiotics for Biopesticides Market address?
The market helps reduce uncertainty in pest control and soil treatment outcomes using microbial solutions. It supports repeatable field performance where chemical dependence is being reduced.
What should procurement leaders evaluate before selecting suppliers?
Procurement leaders should assess strain documentation, label support, and the depth of field trial evidence before supplier approval. Storage requirements and access to regional agronomy service should then inform sourcing decisions.
What factors limit return on investment for crop input accounts?
Return on investment is often delayed by variability in field performance across soil types and application windows. Inconsistent dealer training during first year programs further affects outcome reliability.
How should suppliers build long term account confidence?
Suppliers build confidence by providing transparent field data, clear application guidance, and hands on service during seasonal trials. Consistent technical support strengthens repeat adoption across crop cycles.
Preview the report firsthand - request a free sample
Get SampleGet the brochure for pricing and purchase details.
Get PDFTable of Content
- Key Takeaways
- Market Size and CAGR
- Top Growth Driver
- Fastest Growing Segment
- Leading Region
- Key Companies
- Emerging Opportunities
- Executive Summary
- Global Market Outlook
- Demand-side Trends
- Supply-side Trends
- Technology Roadmap Analysis
- Analysis and Recommendations
- Analyst Perspective (What is happening? Why now? What should investors know?)
- Key Questions Answered
- How large is the market?
- What is the CAGR?
- What are key trends?
- Which region dominates?
- Who are the leaders?
- Market Overview
- Market Coverage / Taxonomy
- Market Definition / Scope / Limitations
- Research Methodology
- Chapter Orientation
- Analytical Lens and Working Hypotheses
- Market Structure, Signals, and Trend Drivers
- Benchmarking and Cross-market Comparability
- Market Sizing, Forecasting, and Opportunity Mapping
- Research Design and Evidence Framework
- Desk Research Programme (Secondary Evidence)
- Expert Input and Fieldwork (Primary Evidence)
- Tooling, Models, and Reference Databases
- Data Engineering and Model Build
- Quality Assurance and Audit Trail
- Market Background
- Market Dynamics (Drivers, Restraints, Opportunity, Trends)
- Scenario Forecast (Optimistic, Likely, Conservative)
- Impact Analysis
- AI Impact
- Sustainability Impact
- Regulatory Impact
- Technology Impact
- Consumer / Buyer Analysis
- Purchase Drivers
- Adoption Barriers
- Buyer Journey
- Opportunity Map Analysis
- Product Life Cycle Analysis
- Supply Chain Analysis
- Investment Feasibility Matrix
- Value Chain Analysis
- PESTLE and Porter's Analysis
- Regulatory Landscape
- Regional Parent Market Outlook
- Production and Consumption Statistics
- Import and Export Statistics
- Global Market Analysis and Forecast, 2021 to 2036
- Historical Market Size Value (USD Million) & Volume (Unit) Analysis, 2021 to 2025
- Current and Future Market Size Value (USD Million) & Volume (Unit) Projections, 2026 to 2036
- Y-o-Y Growth Trend Analysis
- Absolute $ Opportunity Analysis
- Global Market Pricing Analysis, 2021 to 2036
- Global Market Analysis and Forecast, By Product Type, 2021 to 2036
- Introduction / Key Findings
- Historical Market Size Value (USD Million) & Volume (Unit) Analysis By Product Type, 2021 to 2025
- Current and Future Market Size Value (USD Million) & Volume (Unit) Analysis and Forecast By Product Type, 2026 to 2036
- Liquid
- Granular
- Powder
- Encapsulated
- Water-dispersible
- Liquid
- Y-o-Y Growth Trend Analysis By Product Type, 2021 to 2025
- Absolute $ Opportunity Analysis By Product Type, 2026 to 2036
- Global Market Analysis and Forecast, By Source, 2021 to 2036
- Introduction / Key Findings
- Historical Market Size Value (USD Million) & Volume (Unit) Analysis By Source, 2021 to 2025
- Current and Future Market Size Value (USD Million) & Volume (Unit) Analysis and Forecast By Source, 2026 to 2036
- Microbial
- Plant-based
- Enzymatic
- Mineral
- Biochemical
- Microbial
- Y-o-Y Growth Trend Analysis By Source, 2021 to 2025
- Absolute $ Opportunity Analysis By Source, 2026 to 2036
- Global Market Analysis and Forecast, By Crop Type, 2021 to 2036
- Introduction / Key Findings
- Historical Market Size Value (USD Million) & Volume (Unit) Analysis By Crop Type, 2021 to 2025
- Current and Future Market Size Value (USD Million) & Volume (Unit) Analysis and Forecast By Crop Type, 2026 to 2036
- Cereals & grains
- Oilseeds & pulses
- Fruits & vegetables
- Turf & ornamentals
- Plantation crops
- Cereals & grains
- Y-o-Y Growth Trend Analysis By Crop Type, 2021 to 2025
- Absolute $ Opportunity Analysis By Crop Type, 2026 to 2036
- Global Market Analysis and Forecast, By Application, 2021 to 2036
- Introduction / Key Findings
- Historical Market Size Value (USD Million) & Volume (Unit) Analysis By Application, 2021 to 2025
- Current and Future Market Size Value (USD Million) & Volume (Unit) Analysis and Forecast By Application, 2026 to 2036
- Crop protection
- Foliar
- Seed treatment
- Soil treatment
- Compost & residue
- Crop protection
- Y-o-Y Growth Trend Analysis By Application, 2021 to 2025
- Absolute $ Opportunity Analysis By Application, 2026 to 2036
- Global Market Analysis and Forecast, By Region, 2021 to 2036
- Introduction
- Historical Market Size Value (USD Million) & Volume (Unit) Analysis By Region, 2021 to 2025
- Current Market Size Value (USD Million) & Volume (Unit) Analysis and Forecast By Region, 2026 to 2036
- North America
- Latin America
- Western Europe
- Eastern Europe
- East Asia
- South Asia and Pacific
- Middle East & Africa
- Market Attractiveness Analysis By Region
- North America Market Analysis and Forecast, By Country, 2021 to 2036
- Historical Market Size Value (USD Million) & Volume (Unit) Trend Analysis By Market Taxonomy, 2021 to 2025
- Market Size Value (USD Million) & Volume (Unit) Forecast By Market Taxonomy, 2026 to 2036
- By Country
- USA
- Canada
- Mexico
- By Product Type
- By Source
- By Crop Type
- By Application
- By Country
- Market Attractiveness Analysis
- By Country
- By Product Type
- By Source
- By Crop Type
- By Application
- Key Takeaways
- Latin America Market Analysis and Forecast, By Country
- Historical Market Size Value (USD Million) & Volume (Unit) Trend Analysis By Market Taxonomy, 2021 to 2025
- Market Size Value (USD Million) & Volume (Unit) Forecast By Market Taxonomy, 2026 to 2036
- By Country
- Brazil
- Chile
- Rest of Latin America
- By Product Type
- By Source
- By Crop Type
- By Application
- By Country
- Market Attractiveness Analysis
- By Country
- By Product Type
- By Source
- By Crop Type
- By Application
- Key Takeaways
- Western Europe Market Analysis and Forecast, By Country
- Historical Market Size Value (USD Million) & Volume (Unit) Trend Analysis By Market Taxonomy, 2021 to 2025
- Market Size Value (USD Million) & Volume (Unit) Forecast By Market Taxonomy, 2026 to 2036
- By Country
- Germany
- UK
- Italy
- Spain
- France
- Nordic
- BENELUX
- Rest of Western Europe
- By Product Type
- By Source
- By Crop Type
- By Application
- By Country
- Market Attractiveness Analysis
- By Country
- By Product Type
- By Source
- By Crop Type
- By Application
- Key Takeaways
- Eastern Europe Market Analysis and Forecast, By Country
- Historical Market Size Value (USD Million) & Volume (Unit) Trend Analysis By Market Taxonomy, 2021 to 2025
- Market Size Value (USD Million) & Volume (Unit) Forecast By Market Taxonomy, 2026 to 2036
- By Country
- Russia
- Poland
- Hungary
- Balkan & Baltic
- Rest of Eastern Europe
- By Product Type
- By Source
- By Crop Type
- By Application
- By Country
- Market Attractiveness Analysis
- By Country
- By Product Type
- By Source
- By Crop Type
- By Application
- Key Takeaways
- East Asia Market Analysis and Forecast, By Country
- Historical Market Size Value (USD Million) & Volume (Unit) Trend Analysis By Market Taxonomy, 2021 to 2025
- Market Size Value (USD Million) & Volume (Unit) Forecast By Market Taxonomy, 2026 to 2036
- By Country
- China
- Japan
- South Korea
- By Product Type
- By Source
- By Crop Type
- By Application
- By Country
- Market Attractiveness Analysis
- By Country
- By Product Type
- By Source
- By Crop Type
- By Application
- Key Takeaways
- South Asia and Pacific Market Analysis and Forecast, By Country
- Historical Market Size Value (USD Million) & Volume (Unit) Trend Analysis By Market Taxonomy, 2021 to 2025
- Market Size Value (USD Million) & Volume (Unit) Forecast By Market Taxonomy, 2026 to 2036
- By Country
- India
- ASEAN
- Australia & New Zealand
- Rest of South Asia and Pacific
- By Product Type
- By Source
- By Crop Type
- By Application
- By Country
- Market Attractiveness Analysis
- By Country
- By Product Type
- By Source
- By Crop Type
- By Application
- Key Takeaways
- Middle East & Africa Market Analysis and Forecast, By Country
- Historical Market Size Value (USD Million) & Volume (Unit) Trend Analysis By Market Taxonomy, 2021 to 2025
- Market Size Value (USD Million) & Volume (Unit) Forecast By Market Taxonomy, 2026 to 2036
- By Country
- Kingdom of Saudi Arabia
- Other GCC Countries
- Türkiye
- South Africa
- Other African Union
- Rest of Middle East & Africa
- By Product Type
- By Source
- By Crop Type
- By Application
- By Country
- Market Attractiveness Analysis
- By Country
- By Product Type
- By Source
- By Crop Type
- By Application
- Key Takeaways
- Key Countries Market Analysis
- USA
- Pricing Analysis
- Market Share Analysis, 2025
- By Product Type
- By Source
- By Crop Type
- By Application
- Canada
- Pricing Analysis
- Market Share Analysis, 2025
- By Product Type
- By Source
- By Crop Type
- By Application
- Mexico
- Pricing Analysis
- Market Share Analysis, 2025
- By Product Type
- By Source
- By Crop Type
- By Application
- Brazil
- Pricing Analysis
- Market Share Analysis, 2025
- By Product Type
- By Source
- By Crop Type
- By Application
- Chile
- Pricing Analysis
- Market Share Analysis, 2025
- By Product Type
- By Source
- By Crop Type
- By Application
- Germany
- Pricing Analysis
- Market Share Analysis, 2025
- By Product Type
- By Source
- By Crop Type
- By Application
- UK
- Pricing Analysis
- Market Share Analysis, 2025
- By Product Type
- By Source
- By Crop Type
- By Application
- Italy
- Pricing Analysis
- Market Share Analysis, 2025
- By Product Type
- By Source
- By Crop Type
- By Application
- Spain
- Pricing Analysis
- Market Share Analysis, 2025
- By Product Type
- By Source
- By Crop Type
- By Application
- France
- Pricing Analysis
- Market Share Analysis, 2025
- By Product Type
- By Source
- By Crop Type
- By Application
- India
- Pricing Analysis
- Market Share Analysis, 2025
- By Product Type
- By Source
- By Crop Type
- By Application
- ASEAN
- Pricing Analysis
- Market Share Analysis, 2025
- By Product Type
- By Source
- By Crop Type
- By Application
- Australia & New Zealand
- Pricing Analysis
- Market Share Analysis, 2025
- By Product Type
- By Source
- By Crop Type
- By Application
- China
- Pricing Analysis
- Market Share Analysis, 2025
- By Product Type
- By Source
- By Crop Type
- By Application
- Japan
- Pricing Analysis
- Market Share Analysis, 2025
- By Product Type
- By Source
- By Crop Type
- By Application
- South Korea
- Pricing Analysis
- Market Share Analysis, 2025
- By Product Type
- By Source
- By Crop Type
- By Application
- Russia
- Pricing Analysis
- Market Share Analysis, 2025
- By Product Type
- By Source
- By Crop Type
- By Application
- Poland
- Pricing Analysis
- Market Share Analysis, 2025
- By Product Type
- By Source
- By Crop Type
- By Application
- Hungary
- Pricing Analysis
- Market Share Analysis, 2025
- By Product Type
- By Source
- By Crop Type
- By Application
- Kingdom of Saudi Arabia
- Pricing Analysis
- Market Share Analysis, 2025
- By Product Type
- By Source
- By Crop Type
- By Application
- Türkiye
- Pricing Analysis
- Market Share Analysis, 2025
- By Product Type
- By Source
- By Crop Type
- By Application
- South Africa
- Pricing Analysis
- Market Share Analysis, 2025
- By Product Type
- By Source
- By Crop Type
- By Application
- USA
- Market Structure Analysis
- Competition Dashboard
- Competition Benchmarking
- Market Share Analysis of Top Players
- By Regional
- By Product Type
- By Source
- By Crop Type
- By Application
- Emerging Startups
- Innovation Benchmarking
- Competition Analysis
- Competition Deep Dive
- Bayer
- Overview
- Product Portfolio
- Profitability by Market Segments (Product/Region/Sales Channel)
- Sales Footprint
- Strategy Overview
- Marketing Strategy
- Product Strategy
- Channel Strategy
- Syngenta
- BASF
- Corteva Agriscience
- Novonesis
- UPL
- Valent BioSciences
- Lallemand
- Bayer
- Case Studies
- Success Stories
- Recent Developments
- Competition Deep Dive
- Assumptions & Acronyms Used


