Reports

- Global Locations -

Headquarters

Future Market Insights, Inc.

Christiana Corporate, 200
Continental Drive, Suite 401,
Newark, Delaware - 19713,
United States

T: +1-845-579-5705

Americas

Future Market Insights, Inc.

616 Corporate Way, Suite 2-9018,
Valley Cottage, NY 10989, United States

T: +1-347-918-3531

MEA

Future Market Insights

1602-6 Jumeirah Bay X2 Tower, Plot No: JLT-PH2-X2A,
Jumeirah Lakes Towers, Dubai,
United Arab Emirates

Europe

Future Market Insights

3rd Floor, 207 Regent Street,
W1B 3HH London
United Kingdom

T: + 44 (0) 20 8123 9659
D: +44 (0) 20 3287 4268

Asia Pacific

Future Market Insights

IndiaLand Global Tech Park, Unit UG-1, Behind Grand HighStreet, Phase 1, Hinjawadi, MH, Pune – 411057, India

Professional Services Automation Software Market Outlook

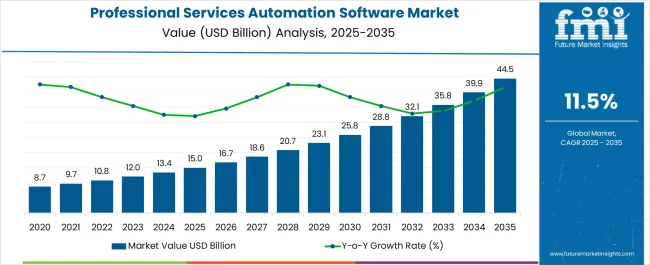
The global professional services automation software market size was valued at US$ 12,038.66 million in 2023, and is estimated to reach a revised size of US$ 35,754.17 million by 2033. This market is projected to record a CAGR of 11.5% during the analysis period.

Increasingly, businesses are digitizing and automating their processes, which leads to an increase in the demand for process automation. Key factors expected to drive PSA software market growth in the forecast period include the growing need for automation services and a reduction in overall costs. This is to increase operational productivity in terms of revenue among professional service organizations.

Consultants' increasing demand for advanced mobility services, as well as a growing need for scalable and flexible professional services, are expected to support market development.

In recent years, the market has seen several innovative solution offerings, contributing to its growth of the market. For instance, VOGSY offers business process support and integration across the core processes of professional services organizations utilizing Google's G Suite.

The professional services automation software was built on a single, accessible platform. It supports employees across all departments, making it unique for creating an engaging PSA that allows users to accomplish more.

Due to their unparalleled deployment flexibility, scalability, enhanced collaboration, cost-effectiveness benefits, and global availability, cloud-based deployment types are expected to have a considerable impact on the accounts receivable automation market during the forecast period. Cloud-based payment collection solutions are available through several vendors in the market and are available under subscriptions and pay-per-use plans.

Along with enhancing profit margins, automating various time-consuming tasks, and supporting robust communication between internal stakeholders of a business, this software supports growth in the marketplace.

As a supplementary benefit, PSA solutions provide a unified platform to enable teams to efficiently collaborate and complete tasks or projects within a short period. For example, PSA solutions allow teams to track resources, project progress, and costs all in one place, allowing stakeholders to stay informed and make timely decisions.

Increasing demand for integrating professional services automation software with other enterprise systems, such as Customer Relationship Management (CRM) and Enterprise Resource Planning (ERP) systems, is expected to offer new growth opportunities for PSA software vendors.

Attributes Details
Professional Services Automation Software Market Value (2023) US$ 12,038.66 million
Professional Services Automation Software Market Expected Value (2033) US$ 35,754.17 million
Professional Services Automation Software Market Projected CAGR (2023 to 2033) 11.5%

Don't pay for what you don't need

Customize your report by selecting specific countries or regions and save 30%!

Global Professional Services Automation Software Market Historical Analysis (2018 to 2022) Vs. Forecast Outlook (2023 to 2033)

The global professional services automation software market recorded a CAGR of 12.1% CAGR over the past 10 years. The market is expected to record a CAGR of 11.5% over the forthcoming decade. A surge in remote working practices and hybrid projects resulted from the pandemic, which positively impacted professional services automation software.

In the face of the pandemic, companies adopted PSA software across their business models to balance integrated project delivery with increased profitability and efficient resource utilization. Invoice and expense management, automated billing, and resource allocation are the fundamental functions of professional services automation software.

The increased demand for efficient project management and resource allocation solutions, along with the growing trend of cloud-based technology adoption, is expected to drive the market. The market may see increased competition among vendors, with the introduction of new, advanced solutions, and increased emphasis on Artificial Intelligence and Machine Learning.

Historical CAGR (2018 to 2022) 12.1%
Historical Market Value (2022) US$ 10,797 million
Forecast CAGR 11.5%

Comparative Analysis of Adjacent Professional Services Automation Software Markets

Professional Services Automation Software Market:

Differentiating Aspects Professional Services Automation Software Market
CAGR (2023 to 2033) 11.5%
Market Valuation in 2023 US$ 12,038.66 million
Projected Market Value in 2033 US$ 35,754.17 million
Growth Factors Extension of Machine Learning technology & Artificial Intelligence (AI).
Opportunities Growth of digitalized solutions, including cloud-based business models.
Key Trends High investment in core technology.

Digital Marketing Software Market:

Differentiating Aspects Digital Marketing Software Market
CAGR (2023 to 2033) 19.5%
Market Valuation in 2023 US$ 78.07 billion
Projected Market Value in 2033 US$ 463.62 billion
Growth Factors Rising adoption of big data, Augmented Reality (AR), and Virtual Reality (VR) technologies
Opportunities Increasing use of digital channels for advertising.
Key Trends The adoption of modern advertising strategies, such as mobile advertising.

Mining Automation Market:

Differentiating Aspects Mining Automation Market
CAGR (2023 to 2033) 7.4%
Market Valuation in 2023 US$ 4.94 billion
Projected Market Value in 2033 US$ 10.09 billion
Growth Factors Rapid advancement in technology, such as AI and robotics.
Opportunities The rise of automation technology in the mining industry has created opportunities.
Key Trends Increased adoption of autonomous mining equipment.
Sudip Saha
Sudip Saha

Principal Consultant

Talk to Analyst

Find your sweet spots for generating winning opportunities in this market.

Significant Factors Driving Professional Services Automation Software Market

  • Increased Demand for Efficiency and Productivity

The demand for Professional Services Automation (PSA) software is driven by the need for organizations to streamline and automate their operations, improve efficiency, and increase productivity. For instance, PSA software can be used to automate time tracking, resource management, project management, and billing processes, reducing the time and cost of managing services and improving customer satisfaction.

  • Growing Adoption of Cloud Technology

The shift towards cloud-based solutions has led to an increase in the adoption of professional services automation software, which is accessible from anywhere, making it easier for remote teams to collaborate. Cloud-based PSA software allows companies to access data in real time, eliminating the need for clunky manual processes and enabling organizations to better scale their operations.

  • Need for Real-time Data and Reporting

The need for real-time data and reporting to make informed business decisions is driving the demand for professional services automation software. PSA software can provide insights into the number of projects in progress, staff billable and non-billable hours, and project profitability that can help organizations make more informed decisions.

  • Growing Competition and the Need for Differentiation

Organizations are looking to differentiate themselves from their competitors through better service offerings and customer experience, and professional services automation software can help achieve these goals. For instance, by leveraging professional services automation software, an organization can automate and streamline many of its service operations, like service ticketing, invoicing, and asset management. This can improve customer satisfaction and response times.

  • Compliance and Regulatory Requirements

The need to comply with various regulations and standards is also driving the demand for professional services automation software, as it helps organizations maintain proper record-keeping and tracking. For example, in the healthcare sector, organizations must adhere to the Health Insurance Portability and Accountability Act (HIPAA), which requires the secure storage and transmission of medical records. PSA software can help companies maintain compliance with these regulations.

Comprehensive Analysis of the Opportunities Impacting the Professional Services Automation Software Market: Initiatives Taken by Several Governments

Governments are digitizing their economic operations, so professional services automation software is expected to have robust market opportunities. To accelerate economic growth, various governments, including Canada, India, Germany, and Saudi Arabia, support regional market players.

The government of Canada, for instance, provided US$ 4 billion to the Canada Digital Adoption Program (CDAP) in March 2022 to support the adoption of digital technologies by small and medium-sized enterprises (SMEs).

As part of this program, SMEs may receive US$ 2,400 microgrants for social media advertising, website development, and other automated web actions related to their e-commerce business. Global implementation of professional services automation software encourages industry participants to invest in Research and Development activities to create innovation and increase brand value.

Get the data you need at a Fraction of the cost

Personalize your report by choosing insights you need
and save 40%!

Identifying the Restraints of the Professional Services Automation Software Market

  • High Initial Cost and Limited Customization

Professional Services Automation (PSA) software can be expensive, especially for small businesses or startups that may not have the budget to invest in such technology. Some PSA software solutions may have limited customization options, making it difficult to adapt to the unique needs and requirements of an organization. PSA software requires ongoing maintenance and support, which can be an added cost and resource burden for organizations.

  • Resistance to Change & User Adoption

PSA software can be disruptive to the existing processes and workflows of an organization, which can lead to resistance from employees who may be comfortable with their current ways of working. Integrating PSA software with existing systems can be challenging and time-consuming, requiring technical expertise and resources. Getting employees to use PSA software can be a challenge, as they may require training and support to become proficient at using the updated technology.

Application Insights: Technology Segment to Pick up the Pace

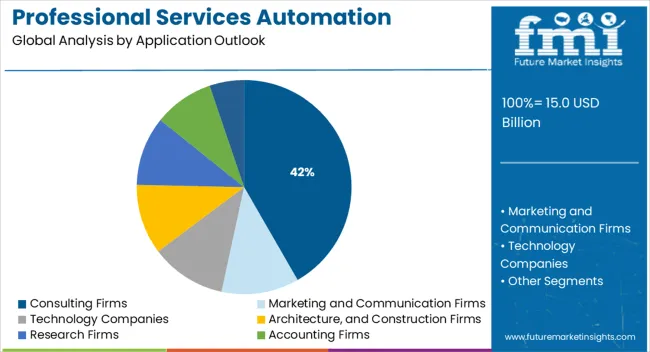
During 2023, the technology segment acquired a significant market share, valued at US$ 5,018.22 million. Technology solution providers use PSA solutions to shorten their solution's time to market and improve transparency.

To target a wider potential audience, various PSA solution providers for technology companies are emphasizing mergers and collaborations. For instance, in 2022 DXC Technology announced the formation of a new DXC ServiceNow Strategic Business Group, making DXC one of the significant ServiceNow globally.

By 2033, the marketing and communication segment is expected to record a CAGR of 12.8%. This segment is expected to expand at a considerable rate through 2033. PSA solution developers are launching their new PSA innovations in the market for various communication & marketing applications, which may drive the segment's growth.

For example, Adobe recently launched its new Web Experience Management (WEM) platform, providing a comprehensive suite of tools for digital marketers to manage their customer experience. Other PSA solution providers, such as Salesforce and Microsoft, are also launching their WEM platforms, offering features such as AI-driven insights, personalization, and automated customer segmentation.

Deployment Type Insights: On-premise Segment is Expected to be the Significant Contributor to the Market

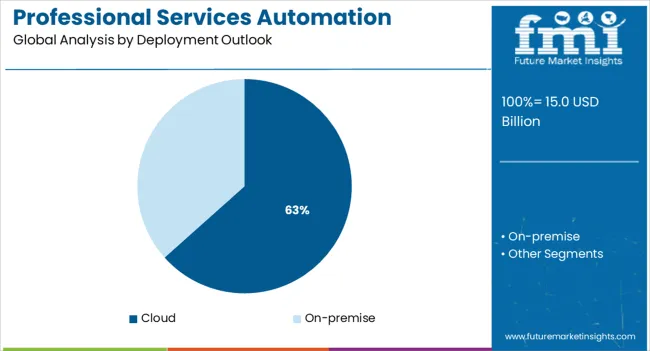
On-premise PSA software deployments are expected to account for a significant share of the market in 2023, representing around 51%. On-premise PSA solutions are more secure & private and less susceptible to digital threats, leading to strong growth in this segment.

PSA solutions that are deployed on-premises can also perform their work and provide safe access to data even when the internet connection is interrupted since their local storage systems store the data securely. To improve their brand identity, market players participate in various exhibitions to advertise their on-premise PSA solutions.

For example, Oracle recently participated in ServiceNow’s Knowledge20 Digital Experience, where it showcased its latest on-premise PSA solutions. Oracle also highlighted its Oracle Field Service Cloud, which can be used to automatically assign technicians and materials to jobs, analyze and optimize routes, and track technician performance.

Between 2023 and 2033, the cloud-based PSA market is expected to grow by 14.7%. Cloud-based PSA solutions offer several advantages. This includes quick deployment, remote work management, unlimited storage capacity, and reduced Total Cost of Ownership (TCO) and CapEx costs, driving the segment's growth. To improve their cloud-based professional services automation software portfolio, industry participants such as Kimble Applications, Projector PSA, and SAP SE emphasize strategic partnerships. For instance, Kimble Applications has partnered with Google Cloud to provide their customers with end-to-end cloud-based professional services automation software on the Google Cloud Platform.

Region Wise: North America Holds Maximum Market Share

In 2023, North America held a significant market share of US$ 4,897 million, or 43.5% of the market. New solutions introduced by market players and the integration of advanced technologies, such as Artificial Intelligence (AI) and Machine Learning (ML), are creating positive traction for PSA solutions.

Several established market players, including Appirio, Salesforce, Oracle Corporation, Upland Software, and NetSuite OpenAir, Inc., are also in the market. Market players are launching their latest products in this potential region to boost profitability and build their customer base thus, driving the market growth. For example, Appirio recently introduced a suite of solutions called Cloud Management Platform to help organizations manage their cloud investments.

Regions Leading in Professional Services Automation Software Market: Country-Wise Analysis

The United States PSA Software Market is Expected to Dominate North America Region

Currently, the United States holds a significant share of the professional services automation market in terms of revenues. This market growth is mostly due to the early adoption of core technologies, including cloud computing and machine learning.

This growth has also been attributed to substantial investments by IT companies in developing and deploying cloud-based solutions for PSA software. To boost their revenue growth, service providers in this market are focusing on partnerships and acquisitions.

For instance, the professional services market in the United States posted a 9.4% growth rate from 2019 to 2020 (Services Performance Insight, LLC), and it is believed that the growth may be driven by the increasing demand for the Professional Services Automation (PSA) software market.

Why is Germany’s Professional Services Automation Software Market Considered Lucrative within Europe?

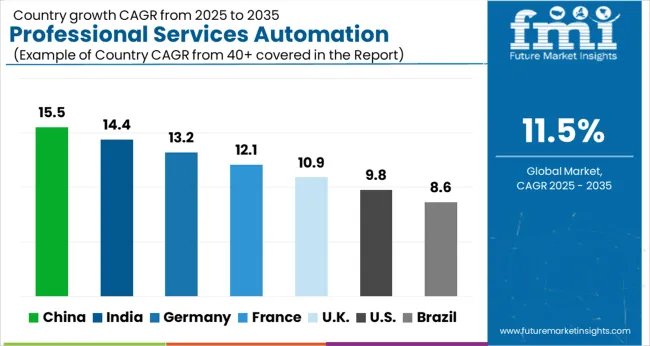
According to forecasts, Germany may expand at a CAGR of 5.3% in the next five years. This is due to factors such as a rise in IT spending supported by government initiatives in emerging economies such as Germany. For example, the federal government in Germany has committed to spending more than US$ 3.93 billion on its ‘AI Made in Germany’ initiative over the next seven years.

What Makes India Professional Services Automation Software Market Highly Attractive?

The Asia Pacific professional services automation software market is dominated by India with a market share of 54.0% and is expected to record a CAGR of 14.0% through 2033. This is attributed to increasing digitalization and the emergence of creative professional services automation startups in the region.

Cloud integrations and online service delivery play a key role in increasing industry growth. Regional key players are enhancing their research and development operations and expanding their professional services and automation solutions portfolio.

For example, in March 2022, Nividous Software Solutions collaborated with Damco Solutions to streamline the core and non-core business processes of various industries using intelligent automation processes.

Emerging start-ups and SMEs are focusing on establishing strategic partnerships with significant market players for the adoption of professional services automation software.

Start-up Ecosystem: The Professional Services Automation Software Market

There are many start-ups in the professional services automation software market. Some of the popular ones include Workfront, Replicon, Mavenlink, Wrike, Celoxis, Paymo, Accelo, Clarizen, Projectmates, Hive, and others. These start-ups offer various features like project management, time tracking, resource management, invoicing, and more, to help professional services organizations streamline their operations and increase efficiency.
Competitive Landscape: Key Players Operating in the Global Professional Services Automation Software Market

Since there are many players in the professional services automation software market, it is moderately fragmented, because players are introducing innovative products and implementing technological advancements to gain a competitive advantage. In the coming years, the market's growth capacity is likely to be supported by irreplaceable value propositions in product offerings.
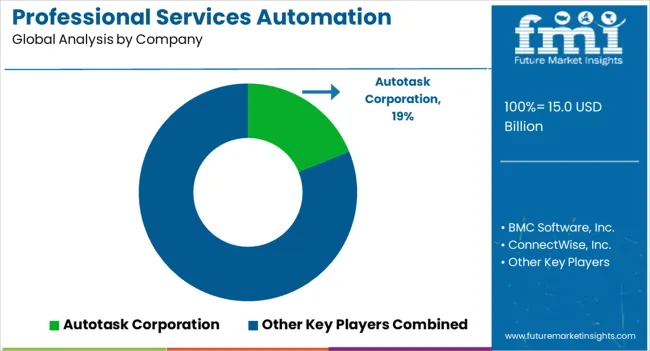
Key Players Operating in the Market are

  • Autotask Corporation
  • BMC Software, Inc.
  • ConnectWise, Inc.
  • Deltek, Inc.
  • FinancialForce.com
  • Kimble Apps
  • Microsoft Corporation
  • NetSuite OpenAir, Inc.
  • Oracle Corporation
  • Planview

Recent Development:

Various Fintech companies are innovating blockchain-based accounts receivable automation solutions to enhance their accounts receivable cycle.

  • Singapore-based FinTech Global Direct recently launched a blockchain platform aimed at solving the challenges associated with global B2B transactions, which typically take six days to complete. Platform features include tour operator ticketing, rewards management, and alternate currency payment gateways.

Several market players, such as NetSuite OpenAir, Inc., ProductDossier Solutions, and Microsoft Corporation, are putting a great deal of emphasis on expanding their customer base to increase revenue in the market.

  • ProductDossier Solutions announced in March 2022 that several companies had signed agreements to implement TouchBase, its flagship software for professional services automation. Customers include Tiger Analytics, Aujas Cyber Security, Hical Technologies, and Tata Communications.
  • In February 2020, through self-service API connectors McAfee® MVISION Cloud, Clarizen, the enterprise collaborative work management company, joined the McAfee CASB Connect Partner Program.

Scope of Report

Attribute Details
Forecast Period 2023 to 2033
Historical Data Available for 2018 to 2023
Market Analysis US$ million for Value and MT for Volume
Key Regions Covered
  • North America
  • Latin America
  • Europe
  • The Middle East and Africa
  • East Asia
Key Countries Covered United States, Canada, Brazil, Mexico, Chile, Peru, Germany, United Kingdom, Spain, Italy, France, Russia, Poland, China, India, Japan, Australia, New Zealand, GCC Countries, North Africa, South Africa, and Türkiye
Key Segments Covered
  • Application
  • Deployment
  • Region
Key Companies Profiled
  • Autotask Corporation
  • BMC Software, Inc.
  • ConnectWise, Inc.
  • Deltek, Inc.
  • FinancialForce.com
  • Kimble Apps
  • Microsoft Corporation
  • NetSuite OpenAir, Inc.
  • Oracle Corporation
  • Planview
Report Coverage Market Forecast, Company Share Analysis, Competition Intelligence, DROT Analysis, Market Dynamics and Challenges, and Strategic Growth Initiatives
Customization & Pricing Available upon Request

Market Segmentation by Category

By Application Outlook:

  • Consulting Firms
  • Marketing and Communication Firms
  • Technology Companies
  • Architecture, and Construction Firms
  • Research Firms
  • Accounting Firms
  • Others

By Deployment Outlook:

  • Cloud
  • On-premise

By Region Outlook:

  • North America
  • Latin America
  • Europe
  • The Middle East and Africa
  • East Asia

Frequently Asked Questions

What is the Current Market Valuation?

The market is estimated to secure a valuation of US$ 12,038.66 million in 2023.

What Makes India’s Market Highly Attractive?

The emergence of creative professional services automation startups is highly attractive.

What is the Growth Outlook for India's Market?

India is projected to exhibit a CAGR of 14% through 2033.

What is the Growth Outlook for Germany’s Market?

Germany is likely to account for a CAGR of 5.3% through 2033.

How is the Historical Performance of the Market?

The market expanded at a CAGR of 12.1% between 2018 and 2022.

Table of Content

1. Executive Summary | Professional Services Automation Software Market 

    1.1. Global Market Outlook

    1.2. Demand-side Trends

    1.3. Supply-side Trends

    1.4. Technology Roadmap Analysis

    1.5. Analysis and Recommendations

2. Market Overview

    2.1. Market Coverage / Taxonomy

    2.2. Market Definition / Scope / Limitations

3. Market Background

    3.1. Market Dynamics

        3.1.1. Drivers

        3.1.2. Restraints

        3.1.3. Opportunity

        3.1.4. Trends

    3.2. Scenario Forecast

        3.2.1. Demand in Optimistic Scenario

        3.2.2. Demand in Likely Scenario

        3.2.3. Demand in Conservative Scenario

    3.3. Opportunity Map Analysis

    3.4. Investment Feasibility Matrix

    3.5. PESTLE and Porter’s Analysis

    3.6. Regulatory Landscape

        3.6.1. By Key Regions

        3.6.2. By Key Countries

    3.7. Regional Parent Market Outlook

4. Global Market Analysis 2018 to 2022 and Forecast, 2023 to 2033

    4.1. Historical Market Size Value (US$ Million) Analysis, 2018 to 2022

    4.2. Current and Future Market Size Value (US$ Million) Projections, 2023 to 2033

        4.2.1. Y-o-Y Growth Trend Analysis

        4.2.2. Absolute $ Opportunity Analysis

5. Global Market Analysis 2018 to 2022 and Forecast 2023 to 2033, By Solutions

    5.1. Introduction / Key Findings

    5.2. Historical Market Size Value (US$ Million) Analysis By Solutions, 2018 to 2022

    5.3. Current and Future Market Size Value (US$ Million) Analysis and Forecast By Solutions, 2023 to 2033

        5.3.1. Project Management

        5.3.2. Billing & Invoice Management

        5.3.3. Resource Management

        5.3.4. Timesheet & Expense Management

        5.3.5. Others

    5.4. Y-o-Y Growth Trend Analysis By Solutions, 2018 to 2022

    5.5. Absolute $ Opportunity Analysis By Solutions, 2023 to 2033

6. Global Market Analysis 2018 to 2022 and Forecast 2023 to 2033, By Application

    6.1. Introduction / Key Findings

    6.2. Historical Market Size Value (US$ Million) Analysis By Application, 2018 to 2022

    6.3. Current and Future Market Size Value (US$ Million) Analysis and Forecast By Application, 2023 to 2033

        6.3.1. Consulting Firms

        6.3.2. Technology Companies

        6.3.3. Marketing and Communication Firms

        6.3.4. Others

    6.4. Y-o-Y Growth Trend Analysis By Application, 2018 to 2022

    6.5. Absolute $ Opportunity Analysis By Application, 2023 to 2033

7. Global Market Analysis 2018 to 2022 and Forecast 2023 to 2033, By Deployment Type 

    7.1. Introduction / Key Findings

    7.2. Historical Market Size Value (US$ Million) Analysis By Deployment Type , 2018 to 2022

    7.3. Current and Future Market Size Value (US$ Million) Analysis and Forecast By Deployment Type , 2023 to 2033

        7.3.1. On-premise

        7.3.2. Cloud

    7.4. Y-o-Y Growth Trend Analysis By Deployment Type , 2018 to 2022

    7.5. Absolute $ Opportunity Analysis By Deployment Type , 2023 to 2033

8. Global Market Analysis 2018 to 2022 and Forecast 2023 to 2033, By Enterprise Size

    8.1. Introduction / Key Findings

    8.2. Historical Market Size Value (US$ Million) Analysis By Enterprise Size, 2018 to 2022

    8.3. Current and Future Market Size Value (US$ Million) Analysis and Forecast By Enterprise Size, 2023 to 2033

        8.3.1. Large Enterprises

        8.3.2. Small and Medium-Sized Enterprises

    8.4. Y-o-Y Growth Trend Analysis By Enterprise Size, 2018 to 2022

    8.5. Absolute $ Opportunity Analysis By Enterprise Size, 2023 to 2033

9. Global Market Analysis 2018 to 2022 and Forecast 2023 to 2033, By Region

    9.1. Introduction

    9.2. Historical Market Size Value (US$ Million) Analysis By Region, 2018 to 2022

    9.3. Current Market Size Value (US$ Million) Analysis and Forecast By Region, 2023 to 2033

        9.3.1. North America

        9.3.2. Latin America

        9.3.3. Europe

        9.3.4. South Asia

        9.3.5. East Asia

        9.3.6. Oceania

        9.3.7. MEA

    9.4. Market Attractiveness Analysis By Region

10. North America Market Analysis 2018 to 2022 and Forecast 2023 to 2033, By Country

    10.1. Historical Market Size Value (US$ Million) Trend Analysis By Market Taxonomy, 2018 to 2022

    10.2. Market Size Value (US$ Million) Forecast By Market Taxonomy, 2023 to 2033

        10.2.1. By Country

            10.2.1.1. USA

            10.2.1.2. Canada

        10.2.2. By Solutions

        10.2.3. By Application

        10.2.4. By Deployment Type

        10.2.5. By Enterprise Size

    10.3. Market Attractiveness Analysis

        10.3.1. By Country

        10.3.2. By Solutions

        10.3.3. By Application

        10.3.4. By Deployment Type

        10.3.5. By Enterprise Size

    10.4. Key Takeaways

11. Latin America Market Analysis 2018 to 2022 and Forecast 2023 to 2033, By Country

    11.1. Historical Market Size Value (US$ Million) Trend Analysis By Market Taxonomy, 2018 to 2022

    11.2. Market Size Value (US$ Million) Forecast By Market Taxonomy, 2023 to 2033

        11.2.1. By Country

            11.2.1.1. Brazil

            11.2.1.2. Mexico

            11.2.1.3. Rest of Latin America

        11.2.2. By Solutions

        11.2.3. By Application

        11.2.4. By Deployment Type

        11.2.5. By Enterprise Size

    11.3. Market Attractiveness Analysis

        11.3.1. By Country

        11.3.2. By Solutions

        11.3.3. By Application

        11.3.4. By Deployment Type

        11.3.5. By Enterprise Size

    11.4. Key Takeaways

12. Europe Market Analysis 2018 to 2022 and Forecast 2023 to 2033, By Country

    12.1. Historical Market Size Value (US$ Million) Trend Analysis By Market Taxonomy, 2018 to 2022

    12.2. Market Size Value (US$ Million) Forecast By Market Taxonomy, 2023 to 2033

        12.2.1. By Country

            12.2.1.1. Germany

            12.2.1.2. United Kingdom

            12.2.1.3. France

            12.2.1.4. Spain

            12.2.1.5. Italy

            12.2.1.6. Rest of Europe

        12.2.2. By Solutions

        12.2.3. By Application

        12.2.4. By Deployment Type

        12.2.5. By Enterprise Size

    12.3. Market Attractiveness Analysis

        12.3.1. By Country

        12.3.2. By Solutions

        12.3.3. By Application

        12.3.4. By Deployment Type

        12.3.5. By Enterprise Size

    12.4. Key Takeaways

13. South Asia Market Analysis 2018 to 2022 and Forecast 2023 to 2033, By Country

    13.1. Historical Market Size Value (US$ Million) Trend Analysis By Market Taxonomy, 2018 to 2022

    13.2. Market Size Value (US$ Million) Forecast By Market Taxonomy, 2023 to 2033

        13.2.1. By Country

            13.2.1.1. India

            13.2.1.2. Malaysia

            13.2.1.3. Singapore

            13.2.1.4. Thailand

            13.2.1.5. Rest of South Asia

        13.2.2. By Solutions

        13.2.3. By Application

        13.2.4. By Deployment Type

        13.2.5. By Enterprise Size

    13.3. Market Attractiveness Analysis

        13.3.1. By Country

        13.3.2. By Solutions

        13.3.3. By Application

        13.3.4. By Deployment Type

        13.3.5. By Enterprise Size

    13.4. Key Takeaways

14. East Asia Market Analysis 2018 to 2022 and Forecast 2023 to 2033, By Country

    14.1. Historical Market Size Value (US$ Million) Trend Analysis By Market Taxonomy, 2018 to 2022

    14.2. Market Size Value (US$ Million) Forecast By Market Taxonomy, 2023 to 2033

        14.2.1. By Country

            14.2.1.1. China

            14.2.1.2. Japan

            14.2.1.3. South Korea

        14.2.2. By Solutions

        14.2.3. By Application

        14.2.4. By Deployment Type

        14.2.5. By Enterprise Size

    14.3. Market Attractiveness Analysis

        14.3.1. By Country

        14.3.2. By Solutions

        14.3.3. By Application

        14.3.4. By Deployment Type

        14.3.5. By Enterprise Size

    14.4. Key Takeaways

15. Oceania Market Analysis 2018 to 2022 and Forecast 2023 to 2033, By Country

    15.1. Historical Market Size Value (US$ Million) Trend Analysis By Market Taxonomy, 2018 to 2022

    15.2. Market Size Value (US$ Million) Forecast By Market Taxonomy, 2023 to 2033

        15.2.1. By Country

            15.2.1.1. Australia

            15.2.1.2. New Zealand

        15.2.2. By Solutions

        15.2.3. By Application

        15.2.4. By Deployment Type

        15.2.5. By Enterprise Size

    15.3. Market Attractiveness Analysis

        15.3.1. By Country

        15.3.2. By Solutions

        15.3.3. By Application

        15.3.4. By Deployment Type

        15.3.5. By Enterprise Size

    15.4. Key Takeaways

16. MEA Market Analysis 2018 to 2022 and Forecast 2023 to 2033, By Country

    16.1. Historical Market Size Value (US$ Million) Trend Analysis By Market Taxonomy, 2018 to 2022

    16.2. Market Size Value (US$ Million) Forecast By Market Taxonomy, 2023 to 2033

        16.2.1. By Country

            16.2.1.1. GCC Countries

            16.2.1.2. South Africa

            16.2.1.3. Israel

            16.2.1.4. Rest of MEA

        16.2.2. By Solutions

        16.2.3. By Application

        16.2.4. By Deployment Type

        16.2.5. By Enterprise Size

    16.3. Market Attractiveness Analysis

        16.3.1. By Country

        16.3.2. By Solutions

        16.3.3. By Application

        16.3.4. By Deployment Type

        16.3.5. By Enterprise Size

    16.4. Key Takeaways

17. Key Countries Market Analysis

    17.1. USA

        17.1.1. Pricing Analysis

        17.1.2. Market Share Analysis, 2022

            17.1.2.1. By Solutions

            17.1.2.2. By Application

            17.1.2.3. By Deployment Type

            17.1.2.4. By Enterprise Size

    17.2. Canada

        17.2.1. Pricing Analysis

        17.2.2. Market Share Analysis, 2022

            17.2.2.1. By Solutions

            17.2.2.2. By Application

            17.2.2.3. By Deployment Type

            17.2.2.4. By Enterprise Size

    17.3. Brazil

        17.3.1. Pricing Analysis

        17.3.2. Market Share Analysis, 2022

            17.3.2.1. By Solutions

            17.3.2.2. By Application

            17.3.2.3. By Deployment Type

            17.3.2.4. By Enterprise Size

    17.4. Mexico

        17.4.1. Pricing Analysis

        17.4.2. Market Share Analysis, 2022

            17.4.2.1. By Solutions

            17.4.2.2. By Application

            17.4.2.3. By Deployment Type

            17.4.2.4. By Enterprise Size

    17.5. Germany

        17.5.1. Pricing Analysis

        17.5.2. Market Share Analysis, 2022

            17.5.2.1. By Solutions

            17.5.2.2. By Application

            17.5.2.3. By Deployment Type

            17.5.2.4. By Enterprise Size

    17.6. United Kingdom

        17.6.1. Pricing Analysis

        17.6.2. Market Share Analysis, 2022

            17.6.2.1. By Solutions

            17.6.2.2. By Application

            17.6.2.3. By Deployment Type

            17.6.2.4. By Enterprise Size

    17.7. France

        17.7.1. Pricing Analysis

        17.7.2. Market Share Analysis, 2022

            17.7.2.1. By Solutions

            17.7.2.2. By Application

            17.7.2.3. By Deployment Type

            17.7.2.4. By Enterprise Size

    17.8. Spain

        17.8.1. Pricing Analysis

        17.8.2. Market Share Analysis, 2022

            17.8.2.1. By Solutions

            17.8.2.2. By Application

            17.8.2.3. By Deployment Type

            17.8.2.4. By Enterprise Size

    17.9. Italy

        17.9.1. Pricing Analysis

        17.9.2. Market Share Analysis, 2022

            17.9.2.1. By Solutions

            17.9.2.2. By Application

            17.9.2.3. By Deployment Type

            17.9.2.4. By Enterprise Size

    17.10. India

        17.10.1. Pricing Analysis

        17.10.2. Market Share Analysis, 2022

            17.10.2.1. By Solutions

            17.10.2.2. By Application

            17.10.2.3. By Deployment Type

            17.10.2.4. By Enterprise Size

    17.11. Malaysia

        17.11.1. Pricing Analysis

        17.11.2. Market Share Analysis, 2022

            17.11.2.1. By Solutions

            17.11.2.2. By Application

            17.11.2.3. By Deployment Type

            17.11.2.4. By Enterprise Size

    17.12. Singapore

        17.12.1. Pricing Analysis

        17.12.2. Market Share Analysis, 2022

            17.12.2.1. By Solutions

            17.12.2.2. By Application

            17.12.2.3. By Deployment Type

            17.12.2.4. By Enterprise Size

    17.13. Thailand

        17.13.1. Pricing Analysis

        17.13.2. Market Share Analysis, 2022

            17.13.2.1. By Solutions

            17.13.2.2. By Application

            17.13.2.3. By Deployment Type

            17.13.2.4. By Enterprise Size

    17.14. China

        17.14.1. Pricing Analysis

        17.14.2. Market Share Analysis, 2022

            17.14.2.1. By Solutions

            17.14.2.2. By Application

            17.14.2.3. By Deployment Type

            17.14.2.4. By Enterprise Size

    17.15. Japan

        17.15.1. Pricing Analysis

        17.15.2. Market Share Analysis, 2022

            17.15.2.1. By Solutions

            17.15.2.2. By Application

            17.15.2.3. By Deployment Type

            17.15.2.4. By Enterprise Size

    17.16. South Korea

        17.16.1. Pricing Analysis

        17.16.2. Market Share Analysis, 2022

            17.16.2.1. By Solutions

            17.16.2.2. By Application

            17.16.2.3. By Deployment Type

            17.16.2.4. By Enterprise Size

    17.17. Australia

        17.17.1. Pricing Analysis

        17.17.2. Market Share Analysis, 2022

            17.17.2.1. By Solutions

            17.17.2.2. By Application

            17.17.2.3. By Deployment Type

            17.17.2.4. By Enterprise Size

    17.18. New Zealand

        17.18.1. Pricing Analysis

        17.18.2. Market Share Analysis, 2022

            17.18.2.1. By Solutions

            17.18.2.2. By Application

            17.18.2.3. By Deployment Type

            17.18.2.4. By Enterprise Size

    17.19. GCC Countries

        17.19.1. Pricing Analysis

        17.19.2. Market Share Analysis, 2022

            17.19.2.1. By Solutions

            17.19.2.2. By Application

            17.19.2.3. By Deployment Type

            17.19.2.4. By Enterprise Size

    17.20. South Africa

        17.20.1. Pricing Analysis

        17.20.2. Market Share Analysis, 2022

            17.20.2.1. By Solutions

            17.20.2.2. By Application

            17.20.2.3. By Deployment Type

            17.20.2.4. By Enterprise Size

    17.21. Israel

        17.21.1. Pricing Analysis

        17.21.2. Market Share Analysis, 2022

            17.21.2.1. By Solutions

            17.21.2.2. By Application

            17.21.2.3. By Deployment Type

            17.21.2.4. By Enterprise Size

18. Market Structure Analysis

    18.1. Competition Dashboard

    18.2. Competition Benchmarking

    18.3. Market Share Analysis of Top Players

        18.3.1. By Regional

        18.3.2. By Solutions

        18.3.3. By Application

        18.3.4. By Deployment Type

        18.3.5. By Enterprise Size

19. Competition Analysis

    19.1. Competition Deep Dive

        19.1.1. Autotask Corporation

            19.1.1.1. Overview

            19.1.1.2. Product Portfolio

            19.1.1.3. Profitability by Market Segments

            19.1.1.4. Sales Footprint

            19.1.1.5. Strategy Overview

                19.1.1.5.1. Marketing Strategy

        19.1.2. BMC Software, Inc.

            19.1.2.1. Overview

            19.1.2.2. Product Portfolio

            19.1.2.3. Profitability by Market Segments

            19.1.2.4. Sales Footprint

            19.1.2.5. Strategy Overview

                19.1.2.5.1. Marketing Strategy

        19.1.3. ConnectWise, Inc.

            19.1.3.1. Overview

            19.1.3.2. Product Portfolio

            19.1.3.3. Profitability by Market Segments

            19.1.3.4. Sales Footprint

            19.1.3.5. Strategy Overview

                19.1.3.5.1. Marketing Strategy

        19.1.4. Deltek, Inc.

            19.1.4.1. Overview

            19.1.4.2. Product Portfolio

            19.1.4.3. Profitability by Market Segments

            19.1.4.4. Sales Footprint

            19.1.4.5. Strategy Overview

                19.1.4.5.1. Marketing Strategy

        19.1.5. FinancialForce.com

            19.1.5.1. Overview

            19.1.5.2. Product Portfolio

            19.1.5.3. Profitability by Market Segments

            19.1.5.4. Sales Footprint

            19.1.5.5. Strategy Overview

                19.1.5.5.1. Marketing Strategy

        19.1.6. Kimble Apps

            19.1.6.1. Overview

            19.1.6.2. Product Portfolio

            19.1.6.3. Profitability by Market Segments

            19.1.6.4. Sales Footprint

            19.1.6.5. Strategy Overview

                19.1.6.5.1. Marketing Strategy

        19.1.7. Microsoft Corporation

            19.1.7.1. Overview

            19.1.7.2. Product Portfolio

            19.1.7.3. Profitability by Market Segments

            19.1.7.4. Sales Footprint

            19.1.7.5. Strategy Overview

                19.1.7.5.1. Marketing Strategy

        19.1.8. NetSuite OpenAir, Inc.

            19.1.8.1. Overview

            19.1.8.2. Product Portfolio

            19.1.8.3. Profitability by Market Segments

            19.1.8.4. Sales Footprint

            19.1.8.5. Strategy Overview

                19.1.8.5.1. Marketing Strategy

        19.1.9. Oracle Corporation

            19.1.9.1. Overview

            19.1.9.2. Product Portfolio

            19.1.9.3. Profitability by Market Segments

            19.1.9.4. Sales Footprint

            19.1.9.5. Strategy Overview

                19.1.9.5.1. Marketing Strategy

        19.1.10. Planview

            19.1.10.1. Overview

            19.1.10.2. Product Portfolio

            19.1.10.3. Profitability by Market Segments

            19.1.10.4. Sales Footprint

            19.1.10.5. Strategy Overview

                19.1.10.5.1. Marketing Strategy

20. Assumptions & Acronyms Used

21. Research Methodology

Don't pay for what you don't need

Customize your report by selecting specific countries or regions and save 30%!

List of Tables

Table 1: Global Market Value (US$ Million) Forecast by Region, 2018 to 2033

Table 2: Global Market Value (US$ Million) Forecast by Solutions, 2018 to 2033

Table 3: Global Market Value (US$ Million) Forecast by Application, 2018 to 2033

Table 4: Global Market Value (US$ Million) Forecast by Deployment Type , 2018 to 2033

Table 5: Global Market Value (US$ Million) Forecast by Enterprise Size, 2018 to 2033

Table 6: North America Market Value (US$ Million) Forecast by Country, 2018 to 2033

Table 7: North America Market Value (US$ Million) Forecast by Solutions, 2018 to 2033

Table 8: North America Market Value (US$ Million) Forecast by Application, 2018 to 2033

Table 9: North America Market Value (US$ Million) Forecast by Deployment Type , 2018 to 2033

Table 10: North America Market Value (US$ Million) Forecast by Enterprise Size, 2018 to 2033

Table 11: Latin America Market Value (US$ Million) Forecast by Country, 2018 to 2033

Table 12: Latin America Market Value (US$ Million) Forecast by Solutions, 2018 to 2033

Table 13: Latin America Market Value (US$ Million) Forecast by Application, 2018 to 2033

Table 14: Latin America Market Value (US$ Million) Forecast by Deployment Type , 2018 to 2033

Table 15: Latin America Market Value (US$ Million) Forecast by Enterprise Size, 2018 to 2033

Table 16: Europe Market Value (US$ Million) Forecast by Country, 2018 to 2033

Table 17: Europe Market Value (US$ Million) Forecast by Solutions, 2018 to 2033

Table 18: Europe Market Value (US$ Million) Forecast by Application, 2018 to 2033

Table 19: Europe Market Value (US$ Million) Forecast by Deployment Type , 2018 to 2033

Table 20: Europe Market Value (US$ Million) Forecast by Enterprise Size, 2018 to 2033

Table 21: South Asia Market Value (US$ Million) Forecast by Country, 2018 to 2033

Table 22: South Asia Market Value (US$ Million) Forecast by Solutions, 2018 to 2033

Table 23: South Asia Market Value (US$ Million) Forecast by Application, 2018 to 2033

Table 24: South Asia Market Value (US$ Million) Forecast by Deployment Type , 2018 to 2033

Table 25: South Asia Market Value (US$ Million) Forecast by Enterprise Size, 2018 to 2033

Table 26: East Asia Market Value (US$ Million) Forecast by Country, 2018 to 2033

Table 27: East Asia Market Value (US$ Million) Forecast by Solutions, 2018 to 2033

Table 28: East Asia Market Value (US$ Million) Forecast by Application, 2018 to 2033

Table 29: East Asia Market Value (US$ Million) Forecast by Deployment Type , 2018 to 2033

Table 30: East Asia Market Value (US$ Million) Forecast by Enterprise Size, 2018 to 2033

Table 31: Oceania Market Value (US$ Million) Forecast by Country, 2018 to 2033

Table 32: Oceania Market Value (US$ Million) Forecast by Solutions, 2018 to 2033

Table 33: Oceania Market Value (US$ Million) Forecast by Application, 2018 to 2033

Table 34: Oceania Market Value (US$ Million) Forecast by Deployment Type , 2018 to 2033

Table 35: Oceania Market Value (US$ Million) Forecast by Enterprise Size, 2018 to 2033

Table 36: MEA Market Value (US$ Million) Forecast by Country, 2018 to 2033

Table 37: MEA Market Value (US$ Million) Forecast by Solutions, 2018 to 2033

Table 38: MEA Market Value (US$ Million) Forecast by Application, 2018 to 2033

Table 39: MEA Market Value (US$ Million) Forecast by Deployment Type , 2018 to 2033

Table 40: MEA Market Value (US$ Million) Forecast by Enterprise Size, 2018 to 2033
Sudip Saha
Sudip Saha

Principal Consultant

Talk to Analyst

Find your sweet spots for generating winning opportunities in this market.

List of Charts

Figure 1: Global Market Value (US$ Million) by Solutions, 2023 to 2033

Figure 2: Global Market Value (US$ Million) by Application, 2023 to 2033

Figure 3: Global Market Value (US$ Million) by Deployment Type , 2023 to 2033

Figure 4: Global Market Value (US$ Million) by Enterprise Size, 2023 to 2033

Figure 5: Global Market Value (US$ Million) by Region, 2023 to 2033

Figure 6: Global Market Value (US$ Million) Analysis by Region, 2018 to 2033

Figure 7: Global Market Value Share (%) and BPS Analysis by Region, 2023 to 2033

Figure 8: Global Market Y-o-Y Growth (%) Projections by Region, 2023 to 2033

Figure 9: Global Market Value (US$ Million) Analysis by Solutions, 2018 to 2033

Figure 10: Global Market Value Share (%) and BPS Analysis by Solutions, 2023 to 2033

Figure 11: Global Market Y-o-Y Growth (%) Projections by Solutions, 2023 to 2033

Figure 12: Global Market Value (US$ Million) Analysis by Application, 2018 to 2033

Figure 13: Global Market Value Share (%) and BPS Analysis by Application, 2023 to 2033

Figure 14: Global Market Y-o-Y Growth (%) Projections by Application, 2023 to 2033

Figure 15: Global Market Value (US$ Million) Analysis by Deployment Type , 2018 to 2033

Figure 16: Global Market Value Share (%) and BPS Analysis by Deployment Type , 2023 to 2033

Figure 17: Global Market Y-o-Y Growth (%) Projections by Deployment Type , 2023 to 2033

Figure 18: Global Market Value (US$ Million) Analysis by Enterprise Size, 2018 to 2033

Figure 19: Global Market Value Share (%) and BPS Analysis by Enterprise Size, 2023 to 2033

Figure 20: Global Market Y-o-Y Growth (%) Projections by Enterprise Size, 2023 to 2033

Figure 21: Global Market Attractiveness by Solutions, 2023 to 2033

Figure 22: Global Market Attractiveness by Application, 2023 to 2033

Figure 23: Global Market Attractiveness by Deployment Type , 2023 to 2033

Figure 24: Global Market Attractiveness by Enterprise Size, 2023 to 2033

Figure 25: Global Market Attractiveness by Region, 2023 to 2033

Figure 26: North America Market Value (US$ Million) by Solutions, 2023 to 2033

Figure 27: North America Market Value (US$ Million) by Application, 2023 to 2033

Figure 28: North America Market Value (US$ Million) by Deployment Type , 2023 to 2033

Figure 29: North America Market Value (US$ Million) by Enterprise Size, 2023 to 2033

Figure 30: North America Market Value (US$ Million) by Country, 2023 to 2033

Figure 31: North America Market Value (US$ Million) Analysis by Country, 2018 to 2033

Figure 32: North America Market Value Share (%) and BPS Analysis by Country, 2023 to 2033

Figure 33: North America Market Y-o-Y Growth (%) Projections by Country, 2023 to 2033

Figure 34: North America Market Value (US$ Million) Analysis by Solutions, 2018 to 2033

Figure 35: North America Market Value Share (%) and BPS Analysis by Solutions, 2023 to 2033

Figure 36: North America Market Y-o-Y Growth (%) Projections by Solutions, 2023 to 2033

Figure 37: North America Market Value (US$ Million) Analysis by Application, 2018 to 2033

Figure 38: North America Market Value Share (%) and BPS Analysis by Application, 2023 to 2033

Figure 39: North America Market Y-o-Y Growth (%) Projections by Application, 2023 to 2033

Figure 40: North America Market Value (US$ Million) Analysis by Deployment Type , 2018 to 2033

Figure 41: North America Market Value Share (%) and BPS Analysis by Deployment Type , 2023 to 2033

Figure 42: North America Market Y-o-Y Growth (%) Projections by Deployment Type , 2023 to 2033

Figure 43: North America Market Value (US$ Million) Analysis by Enterprise Size, 2018 to 2033

Figure 44: North America Market Value Share (%) and BPS Analysis by Enterprise Size, 2023 to 2033

Figure 45: North America Market Y-o-Y Growth (%) Projections by Enterprise Size, 2023 to 2033

Figure 46: North America Market Attractiveness by Solutions, 2023 to 2033

Figure 47: North America Market Attractiveness by Application, 2023 to 2033

Figure 48: North America Market Attractiveness by Deployment Type , 2023 to 2033

Figure 49: North America Market Attractiveness by Enterprise Size, 2023 to 2033

Figure 50: North America Market Attractiveness by Country, 2023 to 2033

Figure 51: Latin America Market Value (US$ Million) by Solutions, 2023 to 2033

Figure 52: Latin America Market Value (US$ Million) by Application, 2023 to 2033

Figure 53: Latin America Market Value (US$ Million) by Deployment Type , 2023 to 2033

Figure 54: Latin America Market Value (US$ Million) by Enterprise Size, 2023 to 2033

Figure 55: Latin America Market Value (US$ Million) by Country, 2023 to 2033

Figure 56: Latin America Market Value (US$ Million) Analysis by Country, 2018 to 2033

Figure 57: Latin America Market Value Share (%) and BPS Analysis by Country, 2023 to 2033

Figure 58: Latin America Market Y-o-Y Growth (%) Projections by Country, 2023 to 2033

Figure 59: Latin America Market Value (US$ Million) Analysis by Solutions, 2018 to 2033

Figure 60: Latin America Market Value Share (%) and BPS Analysis by Solutions, 2023 to 2033

Figure 61: Latin America Market Y-o-Y Growth (%) Projections by Solutions, 2023 to 2033

Figure 62: Latin America Market Value (US$ Million) Analysis by Application, 2018 to 2033

Figure 63: Latin America Market Value Share (%) and BPS Analysis by Application, 2023 to 2033

Figure 64: Latin America Market Y-o-Y Growth (%) Projections by Application, 2023 to 2033

Figure 65: Latin America Market Value (US$ Million) Analysis by Deployment Type , 2018 to 2033

Figure 66: Latin America Market Value Share (%) and BPS Analysis by Deployment Type , 2023 to 2033

Figure 67: Latin America Market Y-o-Y Growth (%) Projections by Deployment Type , 2023 to 2033

Figure 68: Latin America Market Value (US$ Million) Analysis by Enterprise Size, 2018 to 2033

Figure 69: Latin America Market Value Share (%) and BPS Analysis by Enterprise Size, 2023 to 2033

Figure 70: Latin America Market Y-o-Y Growth (%) Projections by Enterprise Size, 2023 to 2033

Figure 71: Latin America Market Attractiveness by Solutions, 2023 to 2033

Figure 72: Latin America Market Attractiveness by Application, 2023 to 2033

Figure 73: Latin America Market Attractiveness by Deployment Type , 2023 to 2033

Figure 74: Latin America Market Attractiveness by Enterprise Size, 2023 to 2033

Figure 75: Latin America Market Attractiveness by Country, 2023 to 2033

Figure 76: Europe Market Value (US$ Million) by Solutions, 2023 to 2033

Figure 77: Europe Market Value (US$ Million) by Application, 2023 to 2033

Figure 78: Europe Market Value (US$ Million) by Deployment Type , 2023 to 2033

Figure 79: Europe Market Value (US$ Million) by Enterprise Size, 2023 to 2033

Figure 80: Europe Market Value (US$ Million) by Country, 2023 to 2033

Figure 81: Europe Market Value (US$ Million) Analysis by Country, 2018 to 2033

Figure 82: Europe Market Value Share (%) and BPS Analysis by Country, 2023 to 2033

Figure 83: Europe Market Y-o-Y Growth (%) Projections by Country, 2023 to 2033

Figure 84: Europe Market Value (US$ Million) Analysis by Solutions, 2018 to 2033

Figure 85: Europe Market Value Share (%) and BPS Analysis by Solutions, 2023 to 2033

Figure 86: Europe Market Y-o-Y Growth (%) Projections by Solutions, 2023 to 2033

Figure 87: Europe Market Value (US$ Million) Analysis by Application, 2018 to 2033

Figure 88: Europe Market Value Share (%) and BPS Analysis by Application, 2023 to 2033

Figure 89: Europe Market Y-o-Y Growth (%) Projections by Application, 2023 to 2033

Figure 90: Europe Market Value (US$ Million) Analysis by Deployment Type , 2018 to 2033

Figure 91: Europe Market Value Share (%) and BPS Analysis by Deployment Type , 2023 to 2033

Figure 92: Europe Market Y-o-Y Growth (%) Projections by Deployment Type , 2023 to 2033

Figure 93: Europe Market Value (US$ Million) Analysis by Enterprise Size, 2018 to 2033

Figure 94: Europe Market Value Share (%) and BPS Analysis by Enterprise Size, 2023 to 2033

Figure 95: Europe Market Y-o-Y Growth (%) Projections by Enterprise Size, 2023 to 2033

Figure 96: Europe Market Attractiveness by Solutions, 2023 to 2033

Figure 97: Europe Market Attractiveness by Application, 2023 to 2033

Figure 98: Europe Market Attractiveness by Deployment Type , 2023 to 2033

Figure 99: Europe Market Attractiveness by Enterprise Size, 2023 to 2033

Figure 100: Europe Market Attractiveness by Country, 2023 to 2033

Figure 101: South Asia Market Value (US$ Million) by Solutions, 2023 to 2033

Figure 102: South Asia Market Value (US$ Million) by Application, 2023 to 2033

Figure 103: South Asia Market Value (US$ Million) by Deployment Type , 2023 to 2033

Figure 104: South Asia Market Value (US$ Million) by Enterprise Size, 2023 to 2033

Figure 105: South Asia Market Value (US$ Million) by Country, 2023 to 2033

Figure 106: South Asia Market Value (US$ Million) Analysis by Country, 2018 to 2033

Figure 107: South Asia Market Value Share (%) and BPS Analysis by Country, 2023 to 2033

Figure 108: South Asia Market Y-o-Y Growth (%) Projections by Country, 2023 to 2033

Figure 109: South Asia Market Value (US$ Million) Analysis by Solutions, 2018 to 2033

Figure 110: South Asia Market Value Share (%) and BPS Analysis by Solutions, 2023 to 2033

Figure 111: South Asia Market Y-o-Y Growth (%) Projections by Solutions, 2023 to 2033

Figure 112: South Asia Market Value (US$ Million) Analysis by Application, 2018 to 2033

Figure 113: South Asia Market Value Share (%) and BPS Analysis by Application, 2023 to 2033

Figure 114: South Asia Market Y-o-Y Growth (%) Projections by Application, 2023 to 2033

Figure 115: South Asia Market Value (US$ Million) Analysis by Deployment Type , 2018 to 2033

Figure 116: South Asia Market Value Share (%) and BPS Analysis by Deployment Type , 2023 to 2033

Figure 117: South Asia Market Y-o-Y Growth (%) Projections by Deployment Type , 2023 to 2033

Figure 118: South Asia Market Value (US$ Million) Analysis by Enterprise Size, 2018 to 2033

Figure 119: South Asia Market Value Share (%) and BPS Analysis by Enterprise Size, 2023 to 2033

Figure 120: South Asia Market Y-o-Y Growth (%) Projections by Enterprise Size, 2023 to 2033

Figure 121: South Asia Market Attractiveness by Solutions, 2023 to 2033

Figure 122: South Asia Market Attractiveness by Application, 2023 to 2033

Figure 123: South Asia Market Attractiveness by Deployment Type , 2023 to 2033

Figure 124: South Asia Market Attractiveness by Enterprise Size, 2023 to 2033

Figure 125: South Asia Market Attractiveness by Country, 2023 to 2033

Figure 126: East Asia Market Value (US$ Million) by Solutions, 2023 to 2033

Figure 127: East Asia Market Value (US$ Million) by Application, 2023 to 2033

Figure 128: East Asia Market Value (US$ Million) by Deployment Type , 2023 to 2033

Figure 129: East Asia Market Value (US$ Million) by Enterprise Size, 2023 to 2033

Figure 130: East Asia Market Value (US$ Million) by Country, 2023 to 2033

Figure 131: East Asia Market Value (US$ Million) Analysis by Country, 2018 to 2033

Figure 132: East Asia Market Value Share (%) and BPS Analysis by Country, 2023 to 2033

Figure 133: East Asia Market Y-o-Y Growth (%) Projections by Country, 2023 to 2033

Figure 134: East Asia Market Value (US$ Million) Analysis by Solutions, 2018 to 2033

Figure 135: East Asia Market Value Share (%) and BPS Analysis by Solutions, 2023 to 2033

Figure 136: East Asia Market Y-o-Y Growth (%) Projections by Solutions, 2023 to 2033

Figure 137: East Asia Market Value (US$ Million) Analysis by Application, 2018 to 2033

Figure 138: East Asia Market Value Share (%) and BPS Analysis by Application, 2023 to 2033

Figure 139: East Asia Market Y-o-Y Growth (%) Projections by Application, 2023 to 2033

Figure 140: East Asia Market Value (US$ Million) Analysis by Deployment Type , 2018 to 2033

Figure 141: East Asia Market Value Share (%) and BPS Analysis by Deployment Type , 2023 to 2033

Figure 142: East Asia Market Y-o-Y Growth (%) Projections by Deployment Type , 2023 to 2033

Figure 143: East Asia Market Value (US$ Million) Analysis by Enterprise Size, 2018 to 2033

Figure 144: East Asia Market Value Share (%) and BPS Analysis by Enterprise Size, 2023 to 2033

Figure 145: East Asia Market Y-o-Y Growth (%) Projections by Enterprise Size, 2023 to 2033

Figure 146: East Asia Market Attractiveness by Solutions, 2023 to 2033

Figure 147: East Asia Market Attractiveness by Application, 2023 to 2033

Figure 148: East Asia Market Attractiveness by Deployment Type , 2023 to 2033

Figure 149: East Asia Market Attractiveness by Enterprise Size, 2023 to 2033

Figure 150: East Asia Market Attractiveness by Country, 2023 to 2033

Figure 151: Oceania Market Value (US$ Million) by Solutions, 2023 to 2033

Figure 152: Oceania Market Value (US$ Million) by Application, 2023 to 2033

Figure 153: Oceania Market Value (US$ Million) by Deployment Type , 2023 to 2033

Figure 154: Oceania Market Value (US$ Million) by Enterprise Size, 2023 to 2033

Figure 155: Oceania Market Value (US$ Million) by Country, 2023 to 2033

Figure 156: Oceania Market Value (US$ Million) Analysis by Country, 2018 to 2033

Figure 157: Oceania Market Value Share (%) and BPS Analysis by Country, 2023 to 2033

Figure 158: Oceania Market Y-o-Y Growth (%) Projections by Country, 2023 to 2033

Figure 159: Oceania Market Value (US$ Million) Analysis by Solutions, 2018 to 2033

Figure 160: Oceania Market Value Share (%) and BPS Analysis by Solutions, 2023 to 2033

Figure 161: Oceania Market Y-o-Y Growth (%) Projections by Solutions, 2023 to 2033

Figure 162: Oceania Market Value (US$ Million) Analysis by Application, 2018 to 2033

Figure 163: Oceania Market Value Share (%) and BPS Analysis by Application, 2023 to 2033

Figure 164: Oceania Market Y-o-Y Growth (%) Projections by Application, 2023 to 2033

Figure 165: Oceania Market Value (US$ Million) Analysis by Deployment Type , 2018 to 2033

Figure 166: Oceania Market Value Share (%) and BPS Analysis by Deployment Type , 2023 to 2033

Figure 167: Oceania Market Y-o-Y Growth (%) Projections by Deployment Type , 2023 to 2033

Figure 168: Oceania Market Value (US$ Million) Analysis by Enterprise Size, 2018 to 2033

Figure 169: Oceania Market Value Share (%) and BPS Analysis by Enterprise Size, 2023 to 2033

Figure 170: Oceania Market Y-o-Y Growth (%) Projections by Enterprise Size, 2023 to 2033

Figure 171: Oceania Market Attractiveness by Solutions, 2023 to 2033

Figure 172: Oceania Market Attractiveness by Application, 2023 to 2033

Figure 173: Oceania Market Attractiveness by Deployment Type , 2023 to 2033

Figure 174: Oceania Market Attractiveness by Enterprise Size, 2023 to 2033

Figure 175: Oceania Market Attractiveness by Country, 2023 to 2033

Figure 176: MEA Market Value (US$ Million) by Solutions, 2023 to 2033

Figure 177: MEA Market Value (US$ Million) by Application, 2023 to 2033

Figure 178: MEA Market Value (US$ Million) by Deployment Type , 2023 to 2033

Figure 179: MEA Market Value (US$ Million) by Enterprise Size, 2023 to 2033

Figure 180: MEA Market Value (US$ Million) by Country, 2023 to 2033

Figure 181: MEA Market Value (US$ Million) Analysis by Country, 2018 to 2033

Figure 182: MEA Market Value Share (%) and BPS Analysis by Country, 2023 to 2033

Figure 183: MEA Market Y-o-Y Growth (%) Projections by Country, 2023 to 2033

Figure 184: MEA Market Value (US$ Million) Analysis by Solutions, 2018 to 2033

Figure 185: MEA Market Value Share (%) and BPS Analysis by Solutions, 2023 to 2033

Figure 186: MEA Market Y-o-Y Growth (%) Projections by Solutions, 2023 to 2033

Figure 187: MEA Market Value (US$ Million) Analysis by Application, 2018 to 2033

Figure 188: MEA Market Value Share (%) and BPS Analysis by Application, 2023 to 2033

Figure 189: MEA Market Y-o-Y Growth (%) Projections by Application, 2023 to 2033

Figure 190: MEA Market Value (US$ Million) Analysis by Deployment Type , 2018 to 2033

Figure 191: MEA Market Value Share (%) and BPS Analysis by Deployment Type , 2023 to 2033

Figure 192: MEA Market Y-o-Y Growth (%) Projections by Deployment Type , 2023 to 2033

Figure 193: MEA Market Value (US$ Million) Analysis by Enterprise Size, 2018 to 2033

Figure 194: MEA Market Value Share (%) and BPS Analysis by Enterprise Size, 2023 to 2033

Figure 195: MEA Market Y-o-Y Growth (%) Projections by Enterprise Size, 2023 to 2033

Figure 196: MEA Market Attractiveness by Solutions, 2023 to 2033

Figure 197: MEA Market Attractiveness by Application, 2023 to 2033

Figure 198: MEA Market Attractiveness by Deployment Type , 2023 to 2033

Figure 199: MEA Market Attractiveness by Enterprise Size, 2023 to 2033

Figure 200: MEA Market Attractiveness by Country, 2023 to 2033

Recommendations

Technology

Wind Turbine Automation Market

Published : October 2022

Technology

Recruiting Automation Software Market

Published : July 2022

Explore Technology Insights

View Reports

Professional Services Automation Software Market