Methodology

PROFIBUS Display Market Forecast and Outlook 2025 to 2035

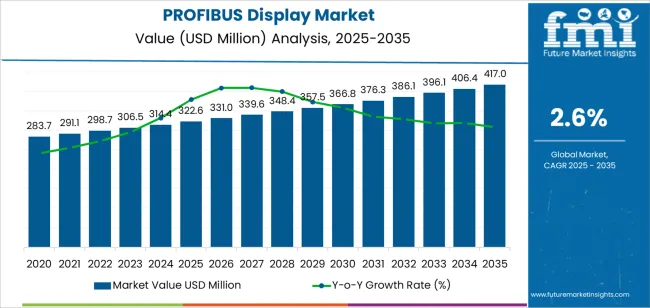
The PROFIBUS display market is forecast to grow from USD 322.6 million in 2025 to USD 417 million by 2035, reflecting a CAGR of 4.3%. Demand growth is primarily driven by the increasing adoption of industrial automation and the rising demand for advanced display solutions in manufacturing and process control environments. PROFIBUS, a widely used communication protocol for automation systems, relies on reliable and efficient display systems for real-time monitoring and control of industrial processes. As industries focus on enhancing operational efficiency, productivity, and safety, the need for high-quality, real-time displays integrated with PROFIBUS systems will continue to grow.

Technological advancements in display technologies and human-machine interfaces (HMIs), as well as the increasing shift towards smart factories, will further support market growth. The development of touchscreen displays, graphical user interfaces (GUIs), and wireless communication solutions will enhance the functionality and flexibility of PROFIBUS display systems. As the global manufacturing sector continues to digitize and automate, the demand for integrated display systems that offer seamless communication with PROFIBUS networks will drive the expansion of the market. Additionally, the increasing adoption of Industry 4.0 and smart manufacturing solutions will further fuel demand for reliable display systems in automated environments.
Quick Stats of the PROFIBUS Display Market

  • PROFIBUS Display Market Value (2025): USD 322.6 million
  • PROFIBUS Display Market Forecast Value (2035): USD 417 million
  • PROFIBUS Display Market Forecast CAGR (2025 to 2035): 4.3%
  • PROFIBUS Display Market Leading Segment: Digital Tube Display (55%)
  • PROFIBUS Display Market Key Growth Regions: China, India, Germany, Brazil, USA, UK, Japan
  • PROFIBUS Display Market Top Players: Siemens, Softing Industrial Automation, Shenzhen Jietong Technology, BAUER KOMPRESSOREN, BEKA, DITEL, microSYST Systemelektronik, MTL INSTRUMENT, Orbit Merret, SENSY S.A., Shanghai Nanhua Electronics Company, Siebert Industrieelektronik, UTICOR Automation, VISUAL ELECTRONIC, WIBOND Informationssysteme GmbH

Profibus Display Market Market Value Analysis

PROFIBUS Display Market Year-over-Year Forecast 2025 to 2035

From 2025 to 2030, the market is expected to grow from USD 322.6 million to USD 366.8 million, an increase of USD 44.2 million. This growth will be driven by the continued digitalization of industries and the increased reliance on automated systems. As smart manufacturing and Industry 4.0 initiatives gain momentum, the need for reliable, real-time data visualization and control systems will continue to rise. The integration of PROFIBUS display systems with advanced HMIs and IoT devices will further accelerate market growth.

Between 2030 and 2035, the market will expand from USD 366.8 million to USD 417 million, adding USD 50.2 million in value. This phase will see an increase in the adoption of wireless and cloud-based display solutions as industries continue to evolve toward connected and intelligent systems. The push for greater operational efficiency and real-time monitoring will be key drivers in this period, ensuring sustained growth in the PROFIBUS display market through 2035.

PROFIBUS Display Market Key Takeaways

Metric Value
Market Value (2025) USD 322.6 million
Market Forecast Value (2035) USD 417 million
Forecast CAGR (2025 to 2035) 4.3%

What is driving the growth of the PROFIBUS display market?

The PROFIBUS display market is driven by the growing need for automation and real-time monitoring across industrial sectors such as factory automation, energy management, and smart buildings. As industries increasingly adopt Industrial Internet of Things (IIoT) and smart systems, the demand for visual displays that integrate seamlessly with industrial networks is expanding. PROFIBUS displays allow for efficient communication between devices and real-time data visualization, making them essential for monitoring machine performance, energy usage, and process control.

Additionally, industries are focusing on enhancing operational efficiency, and sustainability, leading to widespread adoption of PROFIBUS display solutions. The factory automation sector, in particular, is a major driver, with digital tube displays playing a critical role in process visualization. The demand for these displays is especially prominent in Asia-Pacific and Europe, where industrial automation and smart building technologies are growing rapidly. As IIoT continues to advance, the PROFIBUS display market is poised for steady growth, with increasing demand across various industrial applications, including warehousing and logistics.

What are the key segments of the PROFIBUS display market?

The PROFIBUS display market is segmented into machine type and application, with each segment reflecting unique demands across global industries. By machine type, the market is divided into digital tube displays and dot matrix bar displays, with digital tube displays leading the market share due to their superior visibility and clarity in industrial environments. By application, the market includes factory automation, energy management, smart buildings, and warehousing and logistics, with factory automation leading the market due to the increasing demand for real-time data visualization in industrial processes. The growth of these segments is seen in regions such as China, Germany, and India, where industrial automation is rapidly expanding.
Why is the digital tube display segment leading the PROFIBUS display market?

Profibus Display Market Analysis By Classification

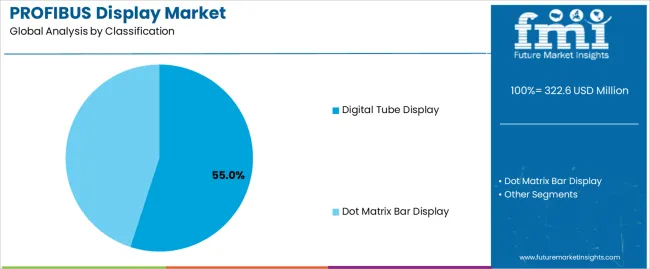
The digital tube display segment leads the PROFIBUS display market, commanding around 55% of the market share. This segment's dominance can be attributed to the clarity, brightness, and reliability of digital tube displays in industrial environments. Digital tube displays are particularly popular in sectors like factory automation, energy management, and smart buildings due to their high performance and versatility. In factory automation, these displays are used for monitoring critical processes and providing real-time feedback on machine performance, making them ideal for automated systems that require constant, reliable data visualization.

These displays also offer high energy efficiency, a key factor as industries seek solutions that reduce their operational costs and environmental footprint. In addition, digital tube displays are preferred for their durability under extreme conditions such as high temperatures, vibrations, and exposure to industrial pollutants, which is crucial for operations in manufacturing and industrial plants. As automation and industrial IoT continue to grow, the demand for digital tube displays will remain strong, maintaining their leadership in the PROFIBUS display market for years to come.
Why is the factory automation segment leading the application market?

Profibus Display Market Analysis By Application

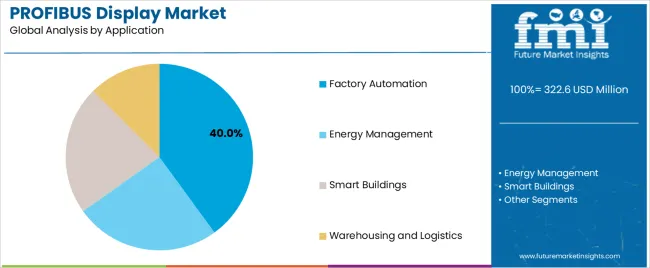
The factory automation segment is the leading application in the PROFIBUS display market, accounting for 40% of the total market share. This dominance is driven by the increasing demand for advanced control systems and real-time data monitoring in manufacturing environments. As industries around the world continue to adopt automation technologies to enhance operational efficiency, the demand for visual display systems that can provide immediate, accurate feedback on industrial processes is growing rapidly. PROFIBUS displays are integral to factory automation because they offer a reliable, easily readable interface for monitoring complex industrial systems, including production lines, machine health, and energy consumption.

These displays help operators detect issues early, improving uptime and preventing costly production delays. Additionally, digital tube displays are particularly valued in factory automation applications because of their brightness, clarity, and long lifespan, which are necessary for the demanding conditions of industrial settings. With the increasing trend of smart manufacturing and the adoption of Industrial Internet of Things (IIoT), the factory automation segment will continue to be the dominant driver of the PROFIBUS display market as industries invest in more automated systems that rely on efficient and reliable data visualization.

What are the drivers, restraints, and key trends of the PROFIBUS display market?

The PROFIBUS display market is driven by increasing demand for industrial automation, real-time data visualization, and smart manufacturing solutions. The widespread adoption of PROFIBUS displays in sectors like factory automation, energy management, and smart buildings is further fueled by the need for energy-efficient systems and cost-effective packaging. As industries embrace IIoT technologies and automation, PROFIBUS displays are becoming an essential component of modern industrial networks, providing businesses with enhanced process monitoring and data-driven insights.

What are the key drivers of the PROFIBUS display market?

The primary drivers of the PROFIBUS display market include the rapid adoption of automation and real-time monitoring systems in industrial settings. The need for advanced control systems in factory automation and energy management is pushing the demand for PROFIBUS display solutions, as they provide clear, immediate feedback and data visualization. Additionally, the growing trend toward smart buildings and the increasing implementation of IoT devices in industrial systems are contributing to the market’s expansion. Furthermore, the demand for eco-friendly and sustainable solutions that improve operational efficiency is driving the adoption of energy-efficient displays in industrial processes.

What are the key restraints in the PROFIBUS display market?

Despite the growth prospects, the PROFIBUS display market faces several restraints. The high initial cost of PROFIBUS display systems can deter smaller manufacturers from adopting these solutions. Additionally, the integration complexity with existing industrial systems and the need for skilled labor to operate and maintain these systems can be barriers to entry, particularly in developing markets. Furthermore, while digital tube displays are widely used, dot matrix bar displays still face competition from alternative visual display technologies, potentially limiting their growth within specific industries.

What are the key trends in the PROFIBUS display market?

Key trends in the PROFIBUS display market include the growing integration of IIoT and smart technologies into industrial display systems. As industries become more connected and data-driven, the need for real-time data visualization in automated control systems continues to grow. Another trend is the increasing adoption of eco-friendly and energy-efficient display technologies, with a focus on sustainability. Additionally, there is a rise in demand for customizable and flexible displays, particularly in smart buildings and warehouse management, where visual systems must adapt to varying environmental conditions and business needs.
What Are the Key Growth Trends in the PROFIBUS Display Market Across Different Countries?

Profibus Display Market Cagr Analysis By Country

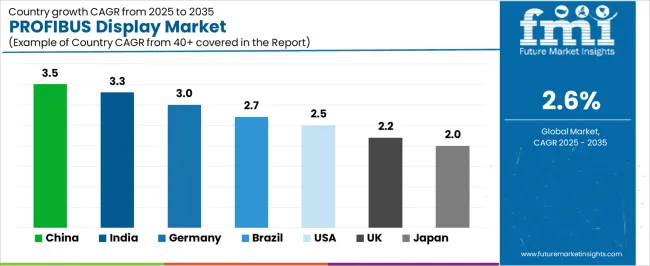
The PROFIBUS display market is experiencing varied growth across countries, with each nation showing distinct trends based on its industrial automation needs, manufacturing sector development, and technological advancements. Understanding the compound annual growth rates (CAGR) for the PROFIBUS display market in different countries helps identify key markets and provides valuable insights for investors, manufacturers, and stakeholders. This analysis highlights how each country's industrial base, commitment to automation, and adoption of smart technologies influence the market for PROFIBUS displays. Countries like China and India are experiencing significant growth due to their expanding industrial sectors, while developed markets like the USA and Germany show steady growth fueled by innovation and digital transformation.

Country CAGR (%)
China 3.5%
India 3.3%
Germany 3%
Brazil 2.7%
USA 2.5%
United Kingdom 2.2%
Japan 2%

What Are the Key Growth Drivers in the PROFIBUS Display Market in China?

China is leading the PROFIBUS display market with a CAGR of 3.5%. The country’s rapid industrialization and significant investments in automation are the primary drivers of this growth. China’s manufacturing sectors, such as automotive, electronics, and chemicals, are increasingly adopting PROFIBUS systems to streamline communication within automated environments. As the country moves towards Industry 4.0, the demand for efficient, high-speed communication systems, like PROFIBUS, has risen substantially. Additionally, the increasing adoption of smart factory technologies and the Internet of Things (IoT) in Chinese industries are fueling this trend. With robust government support for industrial modernization and sustainable growth, China is expected to maintain its dominant position in the global PROFIBUS display market, driving consistent demand for automation solutions and related technologies.

How Is India’s PROFIBUS Display Market Evolving?

India’s PROFIBUS display market is growing at a CAGR of 3.3%, reflecting the country’s ongoing industrial growth and increased adoption of automation technologies. India’s manufacturing sector, especially in industries such as pharmaceuticals, automotive, and food processing, is rapidly modernizing and adopting smart factory solutions, creating significant demand for PROFIBUS systems. The country’s focus on infrastructure development and digital transformation is accelerating the demand for communication technologies that can facilitate seamless data exchange across automated systems. With the increasing need for efficiency, cost reduction, and real-time data analytics, industries in India are looking toward advanced communication protocols like PROFIBUS to drive productivity. The market is expected to continue expanding as India prioritizes automation and innovation across its industrial sectors.
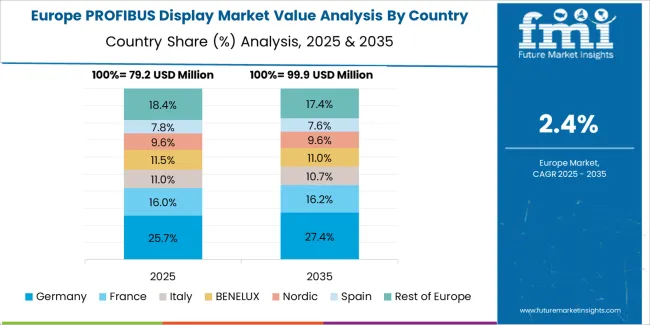
What Is the Market Outlook for PROFIBUS Displays in Germany?

Profibus Display Market Europe Country Market Share Analysis, 2025 & 2035

Germany’s PROFIBUS display market is expected to grow at a CAGR of 3%, supported by its strong industrial base and commitment to automation. As one of the world’s leading manufacturing hubs, Germany’s sectors like automotive, machinery, and chemicals require robust communication systems to enable seamless data exchange in highly automated environments. The country’s push towards digitalization, particularly within Industry 4.0 initiatives, is a significant driver of demand for PROFIBUS systems. Moreover, Germany’s dedication to technological innovation and sustainable manufacturing processes ensures that industries continue to invest in advanced automation solutions. Despite a relatively lower growth rate compared to emerging economies, Germany’s sophisticated industrial landscape, strong R&D focus, and leadership in automation will continue to support steady demand for PROFIBUS displays in the long term.

What Are the Key Factors Impacting the PROFIBUS Display Market in Brazil?

Brazil’s PROFIBUS display market is projected to grow at a CAGR of 2.7%. The country’s growing industrial automation needs, particularly in manufacturing and energy sectors, are driving the demand for PROFIBUS systems. As Brazil continues to modernize its industrial base, companies are increasingly seeking efficient and cost-effective automation solutions to enhance productivity and operational efficiency. The rise of smart factories and IoT technologies in Brazil is accelerating the adoption of communication protocols like PROFIBUS, which enable real-time data exchange between automated systems. Despite economic challenges, Brazil’s focus on infrastructure development and industrial growth presents a promising opportunity for automation technologies, including PROFIBUS displays, to play a crucial role in supporting the country’s industrial evolution.
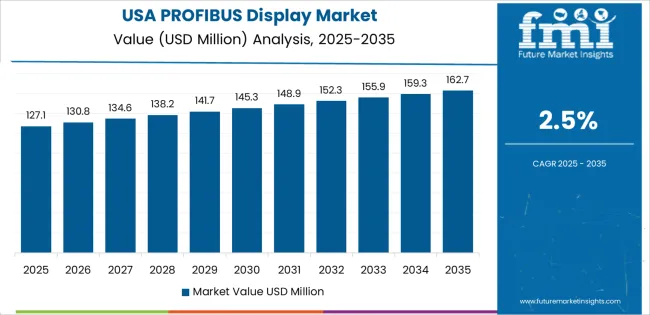
What Is the Growth Potential of the PROFIBUS Display Market in the USA?

Profibus Display Market Country Value Analysis

The United States has a projected CAGR of 2.5% for the PROFIBUS display market. As one of the leaders in industrial automation, the USA is home to a large and diverse manufacturing sector, including automotive, aerospace, and energy, which relies heavily on automation technologies. The demand for PROFIBUS displays in the USA is driven by the need for efficient and reliable communication systems that enable seamless integration of automated systems. The country’s emphasis on smart manufacturing, digital transformation, and Industry 4.0 initiatives is fostering the growth of communication technologies like PROFIBUS. Though the USA market may not grow as rapidly as some emerging economies, its established infrastructure and continued focus on innovation will drive steady demand for PROFIBUS systems, particularly in high-tech manufacturing sectors.

What Is the Bag Feed Seal Pouch Packaging Machine Market Outlook in the UK?

In the United Kingdom, the PROFIBUS display market is growing at a CAGR of 2.2%. The UK’s industrial base, particularly in manufacturing and energy, continues to adopt automation solutions, driving demand for advanced communication systems. Despite the challenges posed by Brexit, the UK’s commitment to digital transformation and smart manufacturing has spurred interest in PROFIBUS displays, which enable efficient data exchange in automated systems. The demand for PROFIBUS systems is also supported by the country’s ongoing push toward sustainability and energy-efficient manufacturing. As the UK works to modernize its industries and remain competitive on the global stage, the PROFIBUS display market is expected to experience steady, albeit moderate, growth in the coming years.
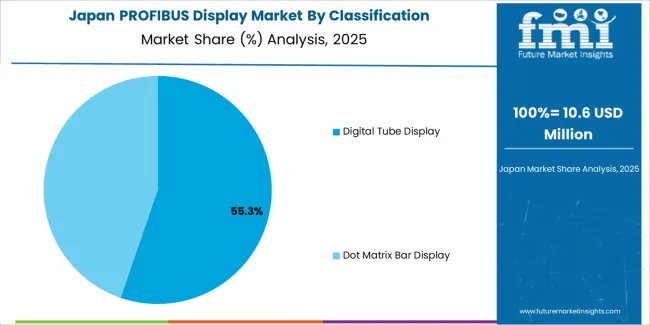
How Is Japan’s PROFIBUS Display Market Evolving?

Profibus Display Market Japan Market Share Analysis By Classification

Japan’s PROFIBUS display market is projected to grow at a slower pace with a CAGR of 2%. Japan’s advanced manufacturing sector, particularly in robotics, automotive, and electronics, continues to drive demand for automation technologies. While Japan is known for its sophisticated industrial systems, the growth rate for PROFIBUS displays is relatively slow due to the country’s preference for localized automation technologies and communication protocols. Nonetheless, Japan’s emphasis on automation, IoT integration, and digital transformation will continue to support steady demand for PROFIBUS systems. As industries in Japan focus on increasing efficiency and reducing operational costs, the demand for high-performance communication systems like PROFIBUS will remain a key element of the country's industrial strategy.
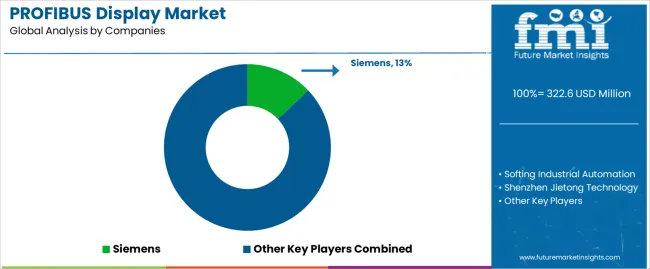
What is the competitive landscape of the PROFIBUS display market?

Profibus Display Market Analysis By Company

The PROFIBUS display market is competitive, with several global leaders vying for market share. Key players such as Siemens, which holds around 13% of the market, dominate the industry by offering high-quality, customizable PROFIBUS displays tailored for industries like factory automation, energy management, and smart buildings. Siemens has a strong foothold in the market due to its robust product portfolio, cutting-edge technology, and its global presence. Other companies such as Softing Industrial Automation, Shenzhen Jietong Technology, and BAUER KOMPRESSOREN also play significant roles in this market, focusing on innovation and regional expansion. These companies leverage their extensive research and development capabilities to create cost-effective, high-performance solutions that cater to the increasing demand for automated control systems.

Smaller regional players, like DITEL, microSYST Systemelectronic, and MTL INSTRUMENT, also contribute to the market’s growth by focusing on specific applications and providing specialized solutions to niche sectors. These companies often prioritize affordability, customization, and local service support, allowing them to cater to both emerging markets and highly specialized industries. The market is seeing increased mergers, partnerships, and collaborations as companies look to enhance their market share through technological advancements and regional expansion. As industries worldwide continue to embrace digital transformation and smart systems, the competitive landscape will evolve, driven by innovation and differentiation in PROFIBUS display solutions.

Key Players of the PROFIBUS Display Market

  • Siemens
  • Softing Industrial Automation
  • Shenzhen Jietong Technology
  • BAUER KOMPRESSOREN
  • BEKA
  • DITEL
  • microSYST Systemelectronic
  • MTL INSTRUMENT
  • Orbit Merret
  • SENSY S.A.
  • Shanghai Nanhua Electronics Company
  • Siebert Industrieelektronik
  • UTICOR Automation
  • VISUAL ELECTRONIC
  • WIBOND Informationssysteme GmbH

Scope of the Report

Items Details
Quantitative Units USD Million
Regions Covered China, India, Germany, Brazil, USA, UK, Japan
Classification Digital Tube Display, Dot Matrix Bar Display
Application Factory Automation, Energy Management, Smart Buildings, Warehousing and Logistics
Key Companies Profiled Siemens, Softing Industrial Automation, Shenzhen Jietong Technology, BAUER KOMPRESSOREN, BEKA, DITEL, microSYST Systemelectronic, MTL INSTRUMENT, Orbit Merret, SENSY S.A., Shanghai Nanhua Electronics Company, Siebert Industrieelektronik, UTICOR Automation, VISUAL ELECTRONIC, WIBOND Informationssysteme GmbH
Additional Attributes The market analysis includes dollar sales by classification and application categories. It also covers regional adoption trends across major markets like China, India, Germany, and the USA. The competitive landscape features key manufacturers in the PROFIBUS display industry, focusing on innovations in digital tube and dot matrix bar displays. Trends in factory automation, energy management, and smart buildings are explored, with a focus on advancements in display technologies and integration with industrial communication systems.

Key Segments of the PROFIBUS Display Market

Classification

  • Digital Tube Display
  • Dot Matrix Bar Display

Application

  • Factory Automation
  • Energy Management
  • Smart Buildings
  • Warehousing and Logistics

Region

  • Asia Pacific
    • China
    • Japan
    • South Korea
    • India
    • Australia & New Zealand
    • ASEAN
    • Rest of Asia Pacific
  • Europe
    • Germany
    • United Kingdom
    • France
    • Italy
    • Spain
    • Nordic
    • BENELUX
    • Rest of Europe
  • North America
    • United States
    • Canada
    • Mexico
  • Latin America
    • Brazil
    • Chile
    • Rest of Latin America
  • Middle East & Africa
    • Kingdom of Saudi Arabia
    • Other GCC Countries
    • Turkey
    • South Africa
    • Other African Union
    • Rest of Middle East & Africa

Frequently Asked Questions

How big is the profibus display market in 2025?

The global profibus display market is estimated to be valued at USD 322.6 million in 2025.

What will be the size of profibus display market in 2035?

The market size for the profibus display market is projected to reach USD 417.0 million by 2035.

How much will be the profibus display market growth between 2025 and 2035?

The profibus display market is expected to grow at a 2.6% CAGR between 2025 and 2035.

What are the key product types in the profibus display market?

The key product types in profibus display market are digital tube display and dot matrix bar display.

Which application segment to contribute significant share in the profibus display market in 2025?

In terms of application, factory automation segment to command 40.0% share in the profibus display market in 2025.

Table of Content

  1. Executive Summary
    • Global Market Outlook
    • Demand to side Trends
    • Supply to side Trends
    • Technology Roadmap Analysis
    • Analysis and Recommendations
  2. Market Overview
    • Market Coverage / Taxonomy
    • Market Definition / Scope / Limitations
  3. Market Background
    • Market Dynamics
      • Drivers
      • Restraints
      • Opportunity
      • Trends
    • Scenario Forecast
      • Demand in Optimistic Scenario
      • Demand in Likely Scenario
      • Demand in Conservative Scenario
    • Opportunity Map Analysis
    • Product Life Cycle Analysis
    • Supply Chain Analysis
    • Investment Feasibility Matrix
    • Value Chain Analysis
    • PESTLE and Porter’s Analysis
    • Regulatory Landscape
    • Regional Parent Market Outlook
    • Production and Consumption Statistics
    • Import and Export Statistics
  4. Global Market Analysis 2020 to 2024 and Forecast, 2025 to 2035
    • Historical Market Size Value (USD Million) Analysis, 2020 to 2024
    • Current and Future Market Size Value (USD Million) Projections, 2025 to 2035
      • Y to o to Y Growth Trend Analysis
      • Absolute $ Opportunity Analysis
  5. Global Market Pricing Analysis 2020 to 2024 and Forecast 2025 to 2035
  6. Global Market Analysis 2020 to 2024 and Forecast 2025 to 2035, By Classification
    • Introduction / Key Findings
    • Historical Market Size Value (USD Million) Analysis By Classification , 2020 to 2024
    • Current and Future Market Size Value (USD Million) Analysis and Forecast By Classification , 2025 to 2035
      • Digital Tube Display
      • Dot Matrix Bar Display
    • Y to o to Y Growth Trend Analysis By Classification , 2020 to 2024
    • Absolute $ Opportunity Analysis By Classification , 2025 to 2035
  7. Global Market Analysis 2020 to 2024 and Forecast 2025 to 2035, By Application
    • Introduction / Key Findings
    • Historical Market Size Value (USD Million) Analysis By Application, 2020 to 2024
    • Current and Future Market Size Value (USD Million) Analysis and Forecast By Application, 2025 to 2035
      • Factory Automation
      • Energy Management
      • Smart Buildings
      • Warehousing and Logistics
    • Y to o to Y Growth Trend Analysis By Application, 2020 to 2024
    • Absolute $ Opportunity Analysis By Application, 2025 to 2035
  8. Global Market Analysis 2020 to 2024 and Forecast 2025 to 2035, By Region
    • Introduction
    • Historical Market Size Value (USD Million) Analysis By Region, 2020 to 2024
    • Current Market Size Value (USD Million) Analysis and Forecast By Region, 2025 to 2035
      • North America
      • Latin America
      • Western Europe
      • Eastern Europe
      • East Asia
      • South Asia and Pacific
      • Middle East & Africa
    • Market Attractiveness Analysis By Region
  9. North America Market Analysis 2020 to 2024 and Forecast 2025 to 2035, By Country
    • Historical Market Size Value (USD Million) Trend Analysis By Market Taxonomy, 2020 to 2024
    • Market Size Value (USD Million) Forecast By Market Taxonomy, 2025 to 2035
      • By Country
        • USA
        • Canada
        • Mexico
      • By Classification
      • By Application
    • Market Attractiveness Analysis
      • By Country
      • By Classification
      • By Application
    • Key Takeaways
  10. Latin America Market Analysis 2020 to 2024 and Forecast 2025 to 2035, By Country
    • Historical Market Size Value (USD Million) Trend Analysis By Market Taxonomy, 2020 to 2024
    • Market Size Value (USD Million) Forecast By Market Taxonomy, 2025 to 2035
      • By Country
        • Brazil
        • Chile
        • Rest of Latin America
      • By Classification
      • By Application
    • Market Attractiveness Analysis
      • By Country
      • By Classification
      • By Application
    • Key Takeaways
  11. Western Europe Market Analysis 2020 to 2024 and Forecast 2025 to 2035, By Country
    • Historical Market Size Value (USD Million) Trend Analysis By Market Taxonomy, 2020 to 2024
    • Market Size Value (USD Million) Forecast By Market Taxonomy, 2025 to 2035
      • By Country
        • Germany
        • UK
        • Italy
        • Spain
        • France
        • Nordic
        • BENELUX
        • Rest of Western Europe
      • By Classification
      • By Application
    • Market Attractiveness Analysis
      • By Country
      • By Classification
      • By Application
    • Key Takeaways
  12. Eastern Europe Market Analysis 2020 to 2024 and Forecast 2025 to 2035, By Country
    • Historical Market Size Value (USD Million) Trend Analysis By Market Taxonomy, 2020 to 2024
    • Market Size Value (USD Million) Forecast By Market Taxonomy, 2025 to 2035
      • By Country
        • Russia
        • Poland
        • Hungary
        • Balkan & Baltic
        • Rest of Eastern Europe
      • By Classification
      • By Application
    • Market Attractiveness Analysis
      • By Country
      • By Classification
      • By Application
    • Key Takeaways
  13. East Asia Market Analysis 2020 to 2024 and Forecast 2025 to 2035, By Country
    • Historical Market Size Value (USD Million) Trend Analysis By Market Taxonomy, 2020 to 2024
    • Market Size Value (USD Million) Forecast By Market Taxonomy, 2025 to 2035
      • By Country
        • China
        • Japan
        • South Korea
      • By Classification
      • By Application
    • Market Attractiveness Analysis
      • By Country
      • By Classification
      • By Application
    • Key Takeaways
  14. South Asia and Pacific Market Analysis 2020 to 2024 and Forecast 2025 to 2035, By Country
    • Historical Market Size Value (USD Million) Trend Analysis By Market Taxonomy, 2020 to 2024
    • Market Size Value (USD Million) Forecast By Market Taxonomy, 2025 to 2035
      • By Country
        • India
        • ASEAN
        • Australia & New Zealand
        • Rest of South Asia and Pacific
      • By Classification
      • By Application
    • Market Attractiveness Analysis
      • By Country
      • By Classification
      • By Application
    • Key Takeaways
  15. Middle East & Africa Market Analysis 2020 to 2024 and Forecast 2025 to 2035, By Country
    • Historical Market Size Value (USD Million) Trend Analysis By Market Taxonomy, 2020 to 2024
    • Market Size Value (USD Million) Forecast By Market Taxonomy, 2025 to 2035
      • By Country
        • Kingdom of Saudi Arabia
        • Other GCC Countries
        • Turkiye
        • South Africa
        • Other African Union
        • Rest of Middle East & Africa
      • By Classification
      • By Application
    • Market Attractiveness Analysis
      • By Country
      • By Classification
      • By Application
    • Key Takeaways
  16. Key Countries Market Analysis
    • USA
      • Pricing Analysis
      • Market Share Analysis, 2024
        • By Classification
        • By Application
    • Canada
      • Pricing Analysis
      • Market Share Analysis, 2024
        • By Classification
        • By Application
    • Mexico
      • Pricing Analysis
      • Market Share Analysis, 2024
        • By Classification
        • By Application
    • Brazil
      • Pricing Analysis
      • Market Share Analysis, 2024
        • By Classification
        • By Application
    • Chile
      • Pricing Analysis
      • Market Share Analysis, 2024
        • By Classification
        • By Application
    • Germany
      • Pricing Analysis
      • Market Share Analysis, 2024
        • By Classification
        • By Application
    • UK
      • Pricing Analysis
      • Market Share Analysis, 2024
        • By Classification
        • By Application
    • Italy
      • Pricing Analysis
      • Market Share Analysis, 2024
        • By Classification
        • By Application
    • Spain
      • Pricing Analysis
      • Market Share Analysis, 2024
        • By Classification
        • By Application
    • France
      • Pricing Analysis
      • Market Share Analysis, 2024
        • By Classification
        • By Application
    • India
      • Pricing Analysis
      • Market Share Analysis, 2024
        • By Classification
        • By Application
    • ASEAN
      • Pricing Analysis
      • Market Share Analysis, 2024
        • By Classification
        • By Application
    • Australia & New Zealand
      • Pricing Analysis
      • Market Share Analysis, 2024
        • By Classification
        • By Application
    • China
      • Pricing Analysis
      • Market Share Analysis, 2024
        • By Classification
        • By Application
    • Japan
      • Pricing Analysis
      • Market Share Analysis, 2024
        • By Classification
        • By Application
    • South Korea
      • Pricing Analysis
      • Market Share Analysis, 2024
        • By Classification
        • By Application
    • Russia
      • Pricing Analysis
      • Market Share Analysis, 2024
        • By Classification
        • By Application
    • Poland
      • Pricing Analysis
      • Market Share Analysis, 2024
        • By Classification
        • By Application
    • Hungary
      • Pricing Analysis
      • Market Share Analysis, 2024
        • By Classification
        • By Application
    • Kingdom of Saudi Arabia
      • Pricing Analysis
      • Market Share Analysis, 2024
        • By Classification
        • By Application
    • Turkiye
      • Pricing Analysis
      • Market Share Analysis, 2024
        • By Classification
        • By Application
    • South Africa
      • Pricing Analysis
      • Market Share Analysis, 2024
        • By Classification
        • By Application
  17. Market Structure Analysis
    • Competition Dashboard
    • Competition Benchmarking
    • Market Share Analysis of Top Players
      • By Regional
      • By Classification
      • By Application
  18. Competition Analysis
    • Competition Deep Dive
      • Siemens
        • Overview
        • Product Portfolio
        • Profitability by Market Segments (Product/Age /Sales Channel/Region)
        • Sales Footprint
        • Strategy Overview
          • Marketing Strategy
          • Product Strategy
          • Channel Strategy
      • Softing Industrial Automation
      • Shenzhen Jietong Technology
      • BAUER KOMPRESSOREN
      • BEKA
      • DITEL
      • microSYST Systemelectronic
      • MTL INSTRUMENT
      • Orbit Merret
      • SENSY S.A.
      • Shanghai Nanhua Electronics Company
      • Siebert Industrieelektronik
      • UTICOR Automation
      • VISUAL ELECTRONIC
      • WIBOND Informationssysteme GmbH
  19. Assumptions & Acronyms Used
  20. Research Methodology

List of Tables

  • Table 1: Global Market Value (USD Million) Forecast by Region, 2020 to 2035
  • Table 2: Global Market Value (USD Million) Forecast by Classification , 2020 to 2035
  • Table 3: Global Market Value (USD Million) Forecast by Application, 2020 to 2035
  • Table 4: North America Market Value (USD Million) Forecast by Country, 2020 to 2035
  • Table 5: North America Market Value (USD Million) Forecast by Classification , 2020 to 2035
  • Table 6: North America Market Value (USD Million) Forecast by Application, 2020 to 2035
  • Table 7: Latin America Market Value (USD Million) Forecast by Country, 2020 to 2035
  • Table 8: Latin America Market Value (USD Million) Forecast by Classification , 2020 to 2035
  • Table 9: Latin America Market Value (USD Million) Forecast by Application, 2020 to 2035
  • Table 10: Western Europe Market Value (USD Million) Forecast by Country, 2020 to 2035
  • Table 11: Western Europe Market Value (USD Million) Forecast by Classification , 2020 to 2035
  • Table 12: Western Europe Market Value (USD Million) Forecast by Application, 2020 to 2035
  • Table 13: Eastern Europe Market Value (USD Million) Forecast by Country, 2020 to 2035
  • Table 14: Eastern Europe Market Value (USD Million) Forecast by Classification , 2020 to 2035
  • Table 15: Eastern Europe Market Value (USD Million) Forecast by Application, 2020 to 2035
  • Table 16: East Asia Market Value (USD Million) Forecast by Country, 2020 to 2035
  • Table 17: East Asia Market Value (USD Million) Forecast by Classification , 2020 to 2035
  • Table 18: East Asia Market Value (USD Million) Forecast by Application, 2020 to 2035
  • Table 19: South Asia and Pacific Market Value (USD Million) Forecast by Country, 2020 to 2035
  • Table 20: South Asia and Pacific Market Value (USD Million) Forecast by Classification , 2020 to 2035
  • Table 21: South Asia and Pacific Market Value (USD Million) Forecast by Application, 2020 to 2035
  • Table 22: Middle East & Africa Market Value (USD Million) Forecast by Country, 2020 to 2035
  • Table 23: Middle East & Africa Market Value (USD Million) Forecast by Classification , 2020 to 2035
  • Table 24: Middle East & Africa Market Value (USD Million) Forecast by Application, 2020 to 2035

List of Figures

  • Figure 1: Global Market Pricing Analysis
  • Figure 2: Global Market Value (USD Million) Forecast 2020-2035
  • Figure 3: Global Market Value Share and BPS Analysis by Classification , 2025 and 2035
  • Figure 4: Global Market Y-o-Y Growth Comparison by Classification , 2025-2035
  • Figure 5: Global Market Attractiveness Analysis by Classification
  • Figure 6: Global Market Value Share and BPS Analysis by Application, 2025 and 2035
  • Figure 7: Global Market Y-o-Y Growth Comparison by Application, 2025-2035
  • Figure 8: Global Market Attractiveness Analysis by Application
  • Figure 9: Global Market Value (USD Million) Share and BPS Analysis by Region, 2025 and 2035
  • Figure 10: Global Market Y-o-Y Growth Comparison by Region, 2025-2035
  • Figure 11: Global Market Attractiveness Analysis by Region
  • Figure 12: North America Market Incremental Dollar Opportunity, 2025-2035
  • Figure 13: Latin America Market Incremental Dollar Opportunity, 2025-2035
  • Figure 14: Western Europe Market Incremental Dollar Opportunity, 2025-2035
  • Figure 15: Eastern Europe Market Incremental Dollar Opportunity, 2025-2035
  • Figure 16: East Asia Market Incremental Dollar Opportunity, 2025-2035
  • Figure 17: South Asia and Pacific Market Incremental Dollar Opportunity, 2025-2035
  • Figure 18: Middle East & Africa Market Incremental Dollar Opportunity, 2025-2035
  • Figure 19: North America Market Value Share and BPS Analysis by Country, 2025 and 2035
  • Figure 20: North America Market Value Share and BPS Analysis by Classification , 2025 and 2035
  • Figure 21: North America Market Y-o-Y Growth Comparison by Classification , 2025-2035
  • Figure 22: North America Market Attractiveness Analysis by Classification
  • Figure 23: North America Market Value Share and BPS Analysis by Application, 2025 and 2035
  • Figure 24: North America Market Y-o-Y Growth Comparison by Application, 2025-2035
  • Figure 25: North America Market Attractiveness Analysis by Application
  • Figure 26: Latin America Market Value Share and BPS Analysis by Country, 2025 and 2035
  • Figure 27: Latin America Market Value Share and BPS Analysis by Classification , 2025 and 2035
  • Figure 28: Latin America Market Y-o-Y Growth Comparison by Classification , 2025-2035
  • Figure 29: Latin America Market Attractiveness Analysis by Classification
  • Figure 30: Latin America Market Value Share and BPS Analysis by Application, 2025 and 2035
  • Figure 31: Latin America Market Y-o-Y Growth Comparison by Application, 2025-2035
  • Figure 32: Latin America Market Attractiveness Analysis by Application
  • Figure 33: Western Europe Market Value Share and BPS Analysis by Country, 2025 and 2035
  • Figure 34: Western Europe Market Value Share and BPS Analysis by Classification , 2025 and 2035
  • Figure 35: Western Europe Market Y-o-Y Growth Comparison by Classification , 2025-2035
  • Figure 36: Western Europe Market Attractiveness Analysis by Classification
  • Figure 37: Western Europe Market Value Share and BPS Analysis by Application, 2025 and 2035
  • Figure 38: Western Europe Market Y-o-Y Growth Comparison by Application, 2025-2035
  • Figure 39: Western Europe Market Attractiveness Analysis by Application
  • Figure 40: Eastern Europe Market Value Share and BPS Analysis by Country, 2025 and 2035
  • Figure 41: Eastern Europe Market Value Share and BPS Analysis by Classification , 2025 and 2035
  • Figure 42: Eastern Europe Market Y-o-Y Growth Comparison by Classification , 2025-2035
  • Figure 43: Eastern Europe Market Attractiveness Analysis by Classification
  • Figure 44: Eastern Europe Market Value Share and BPS Analysis by Application, 2025 and 2035
  • Figure 45: Eastern Europe Market Y-o-Y Growth Comparison by Application, 2025-2035
  • Figure 46: Eastern Europe Market Attractiveness Analysis by Application
  • Figure 47: East Asia Market Value Share and BPS Analysis by Country, 2025 and 2035
  • Figure 48: East Asia Market Value Share and BPS Analysis by Classification , 2025 and 2035
  • Figure 49: East Asia Market Y-o-Y Growth Comparison by Classification , 2025-2035
  • Figure 50: East Asia Market Attractiveness Analysis by Classification
  • Figure 51: East Asia Market Value Share and BPS Analysis by Application, 2025 and 2035
  • Figure 52: East Asia Market Y-o-Y Growth Comparison by Application, 2025-2035
  • Figure 53: East Asia Market Attractiveness Analysis by Application
  • Figure 54: South Asia and Pacific Market Value Share and BPS Analysis by Country, 2025 and 2035
  • Figure 55: South Asia and Pacific Market Value Share and BPS Analysis by Classification , 2025 and 2035
  • Figure 56: South Asia and Pacific Market Y-o-Y Growth Comparison by Classification , 2025-2035
  • Figure 57: South Asia and Pacific Market Attractiveness Analysis by Classification
  • Figure 58: South Asia and Pacific Market Value Share and BPS Analysis by Application, 2025 and 2035
  • Figure 59: South Asia and Pacific Market Y-o-Y Growth Comparison by Application, 2025-2035
  • Figure 60: South Asia and Pacific Market Attractiveness Analysis by Application
  • Figure 61: Middle East & Africa Market Value Share and BPS Analysis by Country, 2025 and 2035
  • Figure 62: Middle East & Africa Market Value Share and BPS Analysis by Classification , 2025 and 2035
  • Figure 63: Middle East & Africa Market Y-o-Y Growth Comparison by Classification , 2025-2035
  • Figure 64: Middle East & Africa Market Attractiveness Analysis by Classification
  • Figure 65: Middle East & Africa Market Value Share and BPS Analysis by Application, 2025 and 2035
  • Figure 66: Middle East & Africa Market Y-o-Y Growth Comparison by Application, 2025-2035
  • Figure 67: Middle East & Africa Market Attractiveness Analysis by Application
  • Figure 68: Global Market - Tier Structure Analysis
  • Figure 69: Global Market - Company Share Analysis
Dashboard
Dashboard
Dashboard
Dashboard
Dashboard
Dashboard

Our Research Products

Full Research Suite

The "Full Research Suite" delivers actionable market intel, deep dives on markets or technologies, so clients act faster, cut risk, and unlock growth.

Competitor Leaderboard Report

The Leaderboard benchmarks and ranks top vendors, classifying them as Established Leaders, Leading Challengers, or Disruptors & Challengers.

Future Leaders Index

Locates where complements amplify value and substitutes erode it, forecasting net impact by horizon

Market Data & Forecasts

We deliver granular, decision-grade intel: market sizing, 5-year forecasts, pricing, adoption, usage, revenue, and operational KPIs—plus competitor tracking, regulation, and value chains—across 60 countries broadly.

Market Focus Report

Spot the shifts before they hit your P&L. We track inflection points, adoption curves, pricing moves, and ecosystem plays to show where demand is heading, why it is changing, and what to do next across high-growth markets and disruptive tech

Survey Report

Real-time reads of user behavior. We track shifting priorities, perceptions of today’s and next-gen services, and provider experience, then pace how fast tech moves from trial to adoption, blending buyer, consumer, and channel inputs with social signals (#WhySwitch, #UX).

Bespoke Reports

Partner with our analyst team to build a custom report designed around your business priorities. From analysing market trends to assessing competitors or crafting bespoke datasets, we tailor insights to your needs.

Supplier Intelligence

Discovery & Profiling

Capacity & Footprint

Performance & Risk

Compliance & Governance

Commercial Readiness

Who Supplies Whom

Scorecards & Shortlists

Playbooks & Docs

Category Intelligence

Definition & Scope

Demand & Use Cases

Cost Drivers

Market Structure

Supply Chain Map

Trade & Policy

Operating Norms

Deliverables

Buyer Intelligence

Account Basics

Spend & Scope

Procurement Model

Vendor Requirements

Terms & Policies

Entry Strategy

Pain Points & Triggers

Outputs

Pricing Analysis

Benchmarks

Trends

Should-Cost

Indexation

Landed Cost

Commercial Terms

Deliverables

Brand Analysis

Positioning & Value Prop

Share & Presence

Customer Evidence

Go-to-Market

Digital & Reputation

Compliance & Trust

KPIs & Gaps

Outputs

Full Research Suite comprises of:

Market outlook & trends analysis

Market outlook & trends analysis

Interviews & case studies

Interviews & case studies

Strategic recommendations

Strategic recommendations

Vendor profiles & capabilities analysis

Vendor profiles & capabilities analysis

5-year forecasts

5-year forecasts

8 regions and 60+ country-level data splits

8 regions and 60+ country-level data splits

Market segment data splits

Market segment data splits

12 months of continuous data updates

12 months of continuous data updates

DELIVERED AS:

PDF EXCEL ONLINE

Full Research Suite


$5000

$7500

$10000

Buy Report Now
Similar Industry Reports

Similar Industry Reports

Display Material Market

Display Material Market Size and Share Forecast Outlook 2025 to 2035

Display Packaging Market

Display Packaging Market Size and Share Forecast Outlook 2025 to 2035

Display Panel Market

Display Panel Market Size and Share Forecast Outlook 2025 to 2035

Display Pallets Market

Display Pallets Market Size and Share Forecast Outlook 2025 to 2035

Display Controllers Market

Display Controllers Market by Type, Application, and Region-Forecast through 2035

Display Drivers Market

Display Drivers Market Growth – Size, Demand & Forecast 2025 to 2035

Displays Market
Displays Market

Displays Market Insights – Growth, Demand & Forecast 2025 to 2035

Display Pallets Market Share analysis

Market Share Distribution Among Display Pallet Manufacturers

Display Paper Box Market

Display Paper Box Market

Display Cabinets Market

Display Cabinets Market

3D Display Market
3D Display Market

3D Display Market Size and Share Forecast Outlook 2025 to 2035

4K Display Resolution Market

4K Display Resolution Market Size and Share Forecast Outlook 2025 to 2035

3D Display Module Market

3D Display Module Market

LED Displays, Lighting and Fixtures Market

LED Displays, Lighting and Fixtures Market Size and Share Forecast Outlook 2025 to 2035

OLED Display Market
OLED Display Market

OLED Display Market Size and Share Forecast Outlook 2025 to 2035

Microdisplay Market
Microdisplay Market

Microdisplay Market Size and Share Forecast Outlook 2025 to 2035

IGZO Display Market
IGZO Display Market

IGZO Display Market Size and Share Forecast Outlook 2025 to 2035

Food Display Counter Market

Food Display Counter Market Size and Share Forecast Outlook 2025 to 2035

4K VR Displays Market

4K VR Displays Market Size and Share Forecast Outlook 2025 to 2035

Shelf Display Trays Market

Shelf Display Trays Market Analysis - Size, Share, and Forecast Outlook 2025 to 2035

Future Market Insights

PROFIBUS Display Market

Chat With MaRIA

Chat With

MaRIA

Hi There, I am MaRIA, Your Market Research Intelligence Assistant. How may I help you?