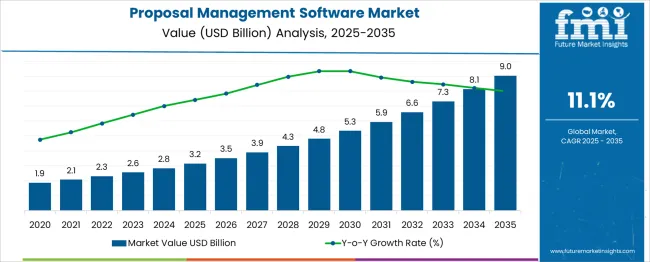
Expansion of the global Proposal Management Software Market is expected to occur at a CAGR of 11.1%, amassing a market revenue of USD 6.7 Billion by 2032. The market is likely to secure USD 2.3 Billion in 2022, up from USD 2 Billion in 2021. From 2021 to 2022, the expected Y-o-Y growth rate is likely to be 15%.
Rapid digitization and favorable initiatives taken by the government of various developing countries are expected to support market growth in the forecast period.
Attributes | Details |
---|---|
Proposal Management Software Market CAGR (2022 to 2032) | 11.1% |
Proposal Management Software Market Size (2022) | USD 2.3 Billion |
Proposal Management Software Market (2032) | USD 6.7 Billion |
The growing need to streamline business operations and the rapid digitization of organizations are expected to act as significant factors propelling the market in the forecast period. Furthermore, the integration of modern technologies, such as; AI-based tools, is likely to offer lucrative opportunities for market expansion in the forthcoming period.
The market is expected to be dominated by the USA, while China is expected to be the most lucrative market, exhibiting a CAGR of 10.4% during the forecast period. For instance, in May 2022, Bold Group, a part of EverCommerce’s Security & Alarm solutions, alarm monitoring, and integrated business management software provider, announced the launch of Managely™.
The software offers a modern and flexible user interface that organizations can incorporate with their brand through invoices, credits, dashboards, and proposals.
The increasing adoption of cloud-based services is anticipated to play a key role in strengthening the global proposal management software market during the forecast period. Also, the growing application of Internet of Things (IoT) services has resulted in the generation of a massive number of data.
The surging adoption of big data and social media platforms has generated a significant need amongst organizations to adopt data analytics software. Integration of modern technologies in organizations helps enterprises to enhance their operations and sustain the rising competition in the market.
The launch of new products in the market is expected to propel the industry expansion in the forecast period. For instance, in August 2021, Frequence, an advertising sales automation leader and workflow software, announced the launch of SmartProposals.
It is a first-of-its-kind technology that uses real-time deal-close and campaign performance data to provide and increase local-market media campaign proposals. It observes millions of data points from an ample number of media campaigns to produce efficient and capable campaign proposals that allow media sellers to generate more revenue. Such product launches are expected to assist the industry expansion during the forecast period.
Other benefits of using an AI-based proposal management software market include increased compatibility, enhanced reliability, and security, among others. Owing to the aforementioned factors, the market is poised to witness notable growth in the assessment tenure.
Growing innovations along with modernization in technology are expected to offer various opportunities for expansion in the coming time. Rapid digitization of BFSI has been identified as the most lucrative opportunity prevailing in the market in the assessment period.
The benefits of using cloud-based software in BFSI are anticipated to drive the market in the forecast period. Innovative customer experiences, efficient collaboration, and better relationships with clients are some of the advantages offered, strengthening the market in the forecast period.
In addition, favorable initiatives taken by players are likely to benefit the market. For instance, in April 2022, Intellect Global Transaction Banking (iGTB) announced that it would integrate Microsoft Cloud for Financial Services to enhance cloud adoption and digital transformation incentives of corporate banks. Such initiatives adopted in the sector are anticipated to propel the industry in the assessment period.
Also, rising financial inclusivity, especially across developing nations is likely to act as a significant opportunity for the market. Favorable initiatives taken by the government are likely to support market growth in the coming time. For instance, the launch of Digital India by the Government of India will benefit the BFSI sector and market in the region during the forecast period.
Concerns regarding data privacy and security concerns are expected to hamper the market growth in the forecast period. Cyber security risks like malware attacks and vulnerabilities in cloud-based applications are projected to have a negative impact on market growth.
As the popularity of IoT and cloud technologies is increasing, enterprises are looking for secure methods to protect themselves from growing vulnerabilities and security breaches. Moreover, such software is deployed on the cloud owing to the proliferation of SaaS-based applications, which also have various security issues since the data on the cloud is a cyber-security concern.
However, the integration of AI for proposal management software can help in tackling such challenges. Also, the launch of products by players is likely to assist organizations in countering such situations.
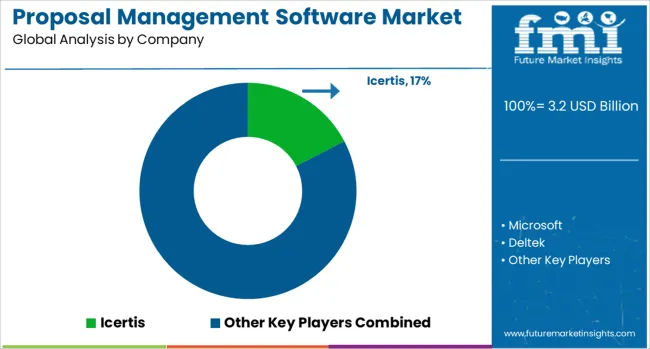
For instance, in May 2019, Icertis announced the acquisition of a security instrumentation player, called, Verodin. Verodin integrated with FireEye Helix’s security orchestration capabilities to assist its customers to automate and prioritize the improvement of security controls. Such initiatives are anticipated to help the market grow in the coming time.
Based on components, the software segment is anticipated to lead the global proposal management market during the forecast period. The segment is expected to expand at a CAGR of 10.9% during the forecast period.
Expansion of the segment can be attributed to the growing innovations in various sectors, such as; IT & Telecom, and BFSI. With rapid digitization and increasing adoption of cloud-based software, the segment is expected to augment notably in the forthcoming time. Moreover, growing innovation and rising investment in Research and Development are expected to offer various lucrative opportunities to the market in the forecast time.
Based on deployment, the on-premises segment is anticipated to lead the global proposal management market. The segment is expected to witness a growth rate of 10.1% during the forecast period.
The expansion of the segment can be attributed to cost efficiency. Also, the wide adoption of such solutions by SMEs is another factor propelling the segmental growth during the forecast period.
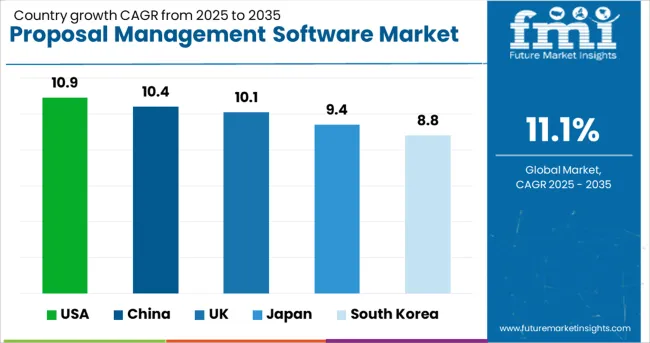
As per the analysis, the global market for proposal management software is anticipated to be dominated by North America during the forecast period. The USA is projected to take the lead in the region while exhibiting a CAGR of 10.9%, garnering a market value of USD 2.3 Billion by 2032. The growth of the regional market can be attributed to the rapid adoption of modern technologies by established players in the region.
High disposable income and the presence of established players in the region are some of the important factors driving the global proposal management software market in the forecast period. Also, the stable economy, developed infrastructure, and growing initiatives to reduce paper waste are other salient factors strengthening the industry in the region.
In addition, with the growing demand for transparency and visibility, the growth of the proposal management software market is affirmative in North America in the forecast period.
Asia Pacific has been identified as the most lucrative market during the forecast period. As per the analysis, China is expected to dominate the market during the forecast period. The region is likely to procure USD 475.2 Million while expanding at a CAGR of 10.4% by 2032.
Other lucrative regions, Japan and South Korea have been estimated at US$ 383.2 Million and US$ 239.1 Million respectively. The growth of the regional market can be attributed to the increasing deployment of cloud-based software in various organizations. And also, the growing initiatives of digitization by the government of several developing countries such as; India, China, and others are expected to support the market expansion in the forecast tenure.
Countries | Estimated CAGR |
---|---|
USA | 10.9% |
UK | 10.1% |
China | 10.4% |
Japan | 9.4% |
South Korea | 8.8% |
Key players in the global proposal management software market are Microsoft, WeSuite, Icertis, Deltek, and GetAccept.
Recent developments in the Industry are as follows:
Table 01: Global Market Value (US$ Million), By Component, 2015 to 2021
Table 02: Global Market Value (US$ Million), By Component, 2022 to 2032
Table 03: Global Market Value (US$ Million), By Vertical, 2015 to 2021
Table 04: Global Market Value (US$ Million), By Vertical, 2022 to 2032
Table 05: Global Market Value (US$ Million), By Deployment Type, 2015 to 2021
Table 06: Global Market Value (US$ Million), By Deployment Type, 2022 to 2032
Table 07: Global Market Value (US$ Million), By Enterprise Size, 2015 to 2021
Table 08: Global Market Value (US$ Million), By Enterprise Size, 2022 to 2032
Table 09: Global Market, By Region, 2015 to 2021
Table 10: Global Market, By Region, 2022 to 2032
Table 11: North America Market Value (US$ Million), By Component, 2015 to 2021
Table 12: North America Market Value (US$ Million), By Component, 2022 to 2032
Table 13: North America Market Value (US$ Million), By Vertical, 2015 to 2021
Table 14: North America Market Value (US$ Million), By Vertical, 2022 to 2032
Table 15: North America Market Value (US$ Million), By Deployment Type, 2015 to 2021
Table 16: North America Market Value (US$ Million), By Deployment Type, 2022 to 2032
Table 17: North America Market Value (US$ Million), By Enterprise Size, 2015 to 2021
Table 18: North America Market Value (US$ Million), By Enterprise Size, 2022 to 2032
Table 19: North America Market, By Country, 2015 to 2021
Table 20: North America Market, By Country, 2022 to 2032
Table 21: Latin America Market Value (US$ Million), By Component, 2015 to 2021
Table 22: Latin America Market Value (US$ Million), By Component, 2022 to 2032
Table 23: Latin America Market Value (US$ Million), By Vertical, 2015 to 2021
Table 24: Latin America Market Value (US$ Million), By Vertical, 2022 to 2032
Table 25: Latin America Market Value (US$ Million), By Deployment Type, 2015 to 2021
Table 26: Latin America Market Value (US$ Million), By Deployment Type, 2022 to 2032
Table 27: Latin America Market Value (US$ Million), By Enterprise Size, 2015 to 2021
Table 28: Latin America Market Value (US$ Million), By Enterprise Size, 2022 to 2032
Table 29: Latin America Market, By Country, 2015 to 2021
Table 30: Latin America Market, By Country, 2022 to 2032
Table 31: Europe Market Value (US$ Million), By Component, 2015 to 2021
Table 32: Europe Market Value (US$ Million), By Component, 2022 to 2032
Table 33: Europe Market Value (US$ Million), By Vertical, 2015 to 2021
Table 34: Europe Market Value (US$ Million), By Vertical, 2022 to 2032
Table 35: Europe Market Value (US$ Million), By Deployment Type, 2015 to 2021
Table 36: Europe Market Value (US$ Million), By Deployment Type, 2022 to 2032
Table 37: Europe Market Value (US$ Million), By Enterprise Size, 2015 to 2021
Table 38: Europe Market Value (US$ Million), By Enterprise Size, 2022 to 2032
Table 39: Europe Market, By Country, 2015 to 2021
Table 40: Europe Market, By Country, 2022 to 2032
Table 41: Asia Pacific Market Value (US$ Million), By Component, 2015 to 2021
Table 42: Asia Pacific Market Value (US$ Million), By Component, 2022 to 2032
Table 43: Asia Pacific Market Value (US$ Million), By Vertical, 2015 to 2021
Table 44: Asia Pacific Market Value (US$ Million), By Vertical, 2022 to 2032
Table 45: Asia Pacific Market Value (US$ Million), By Deployment Type, 2015 to 2021
Table 46: Asia Pacific Market Value (US$ Million), By Deployment Type, 2022 to 2032
Table 47: Asia Pacific Market Value (US$ Million), By Enterprise Size, 2015 to 2021
Table 48: Asia Pacific Market Value (US$ Million), By Enterprise Size, 2022 to 2032
Table 49: Asia Pacific Market, By Country, 2015 to 2021
Table 50: Asia Pacific Market, By Country, 2022 to 2032
Table 51: MEA Market Value (US$ Million), By Component, 2015 to 2021
Table 52: MEA Market Value (US$ Million), By Component, 2022 to 2032
Table 53: MEA Market Value (US$ Million), By Vertical, 2015 to 2021
Table 54: MEA Market Value (US$ Million), By Vertical, 2022 to 2032
Table 55: MEA Market Value (US$ Million), By Deployment Type, 2015 to 2021
Table 56: MEA Market Value (US$ Million), By Deployment Type, 2022 to 2032
Table 57: MEA Market Value (US$ Million), By Enterprise Size, 2015 to 2021
Table 58: MEA Market Value (US$ Million), By Enterprise Size, 2022 to 2032
Table 59: MEA Market, By Country, 2015 to 2021
Table 60: MEA Market, By Country, 2022 to 2032
Figure 01: Global Market Value (US$ Million) and Year-on-Year Growth, 2015 to 2032
Figure 02: Global Market Absolute $ Historical Gain (2015 to 2021) and Opportunity (2022 to 2032), US$ Million
Figure 03: Global Market Share, By Component, 2022 & 2032
Figure 04: Global Market Y-o-Y Growth Projections, By Component - 2022 to 2032
Figure 05: Global Market Attractiveness Index, By Component - 2022 to 2032
Figure 06: Global Market Share, By Vertical, 2022 & 2032
Figure 07: Global Market Y-o-Y Growth Projections, By Vertical - 2022 to 2032
Figure 08: Global Market Attractiveness Index, By Vertical - 2022 to 2032
Figure 09: Global Market Share, By Enterprise Size, 2022 & 2032
Figure 10: Global Market Y-o-Y Growth Projections, By Enterprise Size - 2022 to 2032
Figure 11: Global Market Attractiveness Index, By Enterprise Size - 2022 to 2032
Figure 12: Global Market Share, By Deployment Type, 2022 & 2032
Figure 13: Global Market Y-o-Y Growth Projections, By Deployment Type - 2022 to 2032
Figure 14: Global Market Attractiveness Index, By Deployment Type - 2022 to 2032
Figure 15: Global Market Share, By Region, 2022 & 2032
Figure 16: Global Market Y-o-Y Growth Projections, By Region - 2022 to 2032
Figure 17: Global Market Attractiveness Index, By Region - 2022 to 2032
Figure 18: North America Market Value (US$ Million) and Year-on-Year Growth, 2015 to 2032
Figure 19: North America Market Absolute $ Opportunity Historical (2015 to 2021) and Forecast Period (2022 to 2032), US$ Million
Figure 20: North America Market Share, By Component, 2022 & 2032
Figure 21: North America Market Y-o-Y Growth Projections, By Component - 2022 to 2032
Figure 22: North America Market Attractiveness Index, By Component - 2022 to 2032
Figure 23: North America Market Share, By Vertical, 2022 & 2032
Figure 24: North America Market Y-o-Y Growth Projections, By Vertical - 2022 to 2032
Figure 25: North America Market Attractiveness Index, By Vertical - 2022 to 2032
Figure 26: North America Market Share, By Enterprise Size, 2022 & 2032
Figure 27: North America Market Y-o-Y Growth Projections, By Enterprise Size - 2022 to 2032
Figure 28: North America Market Attractiveness Index, By Enterprise Size - 2022 to 2032
Figure 29: North America Market Share, By Deployment Type, 2022 & 2032
Figure 30: North America Market Y-o-Y Growth Projections, By Deployment Type - 2022 to 2032
Figure 31: North America Market Attractiveness Index, By Deployment Type - 2022 to 2032
Figure 32: North America Market Share, By Country, 2022 & 2032
Figure 33: North America Market Y-o-Y Growth Projections, By Country - 2022 to 2032
Figure 34: North America Market Attractiveness Index, By Country - 2022 to 2032
Figure 35: Latin America Market Value (US$ Million) and Year-on-Year Growth, 2015 to 2032
Figure 36: Latin America Market Absolute $ Opportunity Historical (2015 to 2021) and Forecast Period (2022 to 2032), US$ Million
Figure 37: Latin America Market Share, By Component, 2022 & 2032
Figure 38: Latin America Market Y-o-Y Growth Projections, By Component - 2022 to 2032
Figure 39: Latin America Market Attractiveness Index, By Component - 2022 to 2032
Figure 40: Latin America Market Share, By Vertical, 2022 & 2032
Figure 41: Latin America Market Y-o-Y Growth Projections, By Vertical - 2022 to 2032
Figure 42: Latin America Market Attractiveness Index, By Vertical - 2022 to 2032
Figure 43: Latin America Market Share, By Enterprise Size, 2022 & 2032
Figure 44: Latin America Market Y-o-Y Growth Projections, By Enterprise Size - 2022 to 2032
Figure 45: Latin America Market Attractiveness Index, By Enterprise Size - 2022 to 2032
Figure 46: Latin America Market Share, By Deployment Type, 2022 & 2032
Figure 47: Latin America Market Y-o-Y Growth Projections, By Deployment Type - 2022 to 2032
Figure 48: Latin America Market Attractiveness Index, By Deployment Type - 2022 to 2032
Figure 49: Latin America Market Share, By Country, 2022 & 2032
Figure 50: Latin America Market Y-o-Y Growth Projections, By Country - 2022 to 2032
Figure 51: Latin America Market Attractiveness Index, By Country - 2022 to 2032
Figure 52: Europe Market Value (US$ Million) and Year-on-Year Growth, 2015 to 2032
Figure 53: Europe Market Absolute $ Opportunity Historical (2015 to 2021) and Forecast Period (2022 to 2032), US$ Million
Figure 54: Europe Market Share, By Component, 2022 & 2032
Figure 55: Europe Market Y-o-Y Growth Projections, By Component - 2022 to 2032
Figure 56: Europe Market Attractiveness Index, By Component - 2022 to 2032
Figure 57: Europe Market Share, By Vertical, 2022 & 2032
Figure 58: Europe Market Y-o-Y Growth Projections, By Vertical - 2022 to 2032
Figure 59: Europe Market Attractiveness Index, By Vertical - 2022 to 2032
Figure 60: Europe Market Share, By Enterprise Size, 2022 & 2032
Figure 61: Europe Market Y-o-Y Growth Projections, By Enterprise Size - 2022 to 2032
Figure 62: Europe Market Attractiveness Index, By Enterprise Size - 2022 to 2032
Figure 63: Europe Market Share, By Deployment Type, 2022 & 2032
Figure 64: Europe Market Y-o-Y Growth Projections, By Deployment Type - 2022 to 2032
Figure 65: Europe Market Attractiveness Index, By Deployment Type - 2022 to 2032
Figure 66: Europe Market Share, By Country, 2022 & 2032
Figure 67: Europe Market Y-o-Y Growth Projections, By Country - 2022 to 2032
Figure 68: Europe Market Attractiveness Index, By Country - 2022 to 2032
Figure 69: MEA Market Value (US$ Million) and Year-on-Year Growth, 2015 to 2032
Figure 70: MEA Market Absolute $ Opportunity Historical (2015 to 2021) and Forecast Period (2022 to 2032), US$ Million
Figure 71: MEA Market Share, By Component, 2022 & 2032
Figure 72: MEA Market Y-o-Y Growth Projections, By Component - 2022 to 2032
Figure 73: MEA Market Attractiveness Index, By Component - 2022 to 2032
Figure 74: MEA Market Share, By Vertical, 2022 & 2032
Figure 75: MEA Market Y-o-Y Growth Projections, By Vertical - 2022 to 2032
Figure 76: MEA Market Attractiveness Index, By Vertical - 2022 to 2032
Figure 77: MEA Market Share, By Enterprise Size, 2022 & 2032
Figure 78: MEA Market Y-o-Y Growth Projections, By Enterprise Size - 2022 to 2032
Figure 79: MEA Market Attractiveness Index, By Enterprise Size - 2022 to 2032
Figure 80: MEA Market Share, By Deployment Type, 2022 & 2032
Figure 81: MEA Market Y-o-Y Growth Projections, By Deployment Type - 2022 to 2032
Figure 82: MEA Market Attractiveness Index, By Deployment Type - 2022 to 2032
Figure 83: MEA Market Share, By Country, 2022 & 2032
Figure 84: MEA Market Y-o-Y Growth Projections, By Country - 2022 to 2032
Figure 85: MEA Market Attractiveness Index, By Country - 2022 to 2032
Figure 86: Asia Pacific Market Value (US$ Million) and Year-on-Year Growth, 2015 to 2032
Figure 87: Asia Pacific Market Absolute $ Opportunity Historical (2015 to 2021) and Forecast Period (2022 to 2032), US$ Million
Figure 88: Asia Pacific Market Share, By Component, 2022 & 2032
Figure 89: Asia Pacific Market Y-o-Y Growth Projections, By Component - 2022 to 2032
Figure 90: Asia Pacific Market Attractiveness Index, By Component - 2022 to 2032
Figure 91: Asia Pacific Market Share, By Vertical, 2022 & 2032
Figure 92: Asia Pacific Market Y-o-Y Growth Projections, By Vertical - 2022 to 2032
Figure 93: Asia Pacific Market Attractiveness Index, By Vertical - 2022 to 2032
Figure 94: Asia Pacific Market Share, By Enterprise Size, 2022 & 2032
Figure 95: Asia Pacific Market Y-o-Y Growth Projections, By Enterprise Size - 2022 to 2032
Figure 96: Asia Pacific Market Attractiveness Index, By Enterprise Size - 2022 to 2032
Figure 97: Asia Pacific Market Share, By Deployment Type, 2022 & 2032
Figure 98: Asia Pacific Market Y-o-Y Growth Projections, By Deployment Type - 2022 to 2032
Figure 99: Asia Pacific Market Attractiveness Index, By Deployment Type - 2022 to 2032
Figure 100: Asia Pacific Market Share, By Country, 2022 & 2032
Figure 101: Asia Pacific Market Y-o-Y Growth Projections, By Country - 2022 to 2032
Figure 102: Asia Pacific Market Attractiveness Index, By Country - 2022 to 2032
The global proposal management software market is estimated at USD 2.3 Billion in 2022
The global proposal management software market is projected to value USD 6.7 Billion by 2032
The software segment is anticipated to expand at a CAGR of 10.9% by 2032
The USA is projected to hold a market value of USD 2.3 Billion by 2032
China is predicted to exhibit a CAGR of 10.4% during the forecast period
Japan is expected to garner a market value of USD 383.2 Million by 2032
Explore Similar Insights
Thank you!
You will receive an email from our Business Development Manager. Please be sure to check your SPAM/JUNK folder too.