Methodology

PV Power Forecasting System Market Forecast and Outlook 2025 to 2035

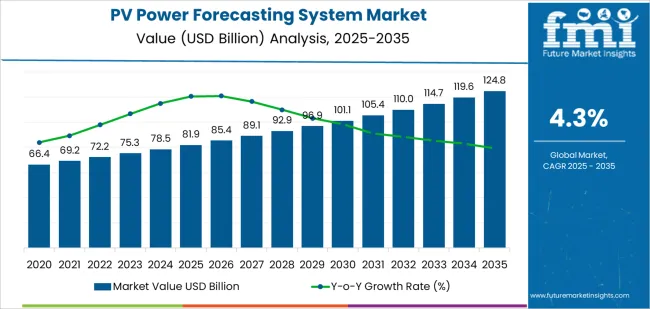
The global PV power forecasting system market is valued at USD 81.9 billion in 2025 and is projected to reach USD 124.9 billion by 2035, registering a CAGR of 4.3%. A compound absolute growth analysis shows a consistent accumulation of annual gains driven by expanding solar capacity additions, rising grid-integration needs, and increased reliance on high-precision forecasting tools to manage variable generation. From the 2025 baseline, cumulative absolute growth rises steadily each year as utilities, grid operators, and large solar asset owners incorporate forecasting solutions to support scheduling accuracy and reduce balancing costs.

Over the forecast period, the compound absolute increase totals USD 43.0 billion, reflecting stable year-over-year additions rather than sharp jumps. Each subsequent year builds on the previous year's installed forecasting infrastructure, creating a layered growth effect where new deployments combine with ongoing upgrades in modeling accuracy, data ingestion, and cloud-based analytics. By 2035, the accumulated gains indicate a market that expands through continuous system enhancement and broader adoption across distributed and utility-scale solar portfolios, producing a sustained upward growth trajectory.
Quick Stats for PV Power Forecasting System Market

  • PV Power Forecasting System Market Value (2025): USD 81.9 billion
  • PV Power Forecasting System Market Forecast Value (2035): USD 124.9 billion
  • PV Power Forecasting System Forecast CAGR: 4.3%
  • Leading Type in PV Power Forecasting System Market: Hardware (43.0%)
  • Key Growth Regions in PV Power Forecasting System Market: East Asia, North America, Europe
  • Top Players in PV Power Forecasting System Market: Vaisala, Beijing Millennium Software, XNY Predict, State Power Rixin Tech., emsys

Pv Power Forecasting System Market Market Value Analysis

What is the Growth Forecast for the PV Power Forecasting System Market through 2035?

Between 2025 and 2030, the PV Power Forecasting System Market expands from USD 81.9 billion to USD 101.1 billion, generating USD 19.2 billion in total growth. During this period, volume expansion contributes approximately 65 to 70 % of the increase as utility-scale solar installations rise and grid operators adopt forecasting platforms to meet day-ahead and intra-day accuracy requirements. Deployment of forecasting-enabled PV capacity grows steadily across major markets. Price growth represents the remaining 30-35 %, driven by the transition toward high-resolution irradiance models, machine-learning-enhanced forecasting tools, and advanced satellite/cloud-mapping technologies that carry higher integration and licensing values.

From 2030 to 2035, the market grows from USD 101.1 billion to USD 124.9 billion, adding USD 23.8 billion. In this period, volume growth contributes around 55-60%, supported by continued expansion of large solar parks and broader mandatory use of forecasting platforms by developers, independent power producers, and grid-balancing authorities. Installed capacity growth moderates slightly but remains substantial enough to drive strong volume contribution. Price-driven growth accounts for 40-45%, reflecting increasing reliance on next-generation forecasting engines featuring real-time performance analytics, cloud-motion vector modeling, and enhanced grid-stability integration requirements.

PV Power Forecasting System Market Key Takeaways

Metric Value
Market Value (2025) USD 81.9 billion
Market Forecast Value (2035) USD 124.9 billion
Forecast CAGR (2025 to 2035) 4.3%

Why Is the PV Power Forecasting System Market Growing Across Utility and Distributed-Energy Networks?

Demand for PV power forecasting systems is increasing as grid operators and solar asset owners require accurate short-term and day-ahead generation predictions to maintain system stability. Forecasting platforms integrate satellite imagery, sky-camera data, numerical weather models, and plant-level telemetry to estimate irradiance and plant output under changing cloud conditions. Utilities depend on these tools to balance dispatch schedules, manage reserve requirements, and reduce curtailment risk during periods of rapid PV fluctuation. Solar developers and independent power producers adopt forecasting systems to optimize bidding strategies, comply with grid-code obligations, and protect revenue in markets where penalties apply for schedule deviations. As solar penetration rises across Asia-Pacific, North America, and Europe, accurate forecasting becomes essential for integrating large volumes of variable generation.

Market growth is also reinforced by advances in machine-learning models and high-resolution weather datasets that improve accuracy for complex terrains and large-scale solar farms. Forecasting providers enhance error-correction algorithms, ramp-rate detection, and probabilistic outputs to support operational planning for transmission and distribution operators. Asset managers integrate forecasting with SCADA, inverter controls, and energy-storage dispatch systems to reduce imbalance costs and improve plant availability. Growth in hybrid plants combining PV, batteries, and wind increases the value of forecasting tools capable of multi-asset coordination. Although data-quality gaps and variable meteorological infrastructure remain challenges in developing regions, ongoing investment in remote-sensing networks and utility-scale digitalization ensures steady global demand for PV power forecasting solutions.

How Do System Components and Power-Plant Structures Shape Segmentation in the PV Power Forecasting System Market?

The PV power forecasting system market is segmented by type, application, and region. By type, the market is divided into hardware and software. Based on application, it is categorized into centralized PV power stations and distributed PV power stations. Regionally, the market is segmented into North America, Europe, East Asia, South Asia, Latin America, and the Middle East & Africa. These divisions reflect differing forecasting requirements, plant sizes, and regional grid-integration patterns that influence forecasting-system deployment.
What Factors Support the Leading Position of Hardware Solutions in PV Power Forecasting?

Pv Power Forecasting System Market Analysis By Type

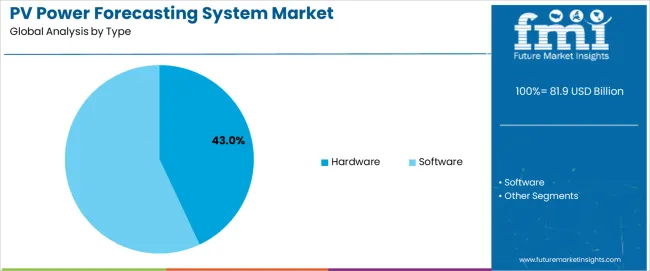
The hardware segment accounts for approximately 43.0% of the global PV power forecasting system market in 2025, making it the leading type category. This position reflects the essential role of meteorological sensors, irradiance measurement devices, sky imagers, and communication units that collect real-time data required for accurate forecasting. Hardware components serve as the foundation for predictive models because they capture environmental variables that influence short-term and intra-day solar output. Utilities and plant operators rely on precise on-site measurements to reduce forecasting errors that affect grid scheduling and dispatch planning.

Manufacturers supply hardware systems designed to withstand outdoor operating conditions and deliver long-term measurement stability. These systems include radiation sensors, temperature probes, wind-speed instruments, and cloud-movement cameras that support localized forecasting. Adoption is strong in East Asia and North America, where large-scale PV installations require detailed environmental monitoring to manage grid interactions. Hardware demand is also supported by integration with supervisory control systems and requirements set by grid operators for real-time data reporting. The hardware segment maintains its lead because accurate forecasting depends on the reliability and continuity of direct field measurements that feed prediction algorithms across a range of plant sizes.
Why Do Centralized PV Power Stations Represent the Largest Application Share in This Market?

Pv Power Forecasting System Market Analysis By Application

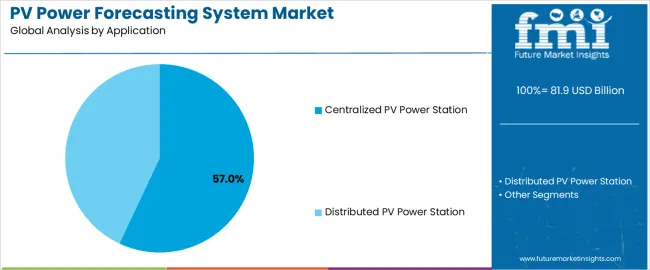
The centralized PV power station segment represents about 57.0% of the total PV power forecasting system market in 2025, making it the dominant application category. This position results from the scale of utility-level installations, which require structured forecasting to support grid balancing, energy-market participation, and operational planning. Centralized plants generate large, variable output that must be predicted with sufficient accuracy to meet dispatch obligations and reduce curtailment risk. Operators depend on forecasting systems to manage ramp rates, anticipate cloud-transit effects, and align output expectations with grid-management protocols.

These plants frequently incorporate on-site meteorological stations and camera-based cloud tracking systems that enhance short-term forecasting. Adoption is strong in East Asia, North America, and Europe, where centralized PV capacity forms a significant share of renewable-power portfolios. Forecasting systems assist grid operators in planning reserve levels and scheduling ancillary services, creating ongoing demand for improved prediction accuracy. Centralized PV stations maintain their leading position because their operational scale requires continuous forecasting support that stabilizes grid integration and improves output predictability across both clear-sky and variable atmospheric conditions.

What are the Key Trends, Drivers, and Restraints in the PV Power Forecasting System Market?

The photovoltaic (PV) power forecasting system market is growing as solar energy integration expands and grid operators, independent power producers and utility-scale projects require accurate predictions of solar generation. These systems use weather data, irradiance models, machine learning and real-time monitoring to forecast PV output and manage variability. Growth is supported by rising solar deployment, more stringent grid-integration requirements and the need to optimise energy storage and trading strategies. Adoption is moderated by data-quality challenges, high implementation cost and complexity of modelling local conditions. Providers are advancing AI-driven forecasting engines, higher-resolution weather feeds and cloud-native delivery platforms to improve accuracy and usability.

How is increased solar capacity and grid protocol driving demand for forecasting systems?

Demand rises as more PV capacity is connected to grids and operators need to manage intermittent generation. Forecasting systems help schedule dispatch, balance supply and demand, and reduce curtailment of solar output. As storage systems and grid services become more prevalent, accurate day-ahead and intra-day forecasts enable better planning and profitability for solar asset owners. The need for forecast data across large distributed solar fleets, micro-grid systems and utility portfolios further strengthens demand for high-resolution and scalable forecasting solutions.

What factors are restraining wider deployment of PV power forecasting solutions?

Adoption is constrained by several key issues including the quality and availability of local weather and irradiance data, the complexity of calibrating models for many site-specific variables (such as shading, module ageing, orientation) and the cost of implementing robust forecasting platforms. Smaller solar operations may lack the budget or personnel to integrate advanced forecasting tools. Uncertainty in forecast accuracy especially in volatile weather conditions reduces confidence among some users. These barriers slow use of sophisticated systems particularly in emerging solar markets.

What trends are shaping the evolution of PV power forecasting technologies?

Key trends include refinement of machine-learning and deep-learning models that incorporate multiple data sources (weather, satellite imagery, sensor data) to improve forecast accuracy. Providers are offering flexible APIs and cloud-based platforms to deliver forecasts from minutes ahead (nowcasting) to days ahead (day-ahead planning). Modular, tiered service models allow users to select levels of accuracy and support based on asset size and budget. Growth in energy-storage coupled PV systems and virtual power plants is increasing demand for integrated forecasting and dispatch optimisation. As solar deployment becomes more distributed, forecasting systems shift toward scalable, edge-compatible, data-driven architectures.
What is the Analysis of the PV Power Forecasting System Market by Key Country?

Pv Power Forecasting System Market Cagr Analysis By Country

Country CAGR (%)
China 5.8%
India 5.4%
Germany 4.9%
Brazil 4.5%
USA 4.1%
UK 3.7%
Japan 3.2%

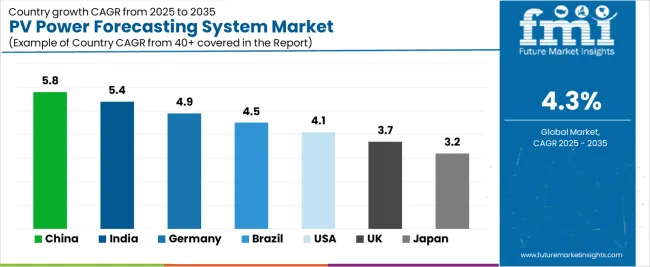
The PV Power Forecasting System Market is expanding steadily across global renewable energy regions, with China leading at a 5.8% CAGR through 2035, driven by rapid solar capacity additions, grid digitization, and rising adoption of AI-based forecasting models. India follows at 5.4%, supported by national solar expansion goals, increasing grid integration needs, and modernization of forecasting mandates for utility-scale PV plants.

Germany records 4.9%, reflecting advanced renewable grid management, strong regulatory frameworks, and widespread deployment of high-precision forecasting tools. Brazil grows at 4.5%, benefiting from expanding solar farms and the need to optimize intermittency management. The USA, at 4.1%, remains a mature market focused on advanced analytics, weather-model innovation, and grid stability solutions, while the UK (3.7%) and Japan (3.2%) emphasize accurate short-term forecasting, cloud-model integrations, and enhanced grid planning for expanding solar fleets.

How Is Solar Capacity Growth Increasing Forecasting Needs in China?

China is projected to grow at a CAGR of 5.8% through 2035 in the PV power forecasting system market. Expanding solar installations, grid modernisation, and rising renewable integration increase demand for accurate short-term and long-term power predictions. Forecasting vendors supply irradiance modelling, cloud tracking, and real-time performance deviation analysis. Grid operators request improved ramp rate estimates and enhanced scheduling tools. Power producers rely on forecasting models to optimise dispatch planning, maintain output stability, and reduce imbalance charges. Growth aligns with rapid deployment of utility-scale and distributed solar assets requiring reliable forecasting support for operational continuity and grid performance.

  • Irradiance modelling improves accuracy for utility-scale forecasting operations nationwide.
  • Ramp rate estimates help grid operators stabilise fluctuating solar output.
  • Cloud tracking tools provide essential visibility for near-term generation predictions.
  • Distributed solar growth increases need for advanced multi-site forecasting.

Why Is Solar Deployment Fueling Forecasting Demand in India?

India is projected to expand at a CAGR of 5.4% through 2035 in the PV power forecasting system market. Rising grid-connected solar capacity, variable generation patterns, and regional climate diversity increase reliance on forecasting tools. Developers request models that support scheduling, curtailment planning, and system optimisation. Vendors integrate satellite imagery, ground sensors, and probabilistic algorithms to support high-frequency forecasts. Discoms and grid operators depend on improved accuracy to manage procurement plans and reduce short-term imbalances. Demand strengthens as commercial and industrial consumers adopt forecasting-enabled energy management for distributed generation systems.

  • Satellite data enhances forecasting accuracy across weather-diverse regions.
  • Curtailment planning helps producers maintain stable operational expectations.
  • Scheduling forecasts support discoms coordinating demand and supply effectively.
  • Industrial users rely on forecasting tools for distributed energy optimisation.

How Do Grid Stability Needs Shape Forecasting Use in Germany?

Pv Power Forecasting System Market Europe Country Market Share Analysis, 2025 & 2035

Germany is expected to rise at a CAGR of 4.9% through 2035 in the PV power forecasting system market. Mature solar adoption, advanced grid frameworks, and strict balancing requirements encourage the use of high-resolution forecasting models. Utilities request near-term forecasts incorporating cloud motion vectors and dynamic system modelling. Developers rely on tools that refine performance baselines and detect abnormal generation behaviour. Grid operators integrate multiple forecasting layers to maintain stability under variable conditions. Increased rooftop solar penetration strengthens the need for predictive systems ensuring operational reliability across distributed assets.

  • Cloud motion vectors strengthen near-term generation prediction accuracy significantly.
  • Baseline refinement helps developers evaluate system performance deviations effectively.
  • Multi-layer forecasts support utilities handling rapid regional demand fluctuations.
  • Distributed generation growth increases reliance on dependable forecasting tools.

Why Are Forecasting Platforms Supporting Solar Growth in Brazil?

Brazil is projected to grow at a CAGR of 4.5% through 2035 in the PV power forecasting system market. Expanding solar installations, diverse weather patterns, and regional transmission constraints heighten demand for refined forecasting capabilities. Vendors provide solutions integrating satellite datasets, local sensor networks, and irradiance simulations. Utilities rely on forecasts to manage dispatch schedules and reduce balancing penalties across interconnected regions. Small and large producers use predictive modelling to maintain consistent operational planning. Forecasting platforms strengthen coordination between solar assets and grid operators across varying climatic zones.

  • Regional climate variation increases forecasting complexity across project locations.
  • Sensor networks enhance accuracy for localized irradiance prediction modelling.
  • Dispatch schedules depend on consistent forecasting for operational planning.
  • Transmission constraints require improved forecasts to support grid reliability.

How Do Market Requirements Influence Forecasting Use in the United States?

Pv Power Forecasting System Market Country Value Analysis

USA is projected to grow at a CAGR of 4.1% through 2035 in the PV power forecasting system market. Variable climate zones, high renewable diversity, and advanced wholesale markets drive sustained reliance on forecasting tools. Utilities require probabilistic forecasts, ramp event identification, and weather-linked generation modelling. Commercial producers adopt forecasting systems to optimise bidding strategies and reduce imbalance costs. Operators integrate advanced analytics that support regional grid coordination. Growth reflects broader reliance on predictive systems as large-scale solar and distributed PV continue expanding across different regional markets.

  • Probabilistic models assist utilities planning responses to rapid variation.
  • Ramp event identification supports grid operators handling sudden system changes.
  • Bidding strategies depend on accurate forecasts for market participation.
  • Regional coordination improves through unified forecasting across multiple networks.

Why Are Reliability Needs Guiding Forecasting Adoption in the United Kingdom?

UK is projected to expand at a CAGR of 3.7% through 2035 in the PV power forecasting system market. Increasing rooftop solar adoption, evolving market rules, and fluctuating irradiance conditions strengthen demand for precise modelling tools. Vendors support utilities with short-term and day-ahead forecasts integrating cloud analytics and irradiance mapping. Commercial solar operators rely on forecasting to manage grid exports and scheduling requirements. Distributed asset growth requires models capable of harmonising diverse system inputs. Market development reflects the importance of reliable predictions for efficient grid participation.

  • Irradiance mapping strengthens forecasting models for rooftop solar systems.
  • Grid export scheduling requires accurate short-term generation predictions.
  • Cloud analytics refine near-term forecasts for rapidly shifting weather.
  • Distributed asset data improves forecasting models supporting operator planning.

How Is Distributed Solar Adoption Increasing Forecasting Use in Japan?

Pv Power Forecasting System Market Japan Market Share Analysis By Type

Japan is projected to grow at a CAGR of 3.2% through 2035 in the PV power forecasting system market. High rooftop solar penetration, varying terrain, and frequent cloud movement heighten reliance on accurate forecasting tools. Utilities adopt near-term prediction models that incorporate sky imaging and high-frequency weather data. Developers use forecasting outputs to plan operations under constrained grid conditions. Forecasts support load balancing and stability across regions with mixed solar density. Vendors expand offerings tailored to compact urban installations and dispersed rural systems.
  • Sky imaging improves accuracy during rapid cloud movement events.
  • Grid constraints increase reliance on stable generation forecasting tools.
  • Urban rooftop density demands precise high-resolution forecasting models.
  • Regional operators rely on predictive data to manage load balancing.

How Competitive Is the Global PV Power Forecasting System Market and What Defines Its Strategic Landscape?

Pv Power Forecasting System Market Analysis By Company

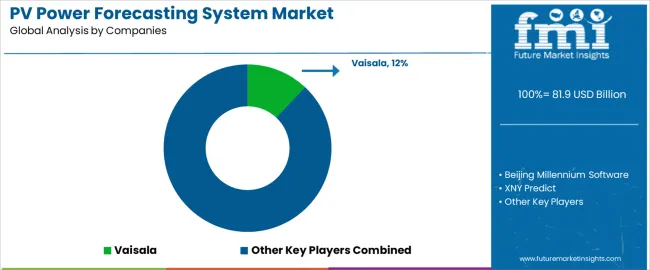
The global PV power forecasting system market shows moderate concentration, led by firms providing forecasting tools that support grid integration, dispatch planning, and performance monitoring for solar assets. Vaisala holds a strong position through advanced irradiance modeling that combines satellite data, numerical weather prediction, and site-specific calibration. Beijing Millennium Software and XNY Predict strengthen China’s domestic forecasting capability with platforms designed for utility-scale PV plants that require rapid-update intervals and localized meteorological inputs. State Power Rixin Tech. supports regional grid operators by supplying forecast models aligned with dispatch requirements and curtailment management frameworks. Across this tier, competition is shaped by model transparency, data-assimilation quality, and the ability to deliver stable forecasts under variable cloud patterns.

emsys contributes specialized expertise for operators managing mixed renewable portfolios, emphasizing real-time forecasting and integration with SCADA and energy-trading platforms. Market competition is influenced by forecast accuracy across multiple horizons, ease of deployment within existing grid systems, and compatibility with digital monitoring tools. Strategic differentiation relies on the precision of weather-model inputs, machine-learning refinement, and long-term system reliability. As PV penetration increases and grids require tighter balancing, suppliers offering high-resolution forecasts, robust validation methods, and dependable operational support are positioned to strengthen their role in global solar forecasting markets.

Key Players in the PV Power Forecasting System Market

  • Vaisala
  • Beijing Millennium Software
  • XNY Predict
  • State Power Rixin Tech.
  • emsys

Report Scope for PV Power Forecasting System Market

Items Values
Quantitative Units (2025) USD billion
Type Hardware, Software
Application Centralized PV power stations, Distributed PV power stations
Regions Covered North America, Europe, East Asia, South Asia, Latin America, Middle East & Africa
Countries Covered China, India, Germany, Brazil, USA, UK, Japan, and 40+ additional countries
Key Companies Profiled Vaisala, Beijing Millennium Software, XNY Predict, State Power Rixin Tech., emsys
Additional Attributes Dollar sales by type and application, hardware vs software install base, accuracy improvements (ML and satellite inputs), short-term vs day-ahead forecast segmentation, grid-integration and curtailment impact, data-assimilation & sensor-network penetration, pricing/licensing models, edge vs cloud delivery, regional regulatory drivers and grid-code requirements, integration with SCADA/energy-storage/market systems

PV Power Forecasting System Market Segmentations

Type:

  • Professional Law Firm
  • Comprehensive Consulting Agency

Application:

  • BFSI
  • Government & Defense
  • Healthcare
  • IT & Telecom
  • Retail & E-commerce
  • Others

Region:

  • East Asia

    • China
    • Japan
    • South Korea
    • Taiwan
    • Rest of East Asia
  • Europe

    • Germany
    • UK
    • France
    • Italy
    • Spain
    • Switzerland
    • Nordic
    • BENELUX
    • Rest of Europe
  • North America

    • USA
    • Canada
    • Mexico
  • South Asia

    • India
    • Pakistan
    • Bangladesh
    • Rest of South Asia
  • Latin America

    • Brazil
    • Argentina
    • Chile
    • Rest of Latin America
  • Middle East & Africa

    • Kingdom of Saudi Arabia
    • Other GCC Countries
    • Turkey
    • South Africa
    • Other African Union
    • Rest of Middle East & Africa
  • Eastern Europe

    • Russia
    • Poland
    • Czech Republic
    • Rest of Eastern Europe

Frequently Asked Questions

How big is the pv power forecasting system market in 2025?

The global pv power forecasting system market is estimated to be valued at USD 81.9 billion in 2025.

What will be the size of pv power forecasting system market in 2035?

The market size for the pv power forecasting system market is projected to reach USD 124.8 billion by 2035.

How much will be the pv power forecasting system market growth between 2025 and 2035?

The pv power forecasting system market is expected to grow at a 4.3% CAGR between 2025 and 2035.

What are the key product types in the pv power forecasting system market?

The key product types in pv power forecasting system market are hardware and software.

Which application segment to contribute significant share in the pv power forecasting system market in 2025?

In terms of application, centralized pv power station segment to command 57.0% share in the pv power forecasting system market in 2025.

Table of Content

  1. Executive Summary
    • Global Market Outlook
    • Demand to side Trends
    • Supply to side Trends
    • Technology Roadmap Analysis
    • Analysis and Recommendations
  2. Market Overview
    • Market Coverage / Taxonomy
    • Market Definition / Scope / Limitations
  3. Market Background
    • Market Dynamics
      • Drivers
      • Restraints
      • Opportunity
      • Trends
    • Scenario Forecast
      • Demand in Optimistic Scenario
      • Demand in Likely Scenario
      • Demand in Conservative Scenario
    • Opportunity Map Analysis
    • Product Life Cycle Analysis
    • Supply Chain Analysis
    • Investment Feasibility Matrix
    • Value Chain Analysis
    • PESTLE and Porter’s Analysis
    • Regulatory Landscape
    • Regional Parent Market Outlook
    • Production and Consumption Statistics
    • Import and Export Statistics
  4. Global Market Analysis 2020 to 2024 and Forecast, 2025 to 2035
    • Historical Market Size Value (USD Million) Analysis, 2020 to 2024
    • Current and Future Market Size Value (USD Million) Projections, 2025 to 2035
      • Y to o to Y Growth Trend Analysis
      • Absolute $ Opportunity Analysis
  5. Global Market Pricing Analysis 2020 to 2024 and Forecast 2025 to 2035
  6. Global Market Analysis 2020 to 2024 and Forecast 2025 to 2035, By Type
    • Introduction / Key Findings
    • Historical Market Size Value (USD Million) Analysis By Type , 2020 to 2024
    • Current and Future Market Size Value (USD Million) Analysis and Forecast By Type , 2025 to 2035
      • Hardware
      • Software
    • Y to o to Y Growth Trend Analysis By Type , 2020 to 2024
    • Absolute $ Opportunity Analysis By Type , 2025 to 2035
  7. Global Market Analysis 2020 to 2024 and Forecast 2025 to 2035, By Application
    • Introduction / Key Findings
    • Historical Market Size Value (USD Million) Analysis By Application, 2020 to 2024
    • Current and Future Market Size Value (USD Million) Analysis and Forecast By Application, 2025 to 2035
      • Centralized PV Power Station
      • Distributed PV Power Station
    • Y to o to Y Growth Trend Analysis By Application, 2020 to 2024
    • Absolute $ Opportunity Analysis By Application, 2025 to 2035
  8. Global Market Analysis 2020 to 2024 and Forecast 2025 to 2035, By Region
    • Introduction
    • Historical Market Size Value (USD Million) Analysis By Region, 2020 to 2024
    • Current Market Size Value (USD Million) Analysis and Forecast By Region, 2025 to 2035
      • North America
      • Latin America
      • Western Europe
      • Eastern Europe
      • East Asia
      • South Asia and Pacific
      • Middle East & Africa
    • Market Attractiveness Analysis By Region
  9. North America Market Analysis 2020 to 2024 and Forecast 2025 to 2035, By Country
    • Historical Market Size Value (USD Million) Trend Analysis By Market Taxonomy, 2020 to 2024
    • Market Size Value (USD Million) Forecast By Market Taxonomy, 2025 to 2035
      • By Country
        • USA
        • Canada
        • Mexico
      • By Type
      • By Application
    • Market Attractiveness Analysis
      • By Country
      • By Type
      • By Application
    • Key Takeaways
  10. Latin America Market Analysis 2020 to 2024 and Forecast 2025 to 2035, By Country
    • Historical Market Size Value (USD Million) Trend Analysis By Market Taxonomy, 2020 to 2024
    • Market Size Value (USD Million) Forecast By Market Taxonomy, 2025 to 2035
      • By Country
        • Brazil
        • Chile
        • Rest of Latin America
      • By Type
      • By Application
    • Market Attractiveness Analysis
      • By Country
      • By Type
      • By Application
    • Key Takeaways
  11. Western Europe Market Analysis 2020 to 2024 and Forecast 2025 to 2035, By Country
    • Historical Market Size Value (USD Million) Trend Analysis By Market Taxonomy, 2020 to 2024
    • Market Size Value (USD Million) Forecast By Market Taxonomy, 2025 to 2035
      • By Country
        • Germany
        • UK
        • Italy
        • Spain
        • France
        • Nordic
        • BENELUX
        • Rest of Western Europe
      • By Type
      • By Application
    • Market Attractiveness Analysis
      • By Country
      • By Type
      • By Application
    • Key Takeaways
  12. Eastern Europe Market Analysis 2020 to 2024 and Forecast 2025 to 2035, By Country
    • Historical Market Size Value (USD Million) Trend Analysis By Market Taxonomy, 2020 to 2024
    • Market Size Value (USD Million) Forecast By Market Taxonomy, 2025 to 2035
      • By Country
        • Russia
        • Poland
        • Hungary
        • Balkan & Baltic
        • Rest of Eastern Europe
      • By Type
      • By Application
    • Market Attractiveness Analysis
      • By Country
      • By Type
      • By Application
    • Key Takeaways
  13. East Asia Market Analysis 2020 to 2024 and Forecast 2025 to 2035, By Country
    • Historical Market Size Value (USD Million) Trend Analysis By Market Taxonomy, 2020 to 2024
    • Market Size Value (USD Million) Forecast By Market Taxonomy, 2025 to 2035
      • By Country
        • China
        • Japan
        • South Korea
      • By Type
      • By Application
    • Market Attractiveness Analysis
      • By Country
      • By Type
      • By Application
    • Key Takeaways
  14. South Asia and Pacific Market Analysis 2020 to 2024 and Forecast 2025 to 2035, By Country
    • Historical Market Size Value (USD Million) Trend Analysis By Market Taxonomy, 2020 to 2024
    • Market Size Value (USD Million) Forecast By Market Taxonomy, 2025 to 2035
      • By Country
        • India
        • ASEAN
        • Australia & New Zealand
        • Rest of South Asia and Pacific
      • By Type
      • By Application
    • Market Attractiveness Analysis
      • By Country
      • By Type
      • By Application
    • Key Takeaways
  15. Middle East & Africa Market Analysis 2020 to 2024 and Forecast 2025 to 2035, By Country
    • Historical Market Size Value (USD Million) Trend Analysis By Market Taxonomy, 2020 to 2024
    • Market Size Value (USD Million) Forecast By Market Taxonomy, 2025 to 2035
      • By Country
        • Kingdom of Saudi Arabia
        • Other GCC Countries
        • Turkiye
        • South Africa
        • Other African Union
        • Rest of Middle East & Africa
      • By Type
      • By Application
    • Market Attractiveness Analysis
      • By Country
      • By Type
      • By Application
    • Key Takeaways
  16. Key Countries Market Analysis
    • USA
      • Pricing Analysis
      • Market Share Analysis, 2024
        • By Type
        • By Application
    • Canada
      • Pricing Analysis
      • Market Share Analysis, 2024
        • By Type
        • By Application
    • Mexico
      • Pricing Analysis
      • Market Share Analysis, 2024
        • By Type
        • By Application
    • Brazil
      • Pricing Analysis
      • Market Share Analysis, 2024
        • By Type
        • By Application
    • Chile
      • Pricing Analysis
      • Market Share Analysis, 2024
        • By Type
        • By Application
    • Germany
      • Pricing Analysis
      • Market Share Analysis, 2024
        • By Type
        • By Application
    • UK
      • Pricing Analysis
      • Market Share Analysis, 2024
        • By Type
        • By Application
    • Italy
      • Pricing Analysis
      • Market Share Analysis, 2024
        • By Type
        • By Application
    • Spain
      • Pricing Analysis
      • Market Share Analysis, 2024
        • By Type
        • By Application
    • France
      • Pricing Analysis
      • Market Share Analysis, 2024
        • By Type
        • By Application
    • India
      • Pricing Analysis
      • Market Share Analysis, 2024
        • By Type
        • By Application
    • ASEAN
      • Pricing Analysis
      • Market Share Analysis, 2024
        • By Type
        • By Application
    • Australia & New Zealand
      • Pricing Analysis
      • Market Share Analysis, 2024
        • By Type
        • By Application
    • China
      • Pricing Analysis
      • Market Share Analysis, 2024
        • By Type
        • By Application
    • Japan
      • Pricing Analysis
      • Market Share Analysis, 2024
        • By Type
        • By Application
    • South Korea
      • Pricing Analysis
      • Market Share Analysis, 2024
        • By Type
        • By Application
    • Russia
      • Pricing Analysis
      • Market Share Analysis, 2024
        • By Type
        • By Application
    • Poland
      • Pricing Analysis
      • Market Share Analysis, 2024
        • By Type
        • By Application
    • Hungary
      • Pricing Analysis
      • Market Share Analysis, 2024
        • By Type
        • By Application
    • Kingdom of Saudi Arabia
      • Pricing Analysis
      • Market Share Analysis, 2024
        • By Type
        • By Application
    • Turkiye
      • Pricing Analysis
      • Market Share Analysis, 2024
        • By Type
        • By Application
    • South Africa
      • Pricing Analysis
      • Market Share Analysis, 2024
        • By Type
        • By Application
  17. Market Structure Analysis
    • Competition Dashboard
    • Competition Benchmarking
    • Market Share Analysis of Top Players
      • By Regional
      • By Type
      • By Application
  18. Competition Analysis
    • Competition Deep Dive
      • Vaisala
        • Overview
        • Product Portfolio
        • Profitability by Market Segments (Product/Age /Sales Channel/Region)
        • Sales Footprint
        • Strategy Overview
          • Marketing Strategy
          • Product Strategy
          • Channel Strategy
      • Beijing Millennium Software
      • XNY Predict
      • State Power Rixin Tech.
      • emsys
  19. Assumptions & Acronyms Used
  20. Research Methodology

List of Tables

  • Table 1: Global Market Value (USD Million) Forecast by Region, 2020 to 2035
  • Table 2: Global Market Value (USD Million) Forecast by Type , 2020 to 2035
  • Table 3: Global Market Value (USD Million) Forecast by Application, 2020 to 2035
  • Table 4: North America Market Value (USD Million) Forecast by Country, 2020 to 2035
  • Table 5: North America Market Value (USD Million) Forecast by Type , 2020 to 2035
  • Table 6: North America Market Value (USD Million) Forecast by Application, 2020 to 2035
  • Table 7: Latin America Market Value (USD Million) Forecast by Country, 2020 to 2035
  • Table 8: Latin America Market Value (USD Million) Forecast by Type , 2020 to 2035
  • Table 9: Latin America Market Value (USD Million) Forecast by Application, 2020 to 2035
  • Table 10: Western Europe Market Value (USD Million) Forecast by Country, 2020 to 2035
  • Table 11: Western Europe Market Value (USD Million) Forecast by Type , 2020 to 2035
  • Table 12: Western Europe Market Value (USD Million) Forecast by Application, 2020 to 2035
  • Table 13: Eastern Europe Market Value (USD Million) Forecast by Country, 2020 to 2035
  • Table 14: Eastern Europe Market Value (USD Million) Forecast by Type , 2020 to 2035
  • Table 15: Eastern Europe Market Value (USD Million) Forecast by Application, 2020 to 2035
  • Table 16: East Asia Market Value (USD Million) Forecast by Country, 2020 to 2035
  • Table 17: East Asia Market Value (USD Million) Forecast by Type , 2020 to 2035
  • Table 18: East Asia Market Value (USD Million) Forecast by Application, 2020 to 2035
  • Table 19: South Asia and Pacific Market Value (USD Million) Forecast by Country, 2020 to 2035
  • Table 20: South Asia and Pacific Market Value (USD Million) Forecast by Type , 2020 to 2035
  • Table 21: South Asia and Pacific Market Value (USD Million) Forecast by Application, 2020 to 2035
  • Table 22: Middle East & Africa Market Value (USD Million) Forecast by Country, 2020 to 2035
  • Table 23: Middle East & Africa Market Value (USD Million) Forecast by Type , 2020 to 2035
  • Table 24: Middle East & Africa Market Value (USD Million) Forecast by Application, 2020 to 2035

List of Figures

  • Figure 1: Global Market Pricing Analysis
  • Figure 2: Global Market Value (USD Million) Forecast 2020-2035
  • Figure 3: Global Market Value Share and BPS Analysis by Type , 2025 and 2035
  • Figure 4: Global Market Y-o-Y Growth Comparison by Type , 2025-2035
  • Figure 5: Global Market Attractiveness Analysis by Type
  • Figure 6: Global Market Value Share and BPS Analysis by Application, 2025 and 2035
  • Figure 7: Global Market Y-o-Y Growth Comparison by Application, 2025-2035
  • Figure 8: Global Market Attractiveness Analysis by Application
  • Figure 9: Global Market Value (USD Million) Share and BPS Analysis by Region, 2025 and 2035
  • Figure 10: Global Market Y-o-Y Growth Comparison by Region, 2025-2035
  • Figure 11: Global Market Attractiveness Analysis by Region
  • Figure 12: North America Market Incremental Dollar Opportunity, 2025-2035
  • Figure 13: Latin America Market Incremental Dollar Opportunity, 2025-2035
  • Figure 14: Western Europe Market Incremental Dollar Opportunity, 2025-2035
  • Figure 15: Eastern Europe Market Incremental Dollar Opportunity, 2025-2035
  • Figure 16: East Asia Market Incremental Dollar Opportunity, 2025-2035
  • Figure 17: South Asia and Pacific Market Incremental Dollar Opportunity, 2025-2035
  • Figure 18: Middle East & Africa Market Incremental Dollar Opportunity, 2025-2035
  • Figure 19: North America Market Value Share and BPS Analysis by Country, 2025 and 2035
  • Figure 20: North America Market Value Share and BPS Analysis by Type , 2025 and 2035
  • Figure 21: North America Market Y-o-Y Growth Comparison by Type , 2025-2035
  • Figure 22: North America Market Attractiveness Analysis by Type
  • Figure 23: North America Market Value Share and BPS Analysis by Application, 2025 and 2035
  • Figure 24: North America Market Y-o-Y Growth Comparison by Application, 2025-2035
  • Figure 25: North America Market Attractiveness Analysis by Application
  • Figure 26: Latin America Market Value Share and BPS Analysis by Country, 2025 and 2035
  • Figure 27: Latin America Market Value Share and BPS Analysis by Type , 2025 and 2035
  • Figure 28: Latin America Market Y-o-Y Growth Comparison by Type , 2025-2035
  • Figure 29: Latin America Market Attractiveness Analysis by Type
  • Figure 30: Latin America Market Value Share and BPS Analysis by Application, 2025 and 2035
  • Figure 31: Latin America Market Y-o-Y Growth Comparison by Application, 2025-2035
  • Figure 32: Latin America Market Attractiveness Analysis by Application
  • Figure 33: Western Europe Market Value Share and BPS Analysis by Country, 2025 and 2035
  • Figure 34: Western Europe Market Value Share and BPS Analysis by Type , 2025 and 2035
  • Figure 35: Western Europe Market Y-o-Y Growth Comparison by Type , 2025-2035
  • Figure 36: Western Europe Market Attractiveness Analysis by Type
  • Figure 37: Western Europe Market Value Share and BPS Analysis by Application, 2025 and 2035
  • Figure 38: Western Europe Market Y-o-Y Growth Comparison by Application, 2025-2035
  • Figure 39: Western Europe Market Attractiveness Analysis by Application
  • Figure 40: Eastern Europe Market Value Share and BPS Analysis by Country, 2025 and 2035
  • Figure 41: Eastern Europe Market Value Share and BPS Analysis by Type , 2025 and 2035
  • Figure 42: Eastern Europe Market Y-o-Y Growth Comparison by Type , 2025-2035
  • Figure 43: Eastern Europe Market Attractiveness Analysis by Type
  • Figure 44: Eastern Europe Market Value Share and BPS Analysis by Application, 2025 and 2035
  • Figure 45: Eastern Europe Market Y-o-Y Growth Comparison by Application, 2025-2035
  • Figure 46: Eastern Europe Market Attractiveness Analysis by Application
  • Figure 47: East Asia Market Value Share and BPS Analysis by Country, 2025 and 2035
  • Figure 48: East Asia Market Value Share and BPS Analysis by Type , 2025 and 2035
  • Figure 49: East Asia Market Y-o-Y Growth Comparison by Type , 2025-2035
  • Figure 50: East Asia Market Attractiveness Analysis by Type
  • Figure 51: East Asia Market Value Share and BPS Analysis by Application, 2025 and 2035
  • Figure 52: East Asia Market Y-o-Y Growth Comparison by Application, 2025-2035
  • Figure 53: East Asia Market Attractiveness Analysis by Application
  • Figure 54: South Asia and Pacific Market Value Share and BPS Analysis by Country, 2025 and 2035
  • Figure 55: South Asia and Pacific Market Value Share and BPS Analysis by Type , 2025 and 2035
  • Figure 56: South Asia and Pacific Market Y-o-Y Growth Comparison by Type , 2025-2035
  • Figure 57: South Asia and Pacific Market Attractiveness Analysis by Type
  • Figure 58: South Asia and Pacific Market Value Share and BPS Analysis by Application, 2025 and 2035
  • Figure 59: South Asia and Pacific Market Y-o-Y Growth Comparison by Application, 2025-2035
  • Figure 60: South Asia and Pacific Market Attractiveness Analysis by Application
  • Figure 61: Middle East & Africa Market Value Share and BPS Analysis by Country, 2025 and 2035
  • Figure 62: Middle East & Africa Market Value Share and BPS Analysis by Type , 2025 and 2035
  • Figure 63: Middle East & Africa Market Y-o-Y Growth Comparison by Type , 2025-2035
  • Figure 64: Middle East & Africa Market Attractiveness Analysis by Type
  • Figure 65: Middle East & Africa Market Value Share and BPS Analysis by Application, 2025 and 2035
  • Figure 66: Middle East & Africa Market Y-o-Y Growth Comparison by Application, 2025-2035
  • Figure 67: Middle East & Africa Market Attractiveness Analysis by Application
  • Figure 68: Global Market - Tier Structure Analysis
  • Figure 69: Global Market - Company Share Analysis
Dashboard
Dashboard
Dashboard
Dashboard
Dashboard
Dashboard

Our Research Products

Full Research Suite

The "Full Research Suite" delivers actionable market intel, deep dives on markets or technologies, so clients act faster, cut risk, and unlock growth.

Competitor Leaderboard Report

The Leaderboard benchmarks and ranks top vendors, classifying them as Established Leaders, Leading Challengers, or Disruptors & Challengers.

Future Leaders Index

Locates where complements amplify value and substitutes erode it, forecasting net impact by horizon

Market Data & Forecasts

We deliver granular, decision-grade intel: market sizing, 5-year forecasts, pricing, adoption, usage, revenue, and operational KPIs—plus competitor tracking, regulation, and value chains—across 60 countries broadly.

Market Focus Report

Spot the shifts before they hit your P&L. We track inflection points, adoption curves, pricing moves, and ecosystem plays to show where demand is heading, why it is changing, and what to do next across high-growth markets and disruptive tech

Survey Report

Real-time reads of user behavior. We track shifting priorities, perceptions of today’s and next-gen services, and provider experience, then pace how fast tech moves from trial to adoption, blending buyer, consumer, and channel inputs with social signals (#WhySwitch, #UX).

Bespoke Reports

Partner with our analyst team to build a custom report designed around your business priorities. From analysing market trends to assessing competitors or crafting bespoke datasets, we tailor insights to your needs.

Supplier Intelligence

Discovery & Profiling

Capacity & Footprint

Performance & Risk

Compliance & Governance

Commercial Readiness

Who Supplies Whom

Scorecards & Shortlists

Playbooks & Docs

Category Intelligence

Definition & Scope

Demand & Use Cases

Cost Drivers

Market Structure

Supply Chain Map

Trade & Policy

Operating Norms

Deliverables

Buyer Intelligence

Account Basics

Spend & Scope

Procurement Model

Vendor Requirements

Terms & Policies

Entry Strategy

Pain Points & Triggers

Outputs

Pricing Analysis

Benchmarks

Trends

Should-Cost

Indexation

Landed Cost

Commercial Terms

Deliverables

Brand Analysis

Positioning & Value Prop

Share & Presence

Customer Evidence

Go-to-Market

Digital & Reputation

Compliance & Trust

KPIs & Gaps

Outputs

Full Research Suite comprises of:

Market outlook & trends analysis

Market outlook & trends analysis

Interviews & case studies

Interviews & case studies

Strategic recommendations

Strategic recommendations

Vendor profiles & capabilities analysis

Vendor profiles & capabilities analysis

5-year forecasts

5-year forecasts

8 regions and 60+ country-level data splits

8 regions and 60+ country-level data splits

Market segment data splits

Market segment data splits

12 months of continuous data updates

12 months of continuous data updates

DELIVERED AS:

PDF EXCEL ONLINE

Full Research Suite


$5000

$7500

$10000

Buy Report Now
Similar Industry Reports

Similar Industry Reports

PVPP Beer Stabilizer Market

PVPP Beer Stabilizer Market Size and Share Forecast Outlook 2025 to 2035

PVC-M High Impact Resistant Water Supply Pipe Market

PVC-M High Impact Resistant Water Supply Pipe Market Size and Share Forecast Outlook 2025 to 2035

PVC UV Stabilizer Market

PVC UV Stabilizer Market Size and Share Forecast Outlook 2025 to 2035

PVT Collectors Market

PVT Collectors Market Size and Share Forecast Outlook 2025 to 2035

PVC Electrical Conduit Market

PVC Electrical Conduit Market Size and Share Forecast Outlook 2025 to 2035

PVC Cling Film Market

PVC Cling Film Market Size and Share Forecast Outlook 2025 to 2035

PV Combiner Box Market

PV Combiner Box Market Size and Share Forecast Outlook 2025 to 2035

PVC Tapes Market
PVC Tapes Market

PVC Tapes Market Size and Share Forecast Outlook 2025 to 2035

PVC Footwear Market
PVC Footwear Market

PVC Footwear Market Analysis by Growth, Trends and Forecast from 2025 to 2035

PVC Packing Straps Market

PVC Packing Straps Market Report – Key Trends & Forecast 2025 to 2035

PV Micro Inverters Market

PV Micro Inverters Market Trends & Forecast 2025 to 2035

PV Inverter Market
PV Inverter Market

PV Inverter Market Analysis by Product, Phase, Connectivity, Nominal Power Output, Nominal Output Voltage, Application, and Region through 2035

PV Module Encapsulant Film Market

PV Module Encapsulant Film Market Analysis by Material Type, Application, Thickness, Weight, End-Use, and Region Forecast through 2035

PVC-Free Cap Liners Market Share Analysis

Market Share Insights of PVC-Free Cap Liner Manufacturers

PVC Tapes Market Share Analysis

Leading Providers & Market Share in PVC Tapes Industry

PVDC Coated Films Market

PVDC Coated Film Market Growth and Outlook 2025 to 2035

PVC Cling Wrap Market

PVC Cling Wrap Market Trends & Growth Forecast 2024-2034

PVC Blister Packs Market

PVC Blister Packs Market

PVC Container Market

PVC Container Market

PVC-Free Packaging Market

PVC-Free Packaging Market

Future Market Insights

PV Power Forecasting System Market

Chat With MaRIA

Chat With

MaRIA

Hi There, I am MaRIA, Your Market Research Intelligence Assistant. How may I help you?