Radiation-Induced Myelosuppression Treatment Market Outlook : 2022 to 2028

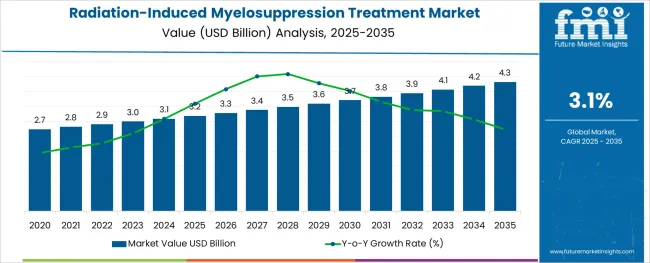
Sales in the global Radiation-Induced Myelosuppression Treatment Market are slated to total USD 2.9 Billion in 2022. Expanding at a steady 3.1% CAGR, the market valuation is projected to top USD 3.5 Billion in 2028.

Attribute Details
Radiation-Induced Myelosuppression Treatment Estimated Market Size 2022 USD 2.9 Billion
Radiation-Induced Myelosuppression Treatment Market Value-based CAGR (2022 to 2028) 3.1%
Radiation-Induced Myelosuppression Treatment Market Projected Size in 2028 USD 3.5 Billion

Increasing incidence of cancer worldwide is underpinning the need for advanced cancer treatment options and therapies. Early diagnosis and the availability of radiotherapy and chemotherapy are expected to fuel sales in the market through 2031.

In addition to this, the introduction of adjuvant therapy for cancer is playing a vital role in reducing the death rate of cancer, improving disease management, and the overall quality of life in cancer patients. As per Future Market Insights, the market is projected to expand on the back of the aforementioned factors over the forecast period.

How The Market Progressed Till June 2022?

Particulars Details
H1, 2021 3.42%
H1, 2022 Projected 3.12%
H1, 2022 Outlook 2.62%
BPS Change - H1, 2022 (O) - H1, 2022 (P) (-) 50 ↓
BPS Change - H1, 2022 (O) - H1, 2021 (-) 80 ↓

Future Market Insights presents a comparative analysis about the market growth rates and development prospects in the global market. According to FMI analysis, the radiation-induced myelosuppression treatment market is expected to drop by 80 Basis Point Share (BPS) in H1- 2022 compared to H1-2021.

However, BPS change of only 50 BPS was observed when comparing H1-2022 Outlook and H1-2022 Projected growth. Key reason for this dip in BPS is attributed to the factor such as stringent government regulations and approval process for pipeline products, which impacted the growth of the market.

However, some positive factors which will influence the market growth in future include new developments and introduction of novel therapeutics for treatment of radiation induced myelosuppression. For instance, on Feb 2021, FDA approved trilaciclib (Cosela, G1 Therapeutics) for lowering the rate of chemotherapy-induced myelosuppression (CIM) in adult patients suffering from extensive-stage small-cell lung cancer (ES-SCLC).

2013 to 2021 Radiation-Induced Myelosuppression Treatment Market Outlook in Comparison to 2022 to 2028 Growth Forecast

Demand in the radiation-induced myelosuppression treatment market is projected to increase at a 3.1% CAGR, in comparison to the 3.4% CAGR registered between 2013 to 2031.

The availability of various growth factors and favorable treatment guidelines have made the management of neutropenia easier. However, thrombocytopenia and anemia are still posing a burden on the healthcare system.

Thrombocytopenia can be managed with the help of available growth factors, but most of them are off-label. The management of anemia remains a challenge for cancer patients who receive radiation therapy for cancer treatment.

Due to changes in reimbursement and labeling of medications for anemia, the use of off-label indication erythropoietin-stimulating agents has decreased to an extent. This has resulted in growing need for blood transfusion, which is associated with various risk factors.

This, in turn, is underscoring the significance of myelosuppression treatment therapeutics and drugs, which is expected to boost the market over the assessment period.

How is the Introduction of Novel Therapeutics for Myelosuppression Treatment Fueling Sales?

Anemia is a common consequence of chronic kidney diseases (CKD) and radiation-induced myelosuppression. Due to the insufficiency of erythropoietin synthesis, patients suffer from anemia. However, the combination of erythropoiesis-stimulating agents (ESA) and iron has become a standard treatment for anemia.

ESAs effectively increase the hemoglobin (Hb) levels in patients. However, their use has been associated with increased cardiovascular risk, especially due to high dose intake in inflamed and hyporesponsive patients.

Iron deficiency is another consequence of anemia. This has resulted in the introduction of intravenous iron therapy which is beneficial for anemic patients, CKD patients, and patients dealing with heart failure.

A new class of drugs, namely prolyl hydroxylase domain (PHD) inhibitors is now available for the treatment of anemia. These drugs effectively stimulate the synthesis of endogenous erythropoietin and increase iron availability.

In addition to this, in February, the USA Food and Drug Administration (FDA)approved Cosela (Trilaciclib) as the first line of treatment in its class to reduce the frequency of bone marrow suppression in adults, which is caused by chemotherapy for the extensive stage.

Such developments are expected to provide impetus to the growth of the market over the assessment period, opines FMI.
Country-wise Insights

What Will be the USA Radiation-Induced Myelosuppression Treatment Market Outlook?

High Prevalence of Chemotherapy Induced Myelosuppression Will Spur Demand in the USA

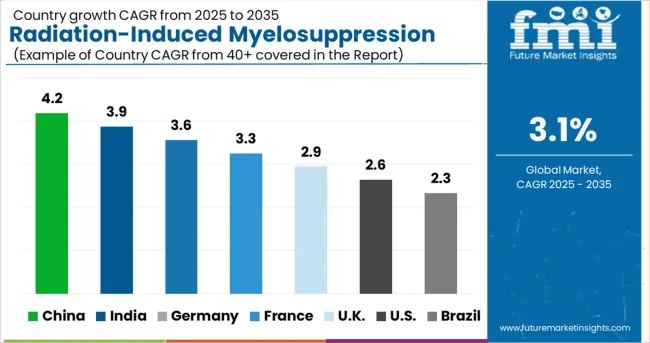
The USA is expected to dominate the North America radiation-induced myelosuppression treatment market owing to growing incidence of cancer, chronic kidney diseases (CKD), and patients dealing with heart failure.

The presence of leading market players and fast-tracked approvals by the FDA are expected to augment the growth of the USA market. In addition to this, the USA is home to a vast healthcare sector, which is expected to provide opportunities for growth to market players over the assessment period.

What is Driving the China Radiation-Induced Myelosuppression Treatment Market?

Healthcare Providers are Prescribing Myelosuppressive Chemotherapy Drugs To improve Bone Marrow Function

China is expected to account for a lion’s share of the East Asia radiation-induced myelosuppression treatment market. Increasing geriatric population in the country, along with high incidence of cancer and heart failure are spurring the demand for myelosuppression treatment drugs.

Further, increasing research and development activities for the development of iron deficiency treatment is expected to augment the growth of the market. Iron deficiency is a consequence of anemia caused by chemotherapy radiation.

Growing preference for erythropoiesis-stimulating agents (ESAs) for iron deficiency in the country is anticipated to boost the market in the forthcoming years.

How Will the UK Radiation-Induced Myelosuppression Treatment Market Fare?

Surging Trend of Medical Tourism Will Boost Sales of Myelosuppression Chemotherapy Drugs

The UK is expected to emerge as a lucrative pocket in the Europe radiation-induced myelosuppression treatment market owing to the influx of medical tourists in the country, along with the availability of superior healthcare facilities.

Increasing adoption of technologically advanced medical equipment for the treatment of various chronic disorders such and cancer and kidney failure in the country is expected to augment the growth of the market in the forthcoming years.

Further, rising awareness regarding adjuvant treatment for cancer in the UK will continue boosting the market over the assessment period.

Category-wise Insights

Which Indication Segment is Most Lucrative?

Surging Incidence of Neutropenia to Drive Preference for Myelosuppression Treatment Regimen

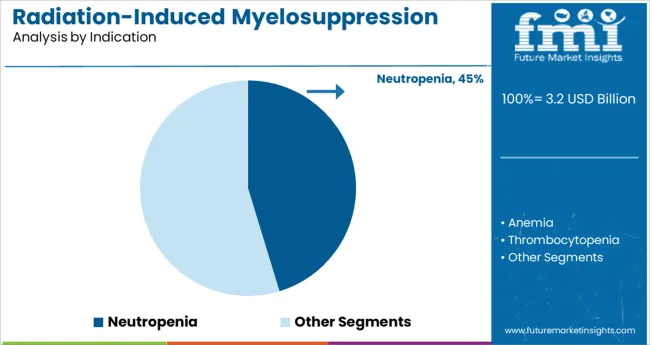
Based on indication, sales in the neutropenia segment are projected to account for 43.3% of the total market share in 2022. Neutropenia is a condition where an individual deals with abnormally low counts of white blood cells.

Bone marrow malfunction caused by chemotherapy radiations is a chief factor driving sales in this segment. Lack of white blood cells in patients weakens the immune system and their ability to fight infections, which makes it imperative to seek treatment for the same.

Owing to the aforementioned factors, sales in this segment are projected to increase at a considerable pace over the assessment period.

Why is the Demand for Erythropoietin Stimulating Agents (ESAs) High?

Rising Awareness Regarding New Erythropoietin Stimulating Agents Will Bolster Sales

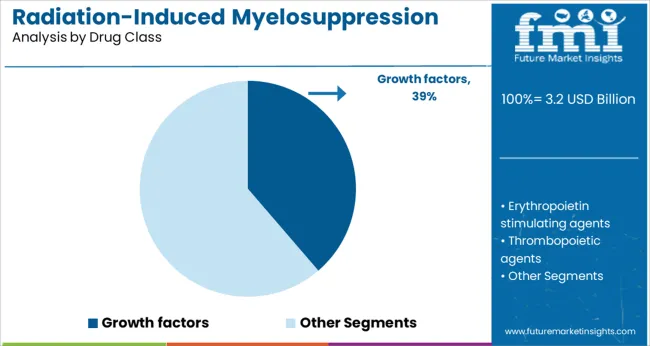
In terms of drug class, demand in the erythropoietin stimulating agents (ESA) segment is projected to remain high over the assessment period. ESAs effectively improve the efficacy of iron therapy in anemic patients after chemotherapy radiations, which is expected to continue pushing sales in the market.

Besides this, growing preference for intravenous iron therapy with a combination of ESAs is expected to complement the growth of the market in the forthcoming years. The combination of ESAs and IV iron therapy improve the red blood cells count as compared to other treatment using ESAs alone.

Which is the Leading Distribution Channel and Route of Administration?

Sales of Myelosuppression Chemotherapy Drugs to Remain High Via Hospital Pharmacies

Based on the sales channel, sales in the hospital pharmacies segment are projected to increase at a considerable pace owing to the wide availability of therapeutic drugs in these shops. However, high convenience and timely delivery offered by online pharmacies will place them as a lucrative segment over the assessment period.

Which is the Preferred Route of Administration?

Oral Route of Administration for Myelosuppression Chemotherapy Medication to Gain Traction

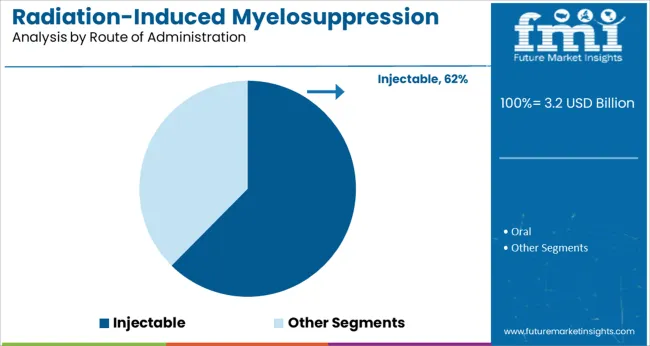
In terms of route of administration, the oral route is expected to be preferred by both healthcare professionals and patients owing to ease of administration and high efficacy. Growing preference for non-invasive treatment options will also provide impetus to sales in this segment.
Competition Landscape

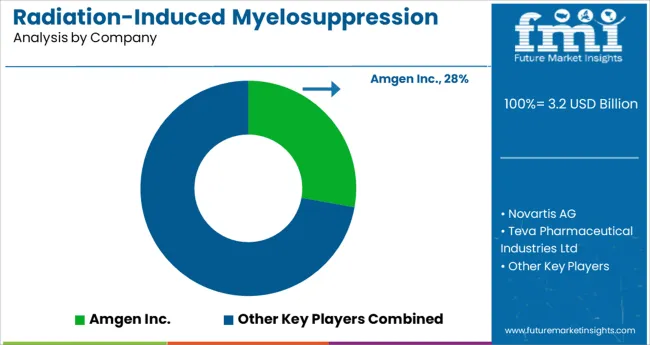
Leading players operating in the global radiation-induced myelosuppression treatment market are investing in research and development to improve lines of treatment for myelosuppression treatment. In addition to this, players are investing in mergers and acquisitions to strengthen their distribution channels.

Scope of Report

Attribute Details
Forecast Period 2022 to 2028
Historical Data Available for 2013 to 2021
Market Analysis Units for Volume and USD Million for Value
Key Regions Covered North America; Latin America; Europe; East Asia; South Asia; Oceania, and MEA
Key Countries Covered United States, Canada, Brazil, Mexico, Germany, UK, France, Italy, Spain, Nordic, Russia, Poland, China, India, Thailand, Indonesia, Australia and New Zealand, Japan, GCC countries, North Africa, South Africa, others.
Key Market Segments Covered Indication, Drug Class, Route of Administration, Distribution Channel, and Region
Key Companies Profiled Amgen Inc.; Novartis AG; Teva Pharmaceutical Industries Ltd; Mylan N.V.; Pfizer Inc.; Janssen Global Services, LLC (Johnson & Johnson); Partner Therapeutics, Inc.; Mission Pharmacal Company; Myelo Therapeutics GmbH; Pluristem Therapeutics Inc.
Pricing Available upon Request

Radiation-Induced Myelosuppression Treatment Market by Category

Indication:

  • Neutropenia
  • Anemia
  • Thrombocytopenia

Drug Class:

  • Growth factors
  • Erythropoietin stimulating agents
  • Thrombopoietic agents
  • Iron supplements

Route of Administration:

  • Oral
  • Injectable

Distribution Channel:

  • Hospital pharmacies
  • Retail pharmacies
  • Online pharmacies
  • Drug stores

Region:

  • North America
  • Latin America
  • Europe
  • East Asia
  • South Asia
  • Oceania
  • Middle East & Africa

Table of Content

  • 1. Executive Summary
  • 2. Market Introduction
  • 3. Radiation Induced Myelosuppression Treatment Market Opportunity Analysis
  • 4. Market Background
  • 5. Macroeconomic Assumptions
  • 6. Global Economic Outlook
  • 7. Key Inclusions
  • 8. Global Market Analysis 2013 to 2021 and Forecast 2022 to 2028
  • 9. North America Radiation Induced Myelosuppression Treatment Market Analysis 2013 to 2021 and Forecast 2022 to 2028
  • 10. Latin America Radiation Induced Myelosuppression Treatment Market Analysis 2013 to 2021 and Forecast 2022 to 2028
  • 11. Western Europe Radiation Induced Myelosuppression Treatment Market Analysis 2013 to 2021 and Forecast 2022 to 2028
  • 12. Eastern Europe Radiation Induced Myelosuppression Treatment Market Analysis 2013 to 2021 and Forecast 2022 to 2028
  • 13. Asia Pacific excluding China (APEC) Radiation Induced Myelosuppression Treatment Market Analysis 2013 to 2021 and Forecast 2022 to 2028
  • 14. Japan Radiation Induced Myelosuppression Treatment Market Analysis 2013 to 2021 and Forecast 2022 to 2028
  • 15. MEA Radiation Induced Myelosuppression Treatment Market Analysis 2013 to 2021 and Forecast 2022 to 2028
  • 16. Forecast Factors: Relevance and Impact
  • 17. Forecast Assumptions
  • 18. Competition Analysis
    • 18.1. Amgen Inc.
    • 18.2. Novartis AG
    • 18.3. Teva Pharmaceutical Industries Ltd
    • 18.4. Mylan N.V.
    • 18.5. Pfizer Inc.
    • 18.6. Janssen Global Services, LLC (Johnson & Johnson)
    • 18.7. Partner Therapeutics, Inc.
    • 18.8. Mission Pharmacal Company
    • 18.9. Myelo Therapeutics GmbH
    • 18.10. Pluristem Therapeutics Inc.
  • 19. Global Radiation Induced Myelosuppression Treatment Market Analysis 2013 to 2021 and Forecast 2022 to 2028, By Region
    • 19.1. North America
    • 19.2. Latin America
    • 19.3. Western Europe
    • 19.4. Eastern Europe
    • 19.5. Asia Pacific excluding Japan
    • 19.6. Japan
    • 19.7. Middle East and Africa
  • 20. Global Radiation Induced Myelosuppression Treatment Market Analysis 2013 to 2021 and Forecast 2022 to 2028, By Drug Class
    • 20.1. Growth Factors
      • 20.1.1. Granulocyte Colony-Stimulating Factor
      • 20.1.2. Thrombopoietin Receptor Agonists
    • 20.2. Erythropoietin-stimulating Agents
    • 20.3. Thrombopoietic Agents
    • 20.4. Iron supplementation
    • 20.5. Others
  • 21. Global Radiation Induced Myelosuppression Treatment Market Analysis 2013 to 2021 and Forecast 2022 to 2028, By Route of Administration
    • 21.1. Oral
    • 21.2. Injectable
  • 22. Global Radiation Induced Myelosuppression Treatment Market Analysis 2013 to 2021 and Forecast 2022 to 2028, By Indication
    • 22.1. Anemia
    • 22.2. Neutropenia
    • 22.3. Thrombocytopenia
  • 23. Global Radiation Induced Myelosuppression Treatment Market Analysis 2013 to 2021 and Forecast 2022 to 2028, By Distribution Channel
    • 23.1. Hospital Pharmacies
    • 23.2. Retail Pharmacies
    • 23.3. Drug Stores
    • 23.4. Online Pharmacies
  • 24. Research Methodology

List of Tables

Table 1: Radiation Induced Myelosuppression Treatment Market Pipeline Analysis (2021)

Table 2: North America Radiation Induced Myelosuppression Treatment Market Size (US$ Mn) Analysis 2013-2021 and Forecast 2022-2028, By Country

Table 3: North America Radiation Induced Myelosuppression Treatment Market Size (US$ Mn) Analysis 2013-2021 and Forecast 2022-2028, By Drug Class

Table 4: North America Radiation Induced Myelosuppression Treatment Market Size (US$ Mn) Analysis 2013-2021 and Forecast 2022-2028, By Route of Administration

Table 5: North America Radiation Induced Myelosuppression Treatment Market Size (US$ Mn) Analysis 2013-2021 and Forecast 2022-2028, By Indication

Table 6: North America Radiation Induced Myelosuppression Treatment Market Size (US$ Mn) Analysis 2013-2021 and Forecast 2022-2028, By Distribution Channel

Table 7: Latin America Radiation Induced Myelosuppression Treatment Market Size (US$ Mn) Analysis 2013-2021 and Forecast 2022-2028, By Country

Table 8: Latin America Radiation Induced Myelosuppression Treatment Market Size (US$ Mn) Analysis 2013-2021 and Forecast 2022-2028, By Drug Class

Table 9: Latin America Radiation Induced Myelosuppression Treatment Market Size (US$ Mn) Analysis 2013-2021 and Forecast 2022-2028, By Route of Administration

Table 10:Latin America Radiation Induced Myelosuppression Treatment Market Size (US$ Mn) Analysis 2013-2021 and Forecast 2022-2028, By Indication

Table 11:Latin America Radiation Induced Myelosuppression Treatment Market Size (US$ Mn) Analysis 2013-2021 and Forecast 2022-2028, By Distribution Channel

Table 12:Western Europe Radiation Induced Myelosuppression Treatment Market Size (US$ Mn) Analysis 2013-2021 and Forecast 2022-2028, By Country

Table 13:Western Europe Radiation Induced Myelosuppression Treatment Market Size (US$ Mn) Analysis 2013-2021 and Forecast 2022-2028, By Drug Class

Table 14:Western Europe Radiation Induced Myelosuppression Treatment Market Size (US$ Mn) Analysis 2013-2021 and Forecast 2022-2028, By Route of Administration

Table 15:Western Europe Radiation Induced Myelosuppression Treatment Market Size (US$ Mn) Analysis 2013-2021 and Forecast 2022-2028, By Indication

Table 16:Western Europe Radiation Induced Myelosuppression Treatment Market Size (US$ Mn) Analysis 2013-2021 and Forecast 2022-2028, By Distribution Channel

Table 17:Eastern Europe Radiation Induced Myelosuppression Treatment Market Size (US$ Mn) Analysis 2013-2021 and Forecast 2022-2028, By Country

Table 18:Eastern Europe Radiation Induced Myelosuppression Treatment Market Size (US$ Mn) Analysis 2013-2021 and Forecast 2022-2028, By Drug Class

Table 19:Eastern Europe Radiation Induced Myelosuppression Treatment Market Size (US$ Mn) Analysis 2013-2021 and Forecast 2022-2028, By Route of Administration

Table 20:Eastern Europe Radiation Induced Myelosuppression Treatment Market Size (US$ Mn) Analysis 2013-2021 and Forecast 2022-2028, By Indication

Table 21:Eastern Europe Radiation Induced Myelosuppression Treatment Market Size (US$ Mn) Analysis 2013-2021 and Forecast 2022-2028, By Distribution Channel

Table 22:APEJ Radiation Induced Myelosuppression Treatment Market Size (US$ Mn) Analysis 2013-2021 and Forecast 2022-2028, By Country

Table 23:APEJ Radiation Induced Myelosuppression Treatment Market Size (US$ Mn) Analysis 2013-2021 and Forecast 2022-2028, By Drug Class

Table 24:APEJ Radiation Induced Myelosuppression Treatment Market Size (US$ Mn) Analysis 2013-2021 and Forecast 2022-2028, By Route of Administration

Table 25:APEJ Radiation Induced Myelosuppression Treatment Market Size (US$ Mn) Analysis 2013-2021 and Forecast 2022-2028, By Indication

Table 26:APEJ Radiation Induced Myelosuppression Treatment Market Size (US$ Mn) Analysis 2013-2021 and Forecast 2022-2028, By Distribution Channel

Table 27:Japan Radiation Induced Myelosuppression Treatment Market Size (US$ Mn) Analysis 2013-2021 and Forecast 2022-2028, By Drug Class

Table 28:Japan Radiation Induced Myelosuppression Treatment Market Size (US$ Mn) Analysis 2013-2021 and Forecast 2022-2028, By Route of Administration

Table 29:Japan Radiation Induced Myelosuppression Treatment Market Size (US$ Mn) Analysis 2013-2021 and Forecast 2022-2028, By Indication

Table 30:Japan Radiation Induced Myelosuppression Treatment Market Size (US$ Mn) Analysis 2013-2021 and Forecast 2022-2028, By Distribution Channel

Table 31:MEA Radiation Induced Myelosuppression Treatment Market Size (US$ Mn) Analysis 2013-2021 and Forecast 2022-2028, By Country

Table 32:MEA Radiation Induced Myelosuppression Treatment Market Size (US$ Mn) Analysis 2013-2021 and Forecast 2022-2028, By Drug Class

Table 33:MEA Radiation Induced Myelosuppression Treatment Market Size (US$ Mn) Analysis 2013-2021 and Forecast 2022-2028, By Route of Administration

Table 34:MEA Radiation Induced Myelosuppression Treatment Market Size (US$ Mn) Analysis 2013-2021 and Forecast 2022-2028, By Indication

Table 35:MEA Radiation Induced Myelosuppression Treatment Market Size (US$ Mn) Analysis 2013-2021 and Forecast 2022-2028, By Distribution Channel

Table 36:Global Radiation Induced Myelosuppression Treatment Market Size (US$ Mn) Analysis 2013-2021 and Forecast 2022-2028, By Region

Table 37:Global Radiation Induced Myelosuppression Treatment Market Size (US$ Mn) Analysis 2013-2021 and Forecast 2022-2028, By Indication

Table 38:Global Radiation Induced Myelosuppression Treatment Market Size (US$ Mn) Analysis 2013-2021 and Forecast 2022-2028, By Route of Administration

Table 39:Global Radiation Induced Myelosuppression Treatment Market Size (US$ Mn) Analysis 2013-2021 and Forecast 2022-2028, By Distribution Channe

List of Figures

Figure 01: Clinical Programs for Radiation Induced Myelosuppression Treatment, by Indication

Figure 02: Clinical Programs for Radiation Induced Myelosuppression Treatment, by Phase

Figure 03: Global Radiation Induced Myelosuppression Treatment Market Absolute $ Opportunity, 2013–2028

Figure 04: Global Radiation Induced Myelosuppression Treatment Market Size (US$ Mn) Analysis, 2013–2021

Figure 05: Global Radiation Induced Myelosuppression Treatment Market Size (US$ Mn) & Y-o-Y Growth (%), 2022–2028

Figure 06: North America Radiation Induced Myelosuppression Treatment Market Size (US$ Mn) Analysis, 2013–2021

Figure 07: North America Radiation Induced Myelosuppression Treatment Market Size (US$ Mn) & Y-o-Y Growth (%), 2022–2028

Figure 08: North America Radiation Induced Myelosuppression Treatment Market Analysis by Country –2022 & 2028

Figure 09: North America Radiation Induced Myelosuppression Treatment Market Y-o-Y Growth Projections by Country, 2022 – 2028

Figure 10: North America Radiation Induced Myelosuppression Treatment Market Attractiveness Analysis by Country, 2022 – 2028

Figure 11: North America Radiation Induced Myelosuppression Treatment Market Analysis by Type–2022 & 2028

Figure 12: North America Radiation Induced Myelosuppression Treatment Market Y-o-Y Growth Projections by Type, 2022 – 2028

Figure 13: North America Radiation Induced Myelosuppression Treatment Market Attractiveness Analysis by Type, 2022 – 2028

Figure 14: North America Radiation Induced Myelosuppression Treatment Market Analysis by Indication – 2022 & 2028

Figure 15: North America Radiation Induced Myelosuppression Treatment Market Y-o-Y Growth Projections by Indication, 2022 – 2028

Figure 16: North America Radiation Induced Myelosuppression Treatment Market Attractiveness Analysis by Indication, 2022 – 2028

Figure 17: North America Radiation Induced Myelosuppression Treatment Market Analysis by Indication – 2022 & 2028

Figure 18: North America Radiation Induced Myelosuppression Treatment Market Y-o-Y Growth Projections by Indication, 2022 – 2028

Figure 19: North America Radiation Induced Myelosuppression Treatment Market Attractiveness Analysis by Indication, 2022 – 2028

Figure 20: North America Radiation Induced Myelosuppression Treatment Market Analysis by Distribution Channel – 2022 & 2028

Figure 21: North America Radiation Induced Myelosuppression Treatment Market Y-o-Y Growth Projections by Distribution Channel, 2022 – 2028

Figure 22: North America Radiation Induced Myelosuppression Treatment Market Attractiveness Analysis by Distribution Channel, 2022 – 2028

Figure 23: Latin America Radiation Induced Myelosuppression Treatment Market Size (US$ Mn) Analysis, 2013–2021

Figure 24: Latin America Radiation Induced Myelosuppression Treatment Market Size (US$ Mn) & Y-o-Y Growth (%), 2022–2028

Figure 25: Latin America Radiation Induced Myelosuppression Treatment Market Analysis by Country –2022 & 2028

Figure 26: Latin America Radiation Induced Myelosuppression Treatment Market Y-o-Y Growth Projections by Country, 2022 – 2028

Figure 27: Latin America Radiation Induced Myelosuppression Treatment Market Attractiveness Analysis by Country, 2022 – 2028

Figure 28: Latin America Radiation Induced Myelosuppression Treatment Market Analysis by Type–2022 & 2028

Figure 29: Latin America Radiation Induced Myelosuppression Treatment Market Y-o-Y Growth Projections by Type, 2022 – 2028

Figure 30: Latin America Radiation Induced Myelosuppression Treatment Market Attractiveness Analysis by Type, 2022 – 2028

Figure 31: Latin America Radiation Induced Myelosuppression Treatment Market Analysis by Indication – 2022 & 2028

Figure 32: Latin America Radiation Induced Myelosuppression Treatment Market Y-o-Y Growth Projections by Indication, 2022 – 2028

Figure 33: Latin America Radiation Induced Myelosuppression Treatment Market Attractiveness Analysis by Indication, 2022 – 2028

Figure 34: Latin America Radiation Induced Myelosuppression Treatment Market Analysis by Indication – 2022 & 2028

Figure 35: Latin America Radiation Induced Myelosuppression Treatment Market Y-o-Y Growth Projections by Indication, 2022 – 2028

Figure 36: Latin America Radiation Induced Myelosuppression Treatment Market Attractiveness Analysis by Indication, 2022 – 2028

Figure 37: Latin America Radiation Induced Myelosuppression Treatment Market Analysis by Distribution Channel – 2022 & 2028

Figure 38: Latin America Radiation Induced Myelosuppression Treatment Market Y-o-Y Growth Projections by Distribution Channel, 2022 – 2028

Figure 39: Latin America Radiation Induced Myelosuppression Treatment Market Attractiveness Analysis by Distribution Channel, 2022 – 2028

Figure 40: Western Europe Radiation Induced Myelosuppression Treatment Market Size (US$ Mn) Analysis, 2013–2021

Figure 41: Western Europe Radiation Induced Myelosuppression Treatment Market Size (US$ Mn) & Y-o-Y Growth (%), 2022–2028

Figure 42: Western Europe Radiation Induced Myelosuppression Treatment Market Analysis by Country –2022 & 2028

Figure 43: Western Europe Radiation Induced Myelosuppression Treatment Market Y-o-Y Growth Projections by Country, 2022 – 2028

Figure 44: Western Europe Radiation Induced Myelosuppression Treatment Market Attractiveness Analysis by Country, 2022 – 2028

Figure 45: Western Europe Radiation Induced Myelosuppression Treatment Market Analysis by Type–2022 & 2028

Figure 46: Western Europe Radiation Induced Myelosuppression Treatment Market Y-o-Y Growth Projections by Type, 2022 – 2028

Figure 47: Western Europe Radiation Induced Myelosuppression Treatment Market Attractiveness Analysis by Type, 2022 – 2028

Figure 48: Western Europe Radiation Induced Myelosuppression Treatment Market Analysis by Indication – 2022 & 2028

Figure 49: Western Europe Radiation Induced Myelosuppression Treatment Market Y-o-Y Growth Projections by Indication, 2022 – 2028

Figure 50: Western Europe Radiation Induced Myelosuppression Treatment Market Attractiveness Analysis by Indication, 2022 – 2028

Figure 51: Western Europe Radiation Induced Myelosuppression Treatment Market Analysis by Indication – 2022 & 2028

Figure 52: Western Europe Radiation Induced Myelosuppression Treatment Market Y-o-Y Growth Projections by Indication, 2022 – 2028

Figure 53: Western Europe Radiation Induced Myelosuppression Treatment Market Attractiveness Analysis by Indication, 2022 – 2028

Figure 54: Western Europe Radiation Induced Myelosuppression Treatment Market Analysis by Distribution Channel – 2022 & 2028

Figure 55: Western Europe Radiation Induced Myelosuppression Treatment Market Y-o-Y Growth Projections by Distribution Channel, 2022 – 2028

Figure 56: Western Europe Radiation Induced Myelosuppression Treatment Market Attractiveness Analysis by Distribution Channel, 2022 – 2028

Figure 57: Eastern Europe Radiation Induced Myelosuppression Treatment Market Size (US$ Mn) Analysis, 2013–2021

Figure 58: Eastern Europe Radiation Induced Myelosuppression Treatment Market Size (US$ Mn) & Y-o-Y Growth (%), 2022–2028

Figure 59: Eastern Europe Radiation Induced Myelosuppression Treatment Market Analysis by Country –2022 & 2028

Figure 60: Eastern Europe Radiation Induced Myelosuppression Treatment Market Y-o-Y Growth Projections by Country, 2022 – 2028

Figure 61: Eastern Europe Radiation Induced Myelosuppression Treatment Market Attractiveness Analysis by Country, 2022 – 2028

Figure 62: Eastern Europe Radiation Induced Myelosuppression Treatment Market Analysis by Type–2022 & 2028

Figure 63: Eastern Europe Radiation Induced Myelosuppression Treatment Market Y-o-Y Growth Projections by Type, 2022 – 2028

Figure 64: Eastern Europe Radiation Induced Myelosuppression Treatment Market Attractiveness Analysis by Type, 2022 – 2028

Figure 65: Eastern Europe Radiation Induced Myelosuppression Treatment Market Analysis by Indication – 2022 & 2028

Figure 66: Eastern Europe Radiation Induced Myelosuppression Treatment Market Y-o-Y Growth Projections by Indication, 2022 – 2028

Figure 67: Eastern Europe Radiation Induced Myelosuppression Treatment Market Attractiveness Analysis by Indication, 2022 – 2028

Figure 68: Eastern Europe Radiation Induced Myelosuppression Treatment Market Analysis by Indication – 2022 & 2028

Figure 69: Eastern Europe Radiation Induced Myelosuppression Treatment Market Y-o-Y Growth Projections by Indication, 2022 – 2028

Figure 70: Eastern Europe Radiation Induced Myelosuppression Treatment Market Attractiveness Analysis by Indication, 2022 – 2028

Figure 71: Eastern Europe Radiation Induced Myelosuppression Treatment Market Analysis by Distribution Channel – 2022 & 2028

Figure 72: Eastern Europe Radiation Induced Myelosuppression Treatment Market Y-o-Y Growth Projections by Distribution Channel, 2022 – 2028

Figure 73: Eastern Europe Radiation Induced Myelosuppression Treatment Market Attractiveness Analysis by Distribution Channel, 2022 – 2028

Figure 74: APEJ Radiation Induced Myelosuppression Treatment Market Size (US$ Mn) Analysis, 2013–2021

Figure 75: APEJ Radiation Induced Myelosuppression Treatment Market Size (US$ Mn) & Y-o-Y Growth (%), 2022–2028

Figure 76: APEJ Radiation Induced Myelosuppression Treatment Market Analysis by Country –2022 & 2028

Figure 77: APEJ Radiation Induced Myelosuppression Treatment Market Y-o-Y Growth Projections by Country, 2022 – 2028

Figure 78: APEJ Radiation Induced Myelosuppression Treatment Market Attractiveness Analysis by Country, 2022 – 2028

Figure 79: APEJ Radiation Induced Myelosuppression Treatment Market Analysis by Type–2022 & 2028

Figure 80: APEJ Radiation Induced Myelosuppression Treatment Market Y-o-Y Growth Projections by Type, 2022 – 2028

Figure 81: APEJ Radiation Induced Myelosuppression Treatment Market Attractiveness Analysis by Type, 2022 – 2028

Figure 82: APEJ Radiation Induced Myelosuppression Treatment Market Analysis by Indication – 2022 & 2028

Figure 83: APEJ Radiation Induced Myelosuppression Treatment Market Y-o-Y Growth Projections by Indication, 2022 – 2028

Figure 84: APEJ Radiation Induced Myelosuppression Treatment Market Attractiveness Analysis by Indication, 2022 – 2028

Figure 85: APEJ Radiation Induced Myelosuppression Treatment Market Analysis by Indication – 2022 & 2028

Figure 86: APEJ Radiation Induced Myelosuppression Treatment Market Y-o-Y Growth Projections by Indication, 2022 – 2028

Figure 87: APEJ Radiation Induced Myelosuppression Treatment Market Attractiveness Analysis by Indication, 2022 – 2028

Figure 88: APEJ Radiation Induced Myelosuppression Treatment Market Analysis by Distribution Channel – 2022 & 2028

Figure 89: APEJ Radiation Induced Myelosuppression Treatment Market Y-o-Y Growth Projections by Distribution Channel, 2022 – 2028

Figure 90: APEJ Radiation Induced Myelosuppression Treatment Market Attractiveness Analysis by Distribution Channel, 2022 – 2028

Figure 91: Japan Radiation Induced Myelosuppression Treatment Market Size (US$ Mn) Analysis, 2013–2021

Figure 92: Japan Radiation Induced Myelosuppression Treatment Market Size (US$ Mn) & Y-o-Y Growth (%), 2022–2028

Figure 93: Japan Radiation Induced Myelosuppression Treatment Market Analysis by Type–2022 & 2028

Figure 94: Japan Radiation Induced Myelosuppression Treatment Market Y-o-Y Growth Projections by Type, 2022 – 2028

Figure 95: Japan Radiation Induced Myelosuppression Treatment Market Attractiveness Analysis by Type, 2022 – 2028

Figure 96: Japan Radiation Induced Myelosuppression Treatment Market Analysis by Indication – 2022 & 2028

Figure 97: Japan Radiation Induced Myelosuppression Treatment Market Y-o-Y Growth Projections by Indication, 2022 – 2028

Figure 98: Japan Radiation Induced Myelosuppression Treatment Market Attractiveness Analysis by Indication, 2022 – 2028

Figure 99: Japan Radiation Induced Myelosuppression Treatment Market Analysis by Indication – 2022 & 2028

Figure 100:Japan Radiation Induced Myelosuppression Treatment Market Y-o-Y Growth Projections by Indication, 2022 – 2028

Figure 101:Japan Radiation Induced Myelosuppression Treatment Market Attractiveness Analysis by Indication, 2022 – 2028

Figure 102:Japan Radiation Induced Myelosuppression Treatment Market Analysis by Distribution Channel – 2022 & 2028

Figure 103:Japan Radiation Induced Myelosuppression Treatment Market Y-o-Y Growth Projections by Distribution Channel, 2022 – 2028

Figure 104:Japan Radiation Induced Myelosuppression Treatment Market Attractiveness Analysis by Distribution Channel, 2022 – 2028

Figure 105:MEA Radiation Induced Myelosuppression Treatment Market Size (US$ Mn) Analysis, 2013–2021

Figure 106:MEA Radiation Induced Myelosuppression Treatment Market Size (US$ Mn) & Y-o-Y Growth (%), 2022–2028

Figure 107:MEA Radiation Induced Myelosuppression Treatment Market Analysis by Country –2022 & 2028

Figure 108:MEA Radiation Induced Myelosuppression Treatment Market Y-o-Y Growth Projections by Country, 2022 – 2028

Figure 109:MEA Radiation Induced Myelosuppression Treatment Market Attractiveness Analysis by Country, 2022 – 2028

Figure 110:MEA Radiation Induced Myelosuppression Treatment Market Analysis by Type–2022 & 2028

Figure 111:MEA Radiation Induced Myelosuppression Treatment Market Y-o-Y Growth Projections by Type, 2022 – 2028

Figure 112:MEA Radiation Induced Myelosuppression Treatment Market Attractiveness Analysis by Type, 2022 – 2028

Figure 113:MEA Radiation Induced Myelosuppression Treatment Market Analysis by Indication – 2022 & 2028

Figure 114:MEA Radiation Induced Myelosuppression Treatment Market Y-o-Y Growth Projections by Indication, 2022 – 2028

Figure 115:MEA Radiation Induced Myelosuppression Treatment Market Attractiveness Analysis by Indication, 2022 – 2028

Figure 116:MEA Radiation Induced Myelosuppression Treatment Market Analysis by Indication – 2022 & 2028

Figure 117:MEA Radiation Induced Myelosuppression Treatment Market Y-o-Y Growth Projections by Indication, 2022 – 2028

Figure 118:MEA Radiation Induced Myelosuppression Treatment Market Attractiveness Analysis by Indication, 2022 – 2028

Figure 119:MEA Radiation Induced Myelosuppression Treatment Market Analysis by Distribution Channel – 2022 & 2028

Figure 120:MEA Radiation Induced Myelosuppression Treatment Market Y-o-Y Growth Projections by Distribution Channel, 2022 – 2028

Figure 121:MEA Radiation Induced Myelosuppression Treatment Market Attractiveness Analysis by Distribution Channel, 2022 – 2028

Figure 122:Global Radiation Induced Myelosuppression Treatment Market Analysis by Region –2022 & 2028

Figure 123:Global Radiation Induced Myelosuppression Treatment Market Y-o-Y Growth Projections by Region, 2022 – 2028

Figure 124:Global Radiation Induced Myelosuppression Treatment Market Size (US$ Mn) Analysis 2013-2021 and Forecast 2022-2028, By Region

Figure 125:Global Radiation Induced Myelosuppression Treatment Market Analysis by Indication–2022 & 2028

Figure 126:Global Radiation Induced Myelosuppression Treatment Market Y-o-Y Growth Projections by Indication, 2022 – 2028

Figure 127:Global Radiation Induced Myelosuppression Treatment Market Size (US$ Mn) Analysis 2013-2021 and Forecast 2022-2028, By Indication

Figure 128:Global Radiation Induced Myelosuppression Treatment Market Analysis by Route of Administration –2022 & 2028

Figure 129:Global Radiation Induced Myelosuppression Treatment Market Y-o-Y Growth Projections by Route of Administration, 2022 – 2028

Figure 130:Global Radiation Induced Myelosuppression Treatment Market Size (US$ Mn) Analysis 2013-2021 and Forecast 2022-2028, By Route of Administration

Figure 131:Global Radiation Induced Myelosuppression Treatment Market Analysis by Distribution Channel–2022 & 2028

Figure 132:Global Radiation Induced Myelosuppression Treatment Market Y-o-Y Growth Projections by Distribution Channel, 2022 – 2028

Figure 133:Global Radiation Induced Myelosuppression Treatment Market Size (US$ Mn) Analysis 2013-2021 and Forecast 2022-2028, By Distribution Channel

Frequently Asked Questions

What is the global radiation-induced myelosuppression treatment market size?

The global radiation-induced myelosuppression treatment market is expected to reach a valuation of USD 2.9 Billion in 2022.

At what rate did the global radiation-induced myelosuppression treatment market grow between 2013 and 2021?

The global Radiation-induced myelosuppression treatment market grew at a 3.4% CAGR between 2013 and 2021.

What are the key trends boosting radiation-induced myelosuppression treatment sales?

Increasing preference for non-invasive drug administration, along with the introduction of intravenous iron therapy are key trends driving radiation-induced myelosuppression treatment sales.

What is the North America radiation-induced myelosuppression treatment market outlook?

North America is projected to account for a dominant share of the global radiation-induced myelosuppression treatment market share during the forecast period.

What is the market share of the Europe Radiation-induced myelosuppression treatment market?

The radiation-induced myelosuppression treatment market in Europe is anticipated to expand at a considerable pace over the assessment period.

Explore Similar Insights

Future Market Insights

Radiation-Induced Myelosuppression Treatment Market