Ready to Drink Coffee Market Forecast and Outlook 2025 to 2035

The ready-to-drink (RTD) coffee market is estimated to be valued at USD 38.5 billion in 2025 and is projected to reach USD 57.5 billion by 2035, registering a compound annual growth rate (CAGR) of 4.1% over the forecast period. The market is projected to add an absolute dollar opportunity of USD 19.0 billion over the forecast period. This reflects a 1.49 times growth at a compound annual growth rate of 4.1%.
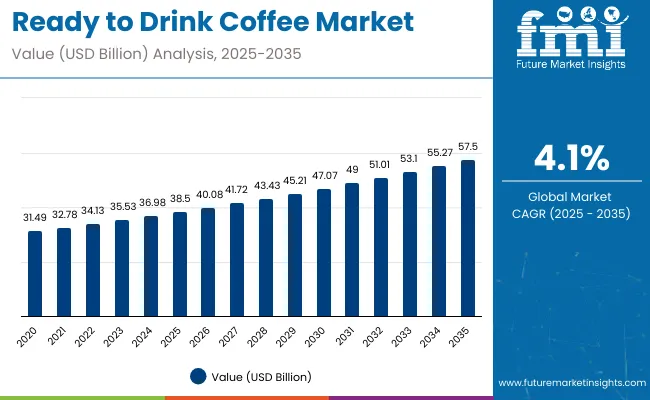
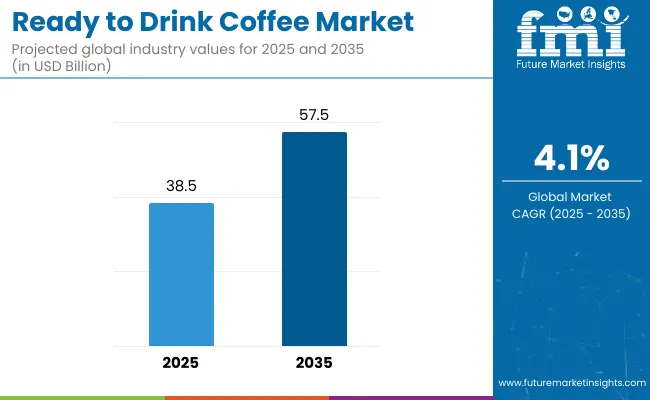
Ready To Drink Coffee Market Value Analysis

Quick Stats for Ready to Drink Coffee Market

  • Ready to Drink Coffee Market Value (2025): USD 38.5 billion
  • Ready to Drink Coffee Market Forecast Value (2035): USD 57.5 billion
  • Ready to Drink Coffee Market Forecast CAGR (2025 to 2035): 4.1%
  • Leading Segment in Ready to Drink Coffee Market 2025: Regular (95% share)
  • Key Growth Regions in Ready to Drink Coffee Market: Asia Pacific and Western Europe
  • Top Players in Ready to Drink Coffee Market: Nestlé, The Coca-Cola Company, PepsiCo, Unilever, Suntory Holdings Limited

Ready To Drink Coffee Market

Metric Value
Market Value (2025) USD 38.5 billion
Forecast Market Value (2035) USD 57.5 billion
CAGR (2025 to 2035) 4.1%

The market’s evolution is expected to be shaped by increasing consumer demand for convenient, on-the-go beverages, rising popularity of cold brew and functional coffee variants, and expanding distribution through e-commerce and modern retail channels, particularly in urban and health-conscious consumer segments.

By 2030, the market is projected to reach approximately USD 47.1 billion, reflecting steady mid-term growth supported by expanding espresso-based offerings and sustained demand for regular caffeinated products. The growth trajectory is backed by health-conscious consumer trends and sustainability initiatives among leading companies.

From 2025 to 2035, the RTD coffee sector is projected to achieve an absolute growth of USD 19.0 billion, underscoring consistent consumer preference for on-the-go coffee options and incremental innovations that enhance taste, packaging, and functional benefits globally.

Leading companies such as Nestlé, The Coca-Cola Company, PepsiCo, Unilever, and Suntory Holdings Limited are consolidating their positions by expanding product portfolios and advancing next-generation Ready to Drink (RTD) coffee innovations.

Their focus includes developing specialty coffee blends, functional ingredients like added protein and probiotics, and sustainable packaging solutions that cater to evolving consumer preferences. Through investments in research, brand building, and global distribution networks, these players are enhancing market penetration across both established and emerging economies.

The market holds a critical position in the global beverage sector, driven by consumer demand for convenient, on-the-go, and health-oriented coffee options. Espresso-based products, commanding 37% of the market share, remain central to consumer appeal due to their robust flavor and caffeine content. Regular (caffeinated) coffee dominates the caffeine segment with a 95% share, supported by widespread consumer acceptance and its energy-boosting benefits.

The market is evolving with innovations such as cold brew and nitro coffee variants, plant-based and sugar-free options, and advanced brewing technologies that enhance flavor and nutritional profiles. Companies are strengthening their portfolios with premium, organic, and ethically sourced offerings aimed at health-conscious millennials and Gen Z consumers. Strategic collaborations with retailers, e-commerce platforms, and sustainability initiatives are reshaping accessibility and positioning RTD coffee as a staple in modern consumer lifestyles worldwide.

Why is the Ready to Drink Coffee Market Growing?

The ready to drink (RTD) coffee market is experiencing significant growth due to multiple converging factors that cater to evolving consumer lifestyles and preferences. A primary driver is the increasing demand for convenience among busy consumers who seek quick, on-the-go beverage options without compromising quality or flavor. RTD coffee offers a portable, ready-to-consume solution that aligns perfectly with fast-paced urban living.

Health consciousness is another critical growth factor. Consumers are gravitating towards functional beverages that not only energize but also offer added health benefits, such as probiotics, antioxidants, and plant-based ingredients. Manufacturers are innovating by incorporating these functional components, appealing to millennials and Gen Z, who prioritize wellness and clean-label products.

Flavor diversification and premiumization also boost the market. Specialty coffee varieties, such as espresso-based drinks, cold brews, and nitro coffee, enhance consumer experience with richer taste profiles, attracting coffee connoisseurs and casual drinkers alike. Additionally, sustainability efforts through eco-friendly packaging and ethically sourced ingredients resonate with environmentally aware consumers, increasing brand loyalty.

Ready to Drink Coffee Market Analysis by Top Investment Segments

The market is segmented by coffee variety, caffeine content, packaging type, sales channel, flavor, and region. By coffee variety, the market is divided into black coffee, espresso-based, specialty coffees, and coffee concentrates. Based on caffeine content, the market is regular and decaffeinated. In terms of packaging type, the market is divided into glass bottles, cans, plastic bottles, pouches, and others (tetra packs, cartons, and sachets).

By sales channel, the market is segmented into food service, physical retail, travel retail, and online retail. Based on flavor, the market is classified into unflavoured/classic/original and flavoured varieties such as vanilla, hazelnut, caramel, chocolate, and others (mocha, caramel mocha, seasonal blends). Regionally, the market is divided into North America, Latin America, Western Europe, Eastern Europe, Balkans & Baltic, Russia & Belarus, Central Asia, East Asia, South Asia & Pacific, and Middle East & Africa.
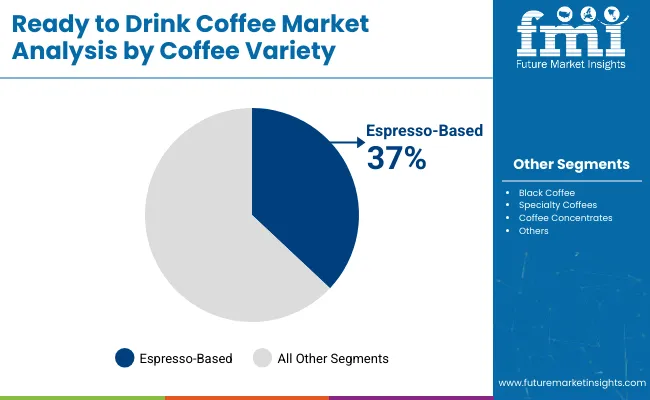
By Coffee Variety, Espresso-Based Accounts for 37% Market Share

Ready To Drink Coffee Market Coffee Variety

The most lucrative segment in the market by coffee variety is the espresso-based segment, commanding a substantial market share of 37% as of 2025. The espresso-based segment’s dominance is driven by its strong, rich flavor profile and higher caffeine content, which appeals to both traditional coffee enthusiasts and younger, urban consumers seeking a quick energy boost. The versatility of espresso as a base allows for numerous product innovations, including lattes, mochas, and specialty blends, enabling brands to offer differentiated and premium options that command higher price points.

Consumer trends toward premiumization and specialty coffee consumption have accelerated growth in this segment, with increasing interest in authentic café-style experiences accessible conveniently through bottled or canned deliveries. Moreover, rising disposable incomes and expanding coffee cultures in emerging markets such as India and China further amplify demand. The combination of product diversity, strong consumer preference, and adaptability for functional enhancements like added protein or probiotics positions espresso-based RTD coffee as the most lucrative and fast-growing segment within the global RTD coffee market.
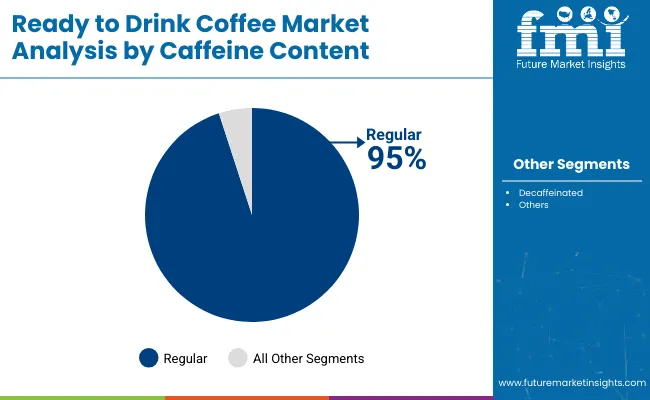
By Caffeine Content, Regular (Caffeinated) Segment Accounts for 95% Market Share

Ready To Drink Coffee Market By Caffeine Content

The regular (caffeinated) segment is the cornerstone of the market, commanding an overwhelming majority with 95% market share as of 2025. This segment’s dominance stems from the global consumer preference for caffeine as a stimulant that enhances alertness and energy, making it a staple in daily beverage consumption patterns worldwide. Regular RTD coffee is widely accepted across diverse demographic groups, from working professionals needing a quick energy boost to young consumers valuing convenience and flavor variety.

The segment benefits from a vast and versatile product range that spans classic black coffee, espresso-based drinks, specialty blends, and functional beverages infused with additives like protein, antioxidants, and probiotics. This diversity allows brands to target multiple consumer niches and price points, boosting both volume and revenue. Additionally, regular RTD coffee is favored for its strong sensory appeal, robust aroma, rich taste, and varied intensity levels, which consumers perceive as authentic and satisfying.

What are the Drivers, Restraints, and Key Trends of the Ready to Drink Coffee Market?

The ready to drink (RTD) coffee market from 2025 to 2035 will be driven by increasing consumer demand for convenient, premium coffee options, rising urbanization, and expanding retail and e-commerce infrastructure globally. Product innovations such as cold brew, nitro coffee, and functional blends with added protein or probiotics are enhancing appeal and boosting market penetration. Growing health consciousness and sustainability awareness among consumers are influencing product development and packaging innovations, further encouraging market growth, particularly in emerging regions like India and China.

Health Awareness and Functional Innovation Boost Ready to Drink Coffee Market Growth

Increasing awareness about health and wellness among consumers is a significant driver of the RTD coffee market. Consumers seek products that offer not only energy but also functional benefits such as antioxidants, digestive health support, and reduced sugar content. The rise of specialty coffee variants and authentic café experiences in ready-to-drink formats caters to evolving tastes. The increasing popularity of premium, organic, and ethically sourced products aligns with shifting consumer preferences, supporting sustained market expansion.

Innovation and Sustainability Expanding Ready to Drink Coffee Market Opportunities

Innovation in RTD coffee technology is broadening market opportunities across product segments. Developments include unique flavor infusions, plant-based milk alternatives, and eco-friendly packaging solutions that attract environmentally conscious buyers. Smart packaging that preserves freshness and promotes transparency on ingredient sourcing appeals to health-savvy consumers. Manufacturers prioritize sustainable sourcing, fair-trade certifications, and waste reduction to reinforce brand loyalty and comply with evolving regulatory standards, positioning the market for continued growth globally.
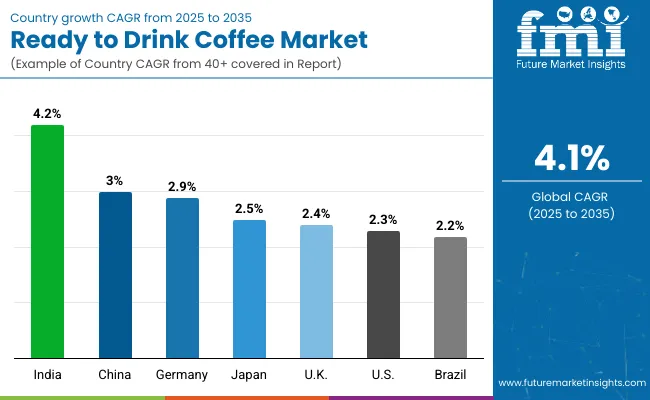
Ready to Drink Coffee Market Analysis by Key Countries

Ready To Drink Coffee Market Country Wise Analysis

Country CAGR (%)
India 4.2
China 3.0
Germany 2.9
Japan 2.5
United Kingdom 2.4
United States 2.3
Brazil 2.2

The ready to drink coffee market shows diverse growth rates globally. India leads with a strong CAGR of 4.2%, driven by urbanization, rising incomes, and a growing coffee culture favoring premium RTD products. China follows at 3.0% CAGR, boosted by expanding café culture and retail networks. Germany grows at 2.9%, with health-conscious consumers prioritizing organic and sustainable options.

Japan and the UK have similar CAGRs around 2.4-2.5%, focusing on high-quality and ethical products. The USA and Brazil show moderate growth at 2.3% and 2.2%, balancing established consumption with evolving preferences. Emerging markets lead growth; mature markets emphasize innovation.

The report covers an in-depth analysis of 40+ countries; seven top-performing OECD countries are highlighted below.

Output Expansion in Ready to Drink Coffee Market in India

Revenue from ready to drink coffee in India is projected to expand rapidly at a CAGR of 4.2%, led by rising urbanization and an evolving coffee culture shifting from traditional tea. Increasing disposable incomes and a youthful population are driving demand for convenient, premium espresso-based and flavored RTD coffee products. Localized flavor innovations and strategic retail and e-commerce expansion are further fueling growth.

The surge in health awareness encourages functional blends with added benefits like protein and probiotics. Aggressive marketing by global brands tailored to Indian preferences strengthens consumer engagement. The convenience lifestyle and digital adoption showcase sustained demand in urban and semi-urban regions. India emerges as a pivotal growth engine, shaping the future trajectory of the RTD Coffee Market.

  • Growing middle-class preference for convenient, on-the-go coffee options.
  • Increasing influence of western-style coffee culture and café experiences.
  • Expansion of modern retail formats and digital sales platforms.

Structural Adoption in Ready to Drink Coffee Market in Germany

Revenue from ready to drink coffee in Germany maintains steady growth with a CAGR of 2.9%, shaped by health-conscious consumers prioritizing sugar-free, organic, and plant-based options. Premium and specialty coffee varieties gain increasing traction thanks to strong consumer demand for transparency and sustainability. Rigorous food safety regulations drive companies to innovate around clean labels and ethical sourcing.

The market benefits from a robust retail presence, with specialty coffee drinks widely available in modern grocery chains and cafés. Eco-friendly packaging adoption is reshaping consumer perceptions and brand loyalty. Germany exemplifies a mature market focusing on product quality and environmental responsibility within the global RTD Coffee space.

  • Preference for sugar-free and vegan RTD coffee options.
  • Consumer demand for certified organic and fair-trade products.
  • Innovative product launches targeting health-focused consumers.

Output Expansion in Ready to Drink Coffee Market in the United States

Revenue from ready to drink coffee in the United States grows at a CAGR of 2.3%, propelled by evolving consumer preferences for convenience and wellness. Cold brew, nitro coffee, and functional beverages augmented with probiotics and protein dominate new product launches. Omni-channel retailing seamlessly blends physical stores and e-commerce platforms, enabling broader consumer reach.

Millennials and Gen Z consumers drive demand for bold, innovative flavor profiles and health-oriented products. Digital marketing and loyalty programs enhance brand interaction and retention. The USA market reflects a dynamic landscape where tradition meets innovation, setting benchmarks for RTD coffee consumption globally.

  • High consumption of cold brew and nitro RTD coffee variants.
  • Growing functional beverage segment with added protein and probiotics.
  • Increasing penetration of online retail channels.

Output Expansion in Ready to Drink Coffee Market in China

Demand for ready to drink coffee in China is rapidly evolving with a CAGR of 3.0%, fueled by urban lifestyle shifts and growing coffee culture adoption. Rising disposable incomes and increasing café culture exposure elevate demand for premium and specialty RTD coffees. Expanding modern retail and convenience store networks alongside surging e-commerce sales boost accessibility.

Domestic players collaborate increasingly with international brands to capture varied consumer preferences and regional tastes. Health-consciousness and functional product interest are growing trends. China represents a fast-growing market significantly contributing to the global RTD Coffee Market expansion.

  • Expansion of modern retail and convenience store networks.
  • Increased coffee consumption substituting traditional teas.
  • Growing demand for premium and specialty RTD coffees.

Structural Adoption in Ready to Drink Coffee Market in Japan

Demand for ready to drink coffee in Japan is projected to grow steadily at a CAGR of 2.5%, dominated by canned RTD coffee products that blend convenience with high-quality flavors. Consumer trends emphasize sugar-free, low-calorie, and functional beverages that cater to health-conscious buyers. Packaging innovations focus on portability and product freshness.

The segment enjoys strong support from domestic brands blended with international influences. Unique regional flavor profiles and premium blends maintain consumer interest. Japan epitomizes a mature market balancing tradition with innovation in RTD coffee consumption.

  • Dominance of canned coffee products in convenience stores.
  • Trend towards sugar-free and low-calorie beverage options.
  • Strong presence of domestic brands in RTD coffee segment.

Structural Adoption in Ready to Drink Coffee Market in the United Kingdom

Demand for ready to drink coffee in the United Kingdom is expected to grow at a CAGR of 2.4%, driven by consumer demand for on-the-go coffee and premium ethical products. Increasing interest in plant-based and sustainably sourced coffee reinforces market differentiation. Retail expansion in convenience stores and supermarkets enhances product availability.

Consumers are willing to pay a premium for quality and sustainability. Marketing campaigns effectively target younger demographics emphasizing ethical consumption. The UK showcases steady progress in blending convenience with corporate social responsibility within RTD coffee.

  • Rising demand for ethically sourced and fair-trade coffee.
  • Growth in health-conscious and plant-based RTD coffee options.
  • Expansion of RTD coffee in convenience and grocery retail outlets.

Structural Adoption in Ready to Drink Coffee Market in Brazil

Revenue from ready to drink coffee in Brazil grows at a CAGR of 2.2%, powered by the integration of traditional coffee culture with convenient RTD formats. Urban middle-class consumers show rising preference for flavored and specialty coffee beverages aligning with local tastes.

Improvements in cold chain logistics and modern retail infrastructure enhance availability and freshness. International brands increase their presence while local players innovate with novel flavors. Brazil represents a transforming market balancing heritage with convenience and innovation within the RTD coffee landscape.
  • Integration of traditional coffee culture with RTD convenience products.
  • Rising popularity of flavored and specialty coffee beverages.
  • Improvements in cold chain supply and retail infrastructure.

Competitive Landscape of the Ready to Drink Coffee Market

Ready To Drink Coffee Market By Company

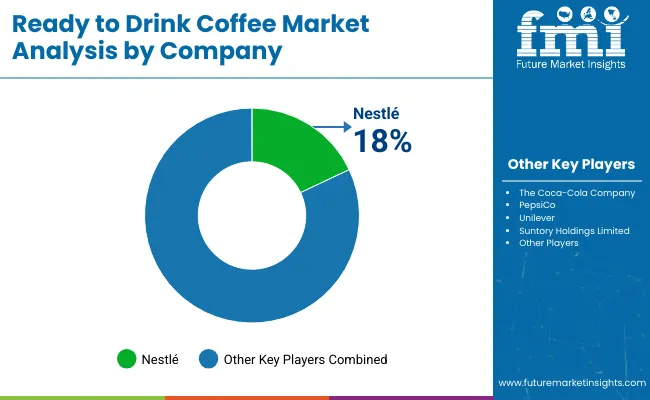
The market is characterized by intense rivalry among global and regional players striving to capture market share through innovation, branding, and expansive distribution networks. Leading companies such as Nestlé, The Coca-Cola Company, PepsiCo, Unilever, and Suntory Holdings Limited dominate the market with robust product portfolios that cater to diverse consumer preferences, including espresso-based blends, specialty coffees, and functional variants. These players invest heavily in research and development to introduce novel flavors, sustainable packaging, and health-oriented formulations, appealing to a growing base of health-conscious and environmentally aware consumers.

Emerging trends such as premiumization, organic certification, and clean-label products drive companies to differentiate their offerings. Additionally, strategic partnerships with retailers, e-commerce platforms, and local distributors enhance market penetration and geographic reach. Smaller and regional players compete by focusing on niche segments, localized flavors, and innovative marketing strategies targeting millennials and Gen Z consumers.

Scope of Report

Items Values
Quantitative Units (2025) USD 38.5 billion
Coffee Variety Black Coffee, Espresso-Based, Specialty Coffees, Coffee Concentrates
Caffeine Content Regular, Decaffeinated
Packaging Type Glass Bottles, Cans, Plastic Bottles, Pouches, Others (Tetra Packs, Cartons, Sachets)
Sales Channel Food Service, Physical Retail, Travel Retail, Online Retail
Flavor Unflavoured/Classic/Original, Flavoured (Vanilla, Hazelnut, Caramel, Chocolate, Others - Mocha, Seasonal Blends)
Regions Covered India, Germany, United States, China, Japan, United Kingdom, Brazil
Countries Covered India, Germany, United States, China, Japan, United Kingdom, Brazil, France, Canada, Australia, and 40+ countries
Key Companies Profiled PepsiCo., The Coca-Cola Company, Nestle S.A., JAB Holding Company, Asahi Group Holdings, Ltd., McDonald’s Corporation, Danone S.A., Suntory Beverage & Food, Lotte Chilsung Beverage Co. Ltd., Starbucks, Unilever, Monster Beverage Co.
Additional Attributes Revenue by coffee variety and packaging type; regional demand trends; competitive landscape; adoption of functional ingredients and sustainable packaging; e-commerce and retail expansion; specialty and premium blend innovation; consumer preference for health and wellness products

Key Segments

By Coffee Variety:

  • Black Coffee
  • Espresso-Based
  • Specialty Coffees
  • Coffee Concentrates

By Caffeine Content:

  • Regular
  • Decaffeinated

By Packaging Type:

  • Glass Bottle
  • Cans
  • Plastic Bottles
  • Pouches
  • Others (Tetra Packs, Cartons, Sachets)

By Sales Channel:

  • Food Service
  • Physical Retail
  • Travel Retail
  • Online Retail

By Flavour:

  • Unflavoured/Classic/Original
  • Vanilla
  • Hazelnut
  • Caramel
  • Chocolate
  • Others (Mocha, Seasonal Blends)

By Region:

  • North America
  • Latin America
  • Western Europe
  • Eastern Europe
  • East Asia
  • South Asia & Pacific
  • Middle East and Africa

Table of Content

  1. Executive Summary
    • Global Market Outlook
    • Demand-side Trends
    • Supply-side Trends
    • Technology Roadmap Analysis
    • Analysis and Recommendations
  2. Market Overview
    • Market Coverage / Taxonomy
    • Market Definition / Scope / Limitations
  3. Market Background
    • Market Dynamics
      • Drivers
      • Restraints
      • Opportunity
      • Trends
    • Scenario Forecast
      • Demand in Optimistic Scenario
      • Demand in Likely Scenario
      • Demand in Conservative Scenario
    • Opportunity Map Analysis
    • Product Life Cycle Analysis
    • Supply Chain Analysis
      • Supply Side Participants and their Roles
        • Producers
        • Mid-Level Participants (Traders/ Agents/ Brokers)
        • Wholesalers and Distributors
      • Value Added and Value Created at Node in the Supply Chain
      • List of Raw Material Suppliers
      • List of Existing and Potential Buyer’s
    • Investment Feasibility Matrix
    • Value Chain Analysis
      • Profit Margin Analysis
      • Wholesalers and Distributors
      • Retailers
    • PESTLE and Porter’s Analysis
    • Regulatory Landscape
      • By Key Regions
      • By Key Countries
    • Regional Parent Market Outlook
    • Production and Consumption Statistics
    • Import and Export Statistics
  4. Global Market Analysis 2020 to 2024 and Forecast, 2025 to 2035
    • Historical Market Size Value (USD Billion) & Volume (Units) Analysis, 2020 to 2024
    • Current and Future Market Size Value (USD Billion) & Volume (Units) Projections, 2025 to 2035
      • Y-o-Y Growth Trend Analysis
      • Absolute $ Opportunity Analysis
  5. Global Market Pricing Analysis 2020 to 2024 and Forecast 2025 to 2035
  6. Global Market Analysis 2020 to 2024 and Forecast 2025 to 2035, By Coffee Variety
    • Introduction / Key Findings
    • Historical Market Size Value (USD Billion) & Volume (Units) Analysis By Coffee Variety, 2020 to 2024
    • Current and Future Market Size Value (USD Billion) & Volume (Units) Analysis and Forecast By Coffee Variety, 2025 to 2035
      • Black Coffee
      • Espresso-Based
      • Specialty Coffees
      • Coffee Concentrates
    • Y-o-Y Growth Trend Analysis By Coffee Variety, 2020 to 2024
    • Absolute $ Opportunity Analysis By Coffee Variety, 2025 to 2035
  7. Global Market Analysis 2020 to 2024 and Forecast 2025 to 2035, By Caffeine Content
    • Introduction / Key Findings
    • Historical Market Size Value (USD Billion) & Volume (Units) Analysis By Caffeine Content, 2020 to 2024
    • Current and Future Market Size Value (USD Billion) & Volume (Units) Analysis and Forecast By Caffeine Content, 2025 to 2035
      • Regular
      • Decaffeinated
    • Y-o-Y Growth Trend Analysis By Caffeine Content, 2020 to 2024
    • Absolute $ Opportunity Analysis By Caffeine Content, 2025 to 2035
  8. Global Market Analysis 2020 to 2024 and Forecast 2025 to 2035, By Packaging Type
    • Introduction / Key Findings
    • Historical Market Size Value (USD Billion) & Volume (Units) Analysis By Packaging Type, 2020 to 2024
    • Current and Future Market Size Value (USD Billion) & Volume (Units) Analysis and Forecast By Packaging Type, 2025 to 2035
      • Glass Bottle
      • Cans
      • Plastic Bottles
      • Pouches
      • Others (Tetra Packs, Cartons, Sachets)
    • Y-o-Y Growth Trend Analysis By Packaging Type, 2020 to 2024
    • Absolute $ Opportunity Analysis By Packaging Type, 2025 to 2035
  9. Global Market Analysis 2020 to 2024 and Forecast 2025 to 2035, By Sales Channel
    • Introduction / Key Findings
    • Historical Market Size Value (USD Billion) & Volume (Units) Analysis By Sales Channel, 2020 to 2024
    • Current and Future Market Size Value (USD Billion) & Volume (Units) Analysis and Forecast By Sales Channel, 2025 to 2035
      • Food Service
      • Physical Retail
      • Travel Retail
      • Online Retail
    • Y-o-Y Growth Trend Analysis By Sales Channel, 2020 to 2024
    • Absolute $ Opportunity Analysis By Sales Channel, 2025 to 2035
  10. Global Market Analysis 2020 to 2024 and Forecast 2025 to 2035, By Flavour
    • Introduction / Key Findings
    • Historical Market Size Value (USD Billion) & Volume (Units) Analysis By Flavour, 2020 to 2024
    • Current and Future Market Size Value (USD Billion) & Volume (Units) Analysis and Forecast By Flavour, 2025 to 2035
      • Unflavoured/Classic/Original
      • Flavoured
        • Vanilla
        • Hazelnut
        • Caramel
        • Chocolate
        • Others (Mocha, Seasonal Blends)
    • Y-o-Y Growth Trend Analysis By Flavour, 2020 to 2024
    • Absolute $ Opportunity Analysis By Flavour, 2025 to 2035
  11. Global Market Analysis 2020 to 2024 and Forecast 2025 to 2035, By Region
    • Introduction
    • Historical Market Size Value (USD Billion) & Volume (Units) Analysis By Region, 2020 to 2024
    • Current Market Size Value (USD Billion) & Volume (Units) Analysis and Forecast By Region, 2025 to 2035
      • North America
      • Latin America
      • Western Europe
      • Eastern Europe
      • East Asia
      • South Asia & Pacific
      • Middle East and Africa
    • Market Attractiveness Analysis By Region
  12. North America Market Analysis 2020 to 2024 and Forecast 2025 to 2035, By Country
    • Historical Market Size Value (USD Billion) & Volume (Units) Trend Analysis By Market Taxonomy, 2020 to 2024
    • Market Size Value (USD Billion) & Volume (Units) Forecast By Market Taxonomy, 2025 to 2035
      • By Country
        • USA
        • Canada
        • Mexico
      • By Coffee Variety
      • By Caffeine Content
      • By Packaging Type
      • By Sales Channel
      • By Flavour
    • Market Attractiveness Analysis
      • By Country
      • By Coffee Variety
      • By Caffeine Content
      • By Packaging Type
      • By Sales Channel
      • By Flavour
    • Key Takeaways
  13. Latin America Market Analysis 2020 to 2024 and Forecast 2025 to 2035, By Country
    • Historical Market Size Value (USD Billion) & Volume (Units) Trend Analysis By Market Taxonomy, 2020 to 2024
    • Market Size Value (USD Billion) & Volume (Units) Forecast By Market Taxonomy, 2025 to 2035
      • By Country
        • Brazil
        • Argentina
        • Rest of LATAM
      • By Coffee Variety
      • By Caffeine Content
      • By Packaging Type
      • By Sales Channel
      • By Flavour
    • Market Attractiveness Analysis
      • By Country
      • By Coffee Variety
      • By Caffeine Content
      • By Packaging Type
      • By Sales Channel
      • By Flavour
    • Key Takeaways
  14. Western Europe Market Analysis 2020 to 2024 and Forecast 2025 to 2035, By Country
    • Historical Market Size Value (USD Billion) & Volume (Units) Trend Analysis By Market Taxonomy, 2020 to 2024
    • Market Size Value (USD Billion) & Volume (Units) Forecast By Market Taxonomy, 2025 to 2035
      • By Country
        • Germany
        • Italy
        • France
        • UK
        • Spain
        • BENELUX
        • Nordic
        • Rest of W.Europe
      • By Coffee Variety
      • By Caffeine Content
      • By Packaging Type
      • By Sales Channel
      • By Flavour
    • Market Attractiveness Analysis
      • By Country
      • By Coffee Variety
      • By Caffeine Content
      • By Packaging Type
      • By Sales Channel
      • By Flavour
    • Key Takeaways
  15. Eastern Europe Market Analysis 2020 to 2024 and Forecast 2025 to 2035, By Country
    • Historical Market Size Value (USD Billion) & Volume (Units) Trend Analysis By Market Taxonomy, 2020 to 2024
    • Market Size Value (USD Billion) & Volume (Units) Forecast By Market Taxonomy, 2025 to 2035
      • By Country
        • Russia
        • Hungary
        • Poland
        • Balkan & Baltics
        • Rest of E. Europe
      • By Coffee Variety
      • By Caffeine Content
      • By Packaging Type
      • By Sales Channel
      • By Flavour
    • Market Attractiveness Analysis
      • By Country
      • By Coffee Variety
      • By Caffeine Content
      • By Packaging Type
      • By Sales Channel
      • By Flavour
    • Key Takeaways
  16. East Asia Market Analysis 2020 to 2024 and Forecast 2025 to 2035, By Country
    • Historical Market Size Value (USD Billion) & Volume (Units) Trend Analysis By Market Taxonomy, 2020 to 2024
    • Market Size Value (USD Billion) & Volume (Units) Forecast By Market Taxonomy, 2025 to 2035
      • By Country
        • China
        • Japan
        • South Korea
      • By Coffee Variety
      • By Caffeine Content
      • By Packaging Type
      • By Sales Channel
      • By Flavour
    • Market Attractiveness Analysis
      • By Country
      • By Coffee Variety
      • By Caffeine Content
      • By Packaging Type
      • By Sales Channel
      • By Flavour
    • Key Takeaways
  17. South Asia & Pacific Market Analysis 2020 to 2024 and Forecast 2025 to 2035, By Country
    • Historical Market Size Value (USD Billion) & Volume (Units) Trend Analysis By Market Taxonomy, 2020 to 2024
    • Market Size Value (USD Billion) & Volume (Units) Forecast By Market Taxonomy, 2025 to 2035
      • By Country
        • India
        • Australia & New Zealand
        • ASEAN
        • Rest of SAP
      • By Coffee Variety
      • By Caffeine Content
      • By Packaging Type
      • By Sales Channel
      • By Flavour
    • Market Attractiveness Analysis
      • By Country
      • By Coffee Variety
      • By Caffeine Content
      • By Packaging Type
      • By Sales Channel
      • By Flavour
    • Key Takeaways
  18. Middle East and Africa Market Analysis 2020 to 2024 and Forecast 2025 to 2035, By Country
    • Historical Market Size Value (USD Billion) & Volume (Units) Trend Analysis By Market Taxonomy, 2020 to 2024
    • Market Size Value (USD Billion) & Volume (Units) Forecast By Market Taxonomy, 2025 to 2035
      • By Country
        • GCC Countries
        • Northern Africa
        • South Africa
        • Turkiye
        • Rest of MEA
      • By Coffee Variety
      • By Caffeine Content
      • By Packaging Type
      • By Sales Channel
      • By Flavour
    • Market Attractiveness Analysis
      • By Country
      • By Coffee Variety
      • By Caffeine Content
      • By Packaging Type
      • By Sales Channel
      • By Flavour
    • Key Takeaways
  19. Key Countries Market Analysis
    • USA
      • Pricing Analysis
      • Market Share Analysis, 2024
        • By Coffee Variety
        • By Caffeine Content
        • By Packaging Type
        • By Sales Channel
        • By Flavour
    • Canada
      • Pricing Analysis
      • Market Share Analysis, 2024
        • By Coffee Variety
        • By Caffeine Content
        • By Packaging Type
        • By Sales Channel
        • By Flavour
    • Brazil
      • Pricing Analysis
      • Market Share Analysis, 2024
        • By Coffee Variety
        • By Caffeine Content
        • By Packaging Type
        • By Sales Channel
        • By Flavour
    • Mexico
      • Pricing Analysis
      • Market Share Analysis, 2024
        • By Coffee Variety
        • By Caffeine Content
        • By Packaging Type
        • By Sales Channel
        • By Flavour
    • Argentina
      • Pricing Analysis
      • Market Share Analysis, 2024
        • By Coffee Variety
        • By Caffeine Content
        • By Packaging Type
        • By Sales Channel
        • By Flavour
  20. Market Structure Analysis
    • Competition Dashboard
    • Competition Benchmarking
    • Market Share Analysis of Top Players
      • By Regional
      • By Coffee Variety
      • By Caffeine Content
      • By Packaging Type
      • By Sales Channel
      • By Flavour
  21. Competition Analysis
    • Competition Deep Dive
      • PepsiCo.
        • Overview
        • Product Portfolio
        • Profitability by Market Segments (Product/Age /Sales Channel/Region)
        • Sales Footprint
        • Strategy Overview
          • Marketing Strategy
          • Product Strategy
          • Channel Strategy
      • The Coca-Cola Company
        • Overview
        • Product Portfolio
        • Profitability by Market Segments (Product/Age /Sales Channel/Region)
        • Sales Footprint
        • Strategy Overview
          • Marketing Strategy
          • Product Strategy
          • Channel Strategy
      • Nestle S.A.
        • Overview
        • Product Portfolio
        • Profitability by Market Segments (Product/Age /Sales Channel/Region)
        • Sales Footprint
        • Strategy Overview
          • Marketing Strategy
          • Product Strategy
          • Channel Strategy
      • JAB Holding Company
        • Overview
        • Product Portfolio
        • Profitability by Market Segments (Product/Age /Sales Channel/Region)
        • Sales Footprint
        • Strategy Overview
          • Marketing Strategy
          • Product Strategy
          • Channel Strategy
      • Asahi Group Holdings, Ltd.
        • Overview
        • Product Portfolio
        • Profitability by Market Segments (Product/Age /Sales Channel/Region)
        • Sales Footprint
        • Strategy Overview
          • Marketing Strategy
          • Product Strategy
          • Channel Strategy
      • McDonald’s Corporation
        • Overview
        • Product Portfolio
        • Profitability by Market Segments (Product/Age /Sales Channel/Region)
        • Sales Footprint
        • Strategy Overview
          • Marketing Strategy
          • Product Strategy
          • Channel Strategy
      • Danone S.A.
        • Overview
        • Product Portfolio
        • Profitability by Market Segments (Product/Age /Sales Channel/Region)
        • Sales Footprint
        • Strategy Overview
          • Marketing Strategy
          • Product Strategy
          • Channel Strategy
      • Suntory Beverage & Food
        • Overview
        • Product Portfolio
        • Profitability by Market Segments (Product/Age /Sales Channel/Region)
        • Sales Footprint
        • Strategy Overview
          • Marketing Strategy
          • Product Strategy
          • Channel Strategy
      • Lotte Chilsung Beverage Co. Ltd.
        • Overview
        • Product Portfolio
        • Profitability by Market Segments (Product/Age /Sales Channel/Region)
        • Sales Footprint
        • Strategy Overview
          • Marketing Strategy
          • Product Strategy
          • Channel Strategy
      • Starbucks
        • Overview
        • Product Portfolio
        • Profitability by Market Segments (Product/Age /Sales Channel/Region)
        • Sales Footprint
        • Strategy Overview
          • Marketing Strategy
          • Product Strategy
          • Channel Strategy
      • Unilever
        • Overview
        • Product Portfolio
        • Profitability by Market Segments (Product/Age /Sales Channel/Region)
        • Sales Footprint
        • Strategy Overview
          • Marketing Strategy
          • Product Strategy
          • Channel Strategy
      • Monster Beverage Co.
        • Overview
        • Product Portfolio
        • Profitability by Market Segments (Product/Age /Sales Channel/Region)
        • Sales Footprint
        • Strategy Overview
          • Marketing Strategy
          • Product Strategy
          • Channel Strategy
  22. Assumptions & Acronyms Used
  23. Research Methodology

List of Tables

  • Table 1: Global Market Value (USD Billion) Forecast by Region, 2020-2035
  • Table 2: Global Market Volume (Units) Forecast by Region, 2020-2035
  • Table 3: Global Market Value (USD Billion) Forecast by Coffee Variety, 2020-2035
  • Table 4: Global Market Volume (Units) Forecast by Coffee Variety, 2020-2035
  • Table 5: Global Market Value (USD Billion) Forecast by Caffeine Content, 2020-2035
  • Table 6: Global Market Volume (Units) Forecast by Caffeine Content, 2020-2035
  • Table 7: Global Market Value (USD Billion) Forecast by Packaging Type, 2020-2035
  • Table 8: Global Market Volume (Units) Forecast by Packaging Type, 2020-2035
  • Table 9: Global Market Value (USD Billion) Forecast by Sales Channel, 2020-2035
  • Table 10: Global Market Volume (Units) Forecast by Sales Channel, 2020-2035
  • Table 11: Global Market Value (USD Billion) Forecast by Flavour, 2020-2035
  • Table 12: Global Market Volume (Units) Forecast by Flavour, 2020-2035
  • Table 13: North America Market Value (USD Billion) Forecast by Country, 2020-2035
  • Table 14: North America Market Volume (Units) Forecast by Country, 2020-2035
  • Table 15: North America Market Value (USD Billion) Forecast by Coffee Variety, 2020-2035
  • Table 16: North America Market Volume (Units) Forecast by Coffee Variety, 2020-2035
  • Table 17: North America Market Value (USD Billion) Forecast by Caffeine Content, 2020-2035
  • Table 18: North America Market Volume (Units) Forecast by Caffeine Content, 2020-2035
  • Table 19: North America Market Value (USD Billion) Forecast by Packaging Type, 2020-2035
  • Table 20: North America Market Volume (Units) Forecast by Packaging Type, 2020-2035
  • Table 21: North America Market Value (USD Billion) Forecast by Sales Channel, 2020-2035
  • Table 22: North America Market Volume (Units) Forecast by Sales Channel, 2020-2035
  • Table 23: North America Market Value (USD Billion) Forecast by Flavour, 2020-2035
  • Table 24: North America Market Volume (Units) Forecast by Flavour, 2020-2035
  • Table 25: Latin America Market Value (USD Billion) Forecast by Country, 2020-2035
  • Table 26: Latin America Market Volume (Units) Forecast by Country, 2020-2035
  • Table 27: Latin America Market Value (USD Billion) Forecast by Coffee Variety, 2020-2035
  • Table 28: Latin America Market Volume (Units) Forecast by Coffee Variety, 2020-2035
  • Table 29: Latin America Market Value (USD Billion) Forecast by Caffeine Content, 2020-2035
  • Table 30: Latin America Market Volume (Units) Forecast by Caffeine Content, 2020-2035
  • Table 31: Latin America Market Value (USD Billion) Forecast by Packaging Type, 2020-2035
  • Table 32: Latin America Market Volume (Units) Forecast by Packaging Type, 2020-2035
  • Table 33: Latin America Market Value (USD Billion) Forecast by Sales Channel, 2020-2035
  • Table 34: Latin America Market Volume (Units) Forecast by Sales Channel, 2020-2035
  • Table 35: Latin America Market Value (USD Billion) Forecast by Flavour, 2020-2035
  • Table 36: Latin America Market Volume (Units) Forecast by Flavour, 2020-2035
  • Table 37: Western Europe Market Value (USD Billion) Forecast by Country, 2020-2035
  • Table 38: Western Europe Market Volume (Units) Forecast by Country, 2020-2035
  • Table 39: Western Europe Market Value (USD Billion) Forecast by Coffee Variety, 2020-2035
  • Table 40: Western Europe Market Volume (Units) Forecast by Coffee Variety, 2020-2035
  • Table 41: Western Europe Market Value (USD Billion) Forecast by Caffeine Content, 2020-2035
  • Table 42: Western Europe Market Volume (Units) Forecast by Caffeine Content, 2020-2035
  • Table 43: Western Europe Market Value (USD Billion) Forecast by Packaging Type, 2020-2035
  • Table 44: Western Europe Market Volume (Units) Forecast by Packaging Type, 2020-2035
  • Table 45: Western Europe Market Value (USD Billion) Forecast by Sales Channel, 2020-2035
  • Table 46: Western Europe Market Volume (Units) Forecast by Sales Channel, 2020-2035
  • Table 47: Western Europe Market Value (USD Billion) Forecast by Flavour, 2020-2035
  • Table 48: Western Europe Market Volume (Units) Forecast by Flavour, 2020-2035
  • Table 49: Eastern Europe Market Value (USD Billion) Forecast by Country, 2020-2035
  • Table 50: Eastern Europe Market Volume (Units) Forecast by Country, 2020-2035
  • Table 51: Eastern Europe Market Value (USD Billion) Forecast by Coffee Variety, 2020-2035
  • Table 52: Eastern Europe Market Volume (Units) Forecast by Coffee Variety, 2020-2035
  • Table 53: Eastern Europe Market Value (USD Billion) Forecast by Caffeine Content, 2020-2035
  • Table 54: Eastern Europe Market Volume (Units) Forecast by Caffeine Content, 2020-2035
  • Table 55: Eastern Europe Market Value (USD Billion) Forecast by Packaging Type, 2020-2035
  • Table 56: Eastern Europe Market Volume (Units) Forecast by Packaging Type, 2020-2035
  • Table 57: Eastern Europe Market Value (USD Billion) Forecast by Sales Channel, 2020-2035
  • Table 58: Eastern Europe Market Volume (Units) Forecast by Sales Channel, 2020-2035
  • Table 59: Eastern Europe Market Value (USD Billion) Forecast by Flavour, 2020-2035
  • Table 60: Eastern Europe Market Volume (Units) Forecast by Flavour, 2020-2035
  • Table 61: East Asia Market Value (USD Billion) Forecast by Country, 2020-2035
  • Table 62: East Asia Market Volume (Units) Forecast by Country, 2020-2035
  • Table 63: East Asia Market Value (USD Billion) Forecast by Coffee Variety, 2020-2035
  • Table 64: East Asia Market Volume (Units) Forecast by Coffee Variety, 2020-2035
  • Table 65: East Asia Market Value (USD Billion) Forecast by Caffeine Content, 2020-2035
  • Table 66: East Asia Market Volume (Units) Forecast by Caffeine Content, 2020-2035
  • Table 67: East Asia Market Value (USD Billion) Forecast by Packaging Type, 2020-2035
  • Table 68: East Asia Market Volume (Units) Forecast by Packaging Type, 2020-2035
  • Table 69: East Asia Market Value (USD Billion) Forecast by Sales Channel, 2020-2035
  • Table 70: East Asia Market Volume (Units) Forecast by Sales Channel, 2020-2035
  • Table 71: East Asia Market Value (USD Billion) Forecast by Flavour, 2020-2035
  • Table 72: East Asia Market Volume (Units) Forecast by Flavour, 2020-2035
  • Table 73: South Asia & Pacific Market Value (USD Billion) Forecast by Country, 2020-2035
  • Table 74: South Asia & Pacific Market Volume (Units) Forecast by Country, 2020-2035
  • Table 75: South Asia & Pacific Market Value (USD Billion) Forecast by Coffee Variety, 2020-2035
  • Table 76: South Asia & Pacific Market Volume (Units) Forecast by Coffee Variety, 2020-2035
  • Table 77: South Asia & Pacific Market Value (USD Billion) Forecast by Caffeine Content, 2020-2035
  • Table 78: South Asia & Pacific Market Volume (Units) Forecast by Caffeine Content, 2020-2035
  • Table 79: South Asia & Pacific Market Value (USD Billion) Forecast by Packaging Type, 2020-2035
  • Table 80: South Asia & Pacific Market Volume (Units) Forecast by Packaging Type, 2020-2035
  • Table 81: South Asia & Pacific Market Value (USD Billion) Forecast by Sales Channel, 2020-2035
  • Table 82: South Asia & Pacific Market Volume (Units) Forecast by Sales Channel, 2020-2035
  • Table 83: South Asia & Pacific Market Value (USD Billion) Forecast by Flavour, 2020-2035
  • Table 84: South Asia & Pacific Market Volume (Units) Forecast by Flavour, 2020-2035
  • Table 85: Middle East and Africa Market Value (USD Billion) Forecast by Country, 2020-2035
  • Table 86: Middle East and Africa Market Volume (Units) Forecast by Country, 2020-2035
  • Table 87: Middle East and Africa Market Value (USD Billion) Forecast by Coffee Variety, 2020-2035
  • Table 88: Middle East and Africa Market Volume (Units) Forecast by Coffee Variety, 2020-2035
  • Table 89: Middle East and Africa Market Value (USD Billion) Forecast by Caffeine Content, 2020-2035
  • Table 90: Middle East and Africa Market Volume (Units) Forecast by Caffeine Content, 2020-2035
  • Table 91: Middle East and Africa Market Value (USD Billion) Forecast by Packaging Type, 2020-2035
  • Table 92: Middle East and Africa Market Volume (Units) Forecast by Packaging Type, 2020-2035
  • Table 93: Middle East and Africa Market Value (USD Billion) Forecast by Sales Channel, 2020-2035
  • Table 94: Middle East and Africa Market Volume (Units) Forecast by Sales Channel, 2020-2035
  • Table 95: Middle East and Africa Market Value (USD Billion) Forecast by Flavour, 2020-2035
  • Table 96: Middle East and Africa Market Volume (Units) Forecast by Flavour, 2020-2035

List of Figures

  • Figure 1: Global Market Volume (Units) Forecast 2020-2035
  • Figure 2: Global Market Pricing Analysis
  • Figure 3: Global Market Value (USD Billion) Forecast 2020-2035
  • Figure 4: Global Market Value Share and BPS Analysis by Coffee Variety, 2025 and 2035
  • Figure 5: Global Market Y-o-Y Growth Comparison by Coffee Variety, 2025-2035
  • Figure 6: Global Market Attractiveness Analysis by Coffee Variety
  • Figure 7: Global Market Value Share and BPS Analysis by Caffeine Content, 2025 and 2035
  • Figure 8: Global Market Y-o-Y Growth Comparison by Caffeine Content, 2025-2035
  • Figure 9: Global Market Attractiveness Analysis by Caffeine Content
  • Figure 10: Global Market Value Share and BPS Analysis by Packaging Type, 2025 and 2035
  • Figure 11: Global Market Y-o-Y Growth Comparison by Packaging Type, 2025-2035
  • Figure 12: Global Market Attractiveness Analysis by Packaging Type
  • Figure 13: Global Market Value Share and BPS Analysis by Sales Channel, 2025 and 2035
  • Figure 14: Global Market Y-o-Y Growth Comparison by Sales Channel, 2025-2035
  • Figure 15: Global Market Attractiveness Analysis by Sales Channel
  • Figure 16: Global Market Value Share and BPS Analysis by Flavour, 2025 and 2035
  • Figure 17: Global Market Y-o-Y Growth Comparison by Flavour, 2025-2035
  • Figure 18: Global Market Attractiveness Analysis by Flavour
  • Figure 19: Global Market Value (USD Billion) Share and BPS Analysis by Region, 2025 and 2035
  • Figure 20: Global Market Y-o-Y Growth Comparison by Region, 2025-2035
  • Figure 21: Global Market Attractiveness Analysis by Region
  • Figure 22: North America Market Incremental $ Opportunity, 2025-2035
  • Figure 23: Latin America Market Incremental $ Opportunity, 2025-2035
  • Figure 24: Western Europe Market Incremental $ Opportunity, 2025-2035
  • Figure 25: Eastern Europe Market Incremental $ Opportunity, 2025-2035
  • Figure 26: East Asia Market Incremental $ Opportunity, 2025-2035
  • Figure 27: South Asia & Pacific Market Incremental $ Opportunity, 2025-2035
  • Figure 28: Middle East and Africa Market Incremental $ Opportunity, 2025-2035
  • Figure 29: North America Market Value Share and BPS Analysis by Country, 2025 and 2035
  • Figure 30: North America Market Value Share and BPS Analysis by Coffee Variety, 2025 and 2035
  • Figure 31: North America Market Y-o-Y Growth Comparison by Coffee Variety, 2025-2035
  • Figure 32: North America Market Attractiveness Analysis by Coffee Variety
  • Figure 33: North America Market Value Share and BPS Analysis by Caffeine Content, 2025 and 2035
  • Figure 34: North America Market Y-o-Y Growth Comparison by Caffeine Content, 2025-2035
  • Figure 35: North America Market Attractiveness Analysis by Caffeine Content
  • Figure 36: North America Market Value Share and BPS Analysis by Packaging Type, 2025 and 2035
  • Figure 37: North America Market Y-o-Y Growth Comparison by Packaging Type, 2025-2035
  • Figure 38: North America Market Attractiveness Analysis by Packaging Type
  • Figure 39: North America Market Value Share and BPS Analysis by Sales Channel, 2025 and 2035
  • Figure 40: North America Market Y-o-Y Growth Comparison by Sales Channel, 2025-2035
  • Figure 41: North America Market Attractiveness Analysis by Sales Channel
  • Figure 42: North America Market Value Share and BPS Analysis by Flavour, 2025 and 2035
  • Figure 43: North America Market Y-o-Y Growth Comparison by Flavour, 2025-2035
  • Figure 44: North America Market Attractiveness Analysis by Flavour
  • Figure 45: Latin America Market Value Share and BPS Analysis by Country, 2025 and 2035
  • Figure 46: Latin America Market Value Share and BPS Analysis by Coffee Variety, 2025 and 2035
  • Figure 47: Latin America Market Y-o-Y Growth Comparison by Coffee Variety, 2025-2035
  • Figure 48: Latin America Market Attractiveness Analysis by Coffee Variety
  • Figure 49: Latin America Market Value Share and BPS Analysis by Caffeine Content, 2025 and 2035
  • Figure 50: Latin America Market Y-o-Y Growth Comparison by Caffeine Content, 2025-2035
  • Figure 51: Latin America Market Attractiveness Analysis by Caffeine Content
  • Figure 52: Latin America Market Value Share and BPS Analysis by Packaging Type, 2025 and 2035
  • Figure 53: Latin America Market Y-o-Y Growth Comparison by Packaging Type, 2025-2035
  • Figure 54: Latin America Market Attractiveness Analysis by Packaging Type
  • Figure 55: Latin America Market Value Share and BPS Analysis by Sales Channel, 2025 and 2035
  • Figure 56: Latin America Market Y-o-Y Growth Comparison by Sales Channel, 2025-2035
  • Figure 57: Latin America Market Attractiveness Analysis by Sales Channel
  • Figure 58: Latin America Market Value Share and BPS Analysis by Flavour, 2025 and 2035
  • Figure 59: Latin America Market Y-o-Y Growth Comparison by Flavour, 2025-2035
  • Figure 60: Latin America Market Attractiveness Analysis by Flavour
  • Figure 61: Western Europe Market Value Share and BPS Analysis by Country, 2025 and 2035
  • Figure 62: Western Europe Market Value Share and BPS Analysis by Coffee Variety, 2025 and 2035
  • Figure 63: Western Europe Market Y-o-Y Growth Comparison by Coffee Variety, 2025-2035
  • Figure 64: Western Europe Market Attractiveness Analysis by Coffee Variety
  • Figure 65: Western Europe Market Value Share and BPS Analysis by Caffeine Content, 2025 and 2035
  • Figure 66: Western Europe Market Y-o-Y Growth Comparison by Caffeine Content, 2025-2035
  • Figure 67: Western Europe Market Attractiveness Analysis by Caffeine Content
  • Figure 68: Western Europe Market Value Share and BPS Analysis by Packaging Type, 2025 and 2035
  • Figure 69: Western Europe Market Y-o-Y Growth Comparison by Packaging Type, 2025-2035
  • Figure 70: Western Europe Market Attractiveness Analysis by Packaging Type
  • Figure 71: Western Europe Market Value Share and BPS Analysis by Sales Channel, 2025 and 2035
  • Figure 72: Western Europe Market Y-o-Y Growth Comparison by Sales Channel, 2025-2035
  • Figure 73: Western Europe Market Attractiveness Analysis by Sales Channel
  • Figure 74: Western Europe Market Value Share and BPS Analysis by Flavour, 2025 and 2035
  • Figure 75: Western Europe Market Y-o-Y Growth Comparison by Flavour, 2025-2035
  • Figure 76: Western Europe Market Attractiveness Analysis by Flavour
  • Figure 77: Eastern Europe Market Value Share and BPS Analysis by Country, 2025 and 2035
  • Figure 78: Eastern Europe Market Value Share and BPS Analysis by Coffee Variety, 2025 and 2035
  • Figure 79: Eastern Europe Market Y-o-Y Growth Comparison by Coffee Variety, 2025-2035
  • Figure 80: Eastern Europe Market Attractiveness Analysis by Coffee Variety
  • Figure 81: Eastern Europe Market Value Share and BPS Analysis by Caffeine Content, 2025 and 2035
  • Figure 82: Eastern Europe Market Y-o-Y Growth Comparison by Caffeine Content, 2025-2035
  • Figure 83: Eastern Europe Market Attractiveness Analysis by Caffeine Content
  • Figure 84: Eastern Europe Market Value Share and BPS Analysis by Packaging Type, 2025 and 2035
  • Figure 85: Eastern Europe Market Y-o-Y Growth Comparison by Packaging Type, 2025-2035
  • Figure 86: Eastern Europe Market Attractiveness Analysis by Packaging Type
  • Figure 87: Eastern Europe Market Value Share and BPS Analysis by Sales Channel, 2025 and 2035
  • Figure 88: Eastern Europe Market Y-o-Y Growth Comparison by Sales Channel, 2025-2035
  • Figure 89: Eastern Europe Market Attractiveness Analysis by Sales Channel
  • Figure 90: Eastern Europe Market Value Share and BPS Analysis by Flavour, 2025 and 2035
  • Figure 91: Eastern Europe Market Y-o-Y Growth Comparison by Flavour, 2025-2035
  • Figure 92: Eastern Europe Market Attractiveness Analysis by Flavour
  • Figure 93: East Asia Market Value Share and BPS Analysis by Country, 2025 and 2035
  • Figure 94: East Asia Market Value Share and BPS Analysis by Coffee Variety, 2025 and 2035
  • Figure 95: East Asia Market Y-o-Y Growth Comparison by Coffee Variety, 2025-2035
  • Figure 96: East Asia Market Attractiveness Analysis by Coffee Variety
  • Figure 97: East Asia Market Value Share and BPS Analysis by Caffeine Content, 2025 and 2035
  • Figure 98: East Asia Market Y-o-Y Growth Comparison by Caffeine Content, 2025-2035
  • Figure 99: East Asia Market Attractiveness Analysis by Caffeine Content
  • Figure 100: East Asia Market Value Share and BPS Analysis by Packaging Type, 2025 and 2035
  • Figure 101: East Asia Market Y-o-Y Growth Comparison by Packaging Type, 2025-2035
  • Figure 102: East Asia Market Attractiveness Analysis by Packaging Type
  • Figure 103: East Asia Market Value Share and BPS Analysis by Sales Channel, 2025 and 2035
  • Figure 104: East Asia Market Y-o-Y Growth Comparison by Sales Channel, 2025-2035
  • Figure 105: East Asia Market Attractiveness Analysis by Sales Channel
  • Figure 106: East Asia Market Value Share and BPS Analysis by Flavour, 2025 and 2035
  • Figure 107: East Asia Market Y-o-Y Growth Comparison by Flavour, 2025-2035
  • Figure 108: East Asia Market Attractiveness Analysis by Flavour
  • Figure 109: South Asia & Pacific Market Value Share and BPS Analysis by Country, 2025 and 2035
  • Figure 110: South Asia & Pacific Market Value Share and BPS Analysis by Coffee Variety, 2025 and 2035
  • Figure 111: South Asia & Pacific Market Y-o-Y Growth Comparison by Coffee Variety, 2025-2035
  • Figure 112: South Asia & Pacific Market Attractiveness Analysis by Coffee Variety
  • Figure 113: South Asia & Pacific Market Value Share and BPS Analysis by Caffeine Content, 2025 and 2035
  • Figure 114: South Asia & Pacific Market Y-o-Y Growth Comparison by Caffeine Content, 2025-2035
  • Figure 115: South Asia & Pacific Market Attractiveness Analysis by Caffeine Content
  • Figure 116: South Asia & Pacific Market Value Share and BPS Analysis by Packaging Type, 2025 and 2035
  • Figure 117: South Asia & Pacific Market Y-o-Y Growth Comparison by Packaging Type, 2025-2035
  • Figure 118: South Asia & Pacific Market Attractiveness Analysis by Packaging Type
  • Figure 119: South Asia & Pacific Market Value Share and BPS Analysis by Sales Channel, 2025 and 2035
  • Figure 120: South Asia & Pacific Market Y-o-Y Growth Comparison by Sales Channel, 2025-2035
  • Figure 121: South Asia & Pacific Market Attractiveness Analysis by Sales Channel
  • Figure 122: South Asia & Pacific Market Value Share and BPS Analysis by Flavour, 2025 and 2035
  • Figure 123: South Asia & Pacific Market Y-o-Y Growth Comparison by Flavour, 2025-2035
  • Figure 124: South Asia & Pacific Market Attractiveness Analysis by Flavour
  • Figure 125: Middle East and Africa Market Value Share and BPS Analysis by Country, 2025 and 2035
  • Figure 126: Middle East and Africa Market Value Share and BPS Analysis by Coffee Variety, 2025 and 2035
  • Figure 127: Middle East and Africa Market Y-o-Y Growth Comparison by Coffee Variety, 2025-2035
  • Figure 128: Middle East and Africa Market Attractiveness Analysis by Coffee Variety
  • Figure 129: Middle East and Africa Market Value Share and BPS Analysis by Caffeine Content, 2025 and 2035
  • Figure 130: Middle East and Africa Market Y-o-Y Growth Comparison by Caffeine Content, 2025-2035
  • Figure 131: Middle East and Africa Market Attractiveness Analysis by Caffeine Content
  • Figure 132: Middle East and Africa Market Value Share and BPS Analysis by Packaging Type, 2025 and 2035
  • Figure 133: Middle East and Africa Market Y-o-Y Growth Comparison by Packaging Type, 2025-2035
  • Figure 134: Middle East and Africa Market Attractiveness Analysis by Packaging Type
  • Figure 135: Middle East and Africa Market Value Share and BPS Analysis by Sales Channel, 2025 and 2035
  • Figure 136: Middle East and Africa Market Y-o-Y Growth Comparison by Sales Channel, 2025-2035
  • Figure 137: Middle East and Africa Market Attractiveness Analysis by Sales Channel
  • Figure 138: Middle East and Africa Market Value Share and BPS Analysis by Flavour, 2025 and 2035
  • Figure 139: Middle East and Africa Market Y-o-Y Growth Comparison by Flavour, 2025-2035
  • Figure 140: Middle East and Africa Market Attractiveness Analysis by Flavour
  • Figure 141: Global Market - Tier Structure Analysis
  • Figure 142: Global Market - Company Share Analysis

Frequently Asked Questions

How big is the ready to drink coffee market in 2025?

The global ready to drink coffee market is estimated to be valued at USD 38.5 billion in 2025.

What will be the size of ready to drink coffee market in 2035?

The market size for ready to drink coffee is projected to reach USD 57.5 billion by 2035.

How much will be the ready to drink coffee market growth between 2025 and 2035?

The ready to drink coffee market is expected to grow at a 4.1% CAGR between 2025 and 2035.

Which coffee variety is projected to lead in the ready to drink coffee market in 2025?

The espresso-based segment is projected to lead in the ready to drink coffee market with 37% market share in 2025.

Which caffeine content segment to contribute a significant share in the ready to drink coffee market in 2025?

In terms of caffeine content, the regular (caffeinated) segment is projected to command 95% share in the ready to drink coffee market in 2025.

Explore Similar Insights

Future Market Insights

Ready to Drink Coffee Market

Chat With

MaRIA

Hi There, I am MaRIA, Your Market Research Intelligence Assistant. How may I help you?