Ready-to-Finish Bakery Products Market Forecast and Outlook 2025 to 2035

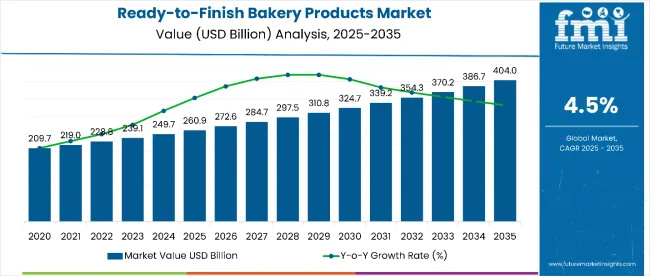
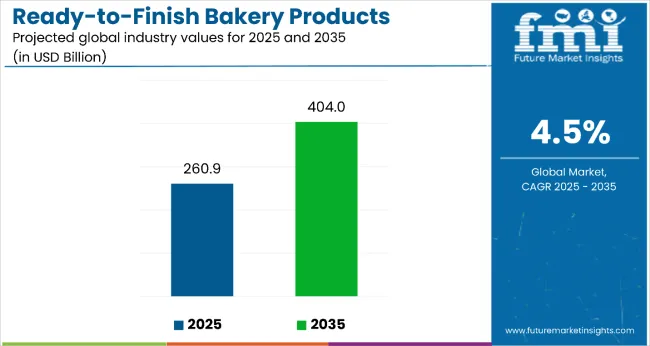
The ready-to-finish bakery products market is estimated to be valued at USD 260.9 billion in 2025. It is projected to reach USD 404 billion by 2035, registering a CAGR of 4.5% over the forecast period.
Ready To Finish Bakery Products Market

Quick Stats for Ready-to-Finish Bakery Products Market

  • Ready-to-Finish Bakery Products Market Value (2025): USD 260.9 billion
  • Ready-to-Finish Bakery Products Market Forecast Value (2035): USD 404 billion
  • Ready-to-Finish Bakery Products Market Forecast CAGR: 4.5%
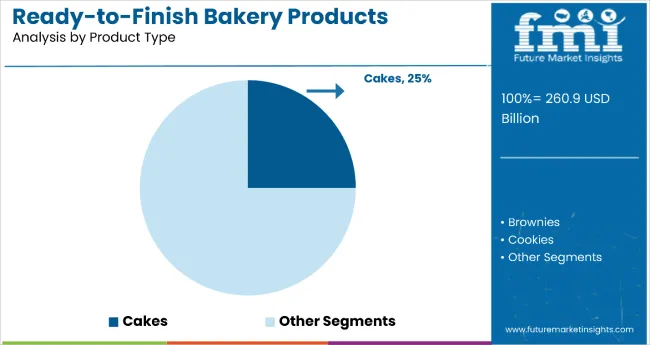
  • Leading Segment in Ready-to-Finish Bakery Products Market in 2025: Cakes (25% market share)
  • Key Growth Regions in Ready-to-Finish Bakery Products Market: North America, Europe, and Asia-Pacific
  • Top Key Players in Ready-to-Finish Bakery Products Market: Dawn Foods, Rich Products Corporation, Grupo Bimbo, Aryzta AG, Lantmannen Unibake, General Mills, Flowers Foods, Associated British Foods, Conagra Brands, Kellogg Company

Ready To Finish Bakery Products Market 2

Metric Value
Estimated Value in (2025E) USD 260.9 billion
Forecast Value in (2035F) USD 404 billion
Forecast CAGR (2025 to 2035) 4.5 %

The market is projected to add an absolute dollar opportunity of USD 143.1 billion over the forecast period. This reflects 1.57 times growth at a compound annual growth rate of 4.5%. The market's evolution is expected to be shaped by rising demand for convenience foods, expansion of the food service industry, and increasing consumer preference for premium baked goods that require minimal preparation time.

By 2030, the market is likely to reach approximately USD 338.7 billion, accounting for USD 70.9 billion in incremental value over the first half of the decade. The remaining USD 82.6 billion is expected during the second half, suggesting a moderately accelerated growth pattern. Product differentiation through healthier ingredients, organic formulations, and specialized dietary offerings is gaining traction due to consumers' evolving lifestyle preferences and increasing health consciousness.

Companies such as Dawn Foods and Rich Products Corporation are advancing their competitive positions through investment in frozen dough technologies and scalable production systems. Quality-led procurement models are supporting expansion into commercial bakeries, food service operations, and retail channels. Market performance will remain anchored in food safety standards, shelf-life optimization, and consistent product quality benchmarks.

The market holds approximately 42% of the convenience bakery segment, driven by time-saving benefits and consistent quality delivery in commercial and retail applications. It accounts for around 28% of the frozen bakery market, supported by advanced freezing technologies and extended shelf life capabilities. The market contributes nearly 15% to the overall bakery ingredients and supplies sector, particularly for establishments seeking labor-efficient solutions. It holds close to 22% of the food service bakery solutions market, where ready-to-finish products enable operators to serve freshly baked items with minimal skilled labor requirements. The share in the retail frozen food market reaches about 8%, reflecting growing consumer acceptance of premium frozen bakery products for home use.

The market is undergoing structural change driven by rising demand for labor-efficient bakery solutions and consistent product quality. Advanced processing methods using blast freezing technology and modified atmosphere packaging have enhanced product integrity, texture retention, and flavor preservation, making ready-to-finish products viable alternatives to scratch baking. Manufacturers are introducing portion-controlled formats and specialized formulations tailored for different end-use applications, expanding their role beyond traditional bakery operations. Strategic partnerships between food service distributors and ready-to-finish product suppliers have accelerated adoption in restaurants, cafes, and institutional feeding. Supply chain optimization has improved cold chain distribution networks, enabling wider market penetration and product availability.

Why is the Ready-to-Finish Bakery Products Market Growing?

Ready-to-finish bakery products' convenience factor, labor cost reduction benefits, and consistent quality output make them attractive alternatives to traditional scratch baking methods for commercial operations. Growing demand for premium bakery items in food service establishments, combined with skilled baker shortages, is driving adoption of ready-to-finish solutions that deliver artisanal quality with simplified preparation processes. Technological advances in freezing, packaging, and formulation have significantly improved product quality and shelf life capabilities.

As food service operations expand globally and consumer expectations for fresh-baked products increase, ready-to-finish bakery products are well-positioned to bridge the gap between convenience and quality. With operators prioritizing operational efficiency, food safety compliance, and menu consistency, ready-to-finish solutions provide scalable alternatives that support business growth without compromising product standards.

Segmental Analysis

The market is segmented by product, end-use, sales channel, and region. By product, it includes brownies, cakes, cookies, donuts, muffins, pastries, and other (such as tarts, croissants, and scones). Based on End-use, the market is divided into household consumption, hotels, restaurants & catering services, and others (institutional cafeterias and bakery training centers). Based on sales channel, the market is classified into B2B, B2C, supermarkets/hypermarkets, convenience stores, online stores, specialty stores, and others (such as vending machines and pop-up bakeries). Regionally, the market is analyzed across North America, Latin America, Western and Eastern Europe, Asia-Pacific, the Middle East and Africa.
By Product, Cakes Account for 25% of the Market Share

Ready To Finish Bakery Products Market By Product

The cakes segment accounts for a significant 25.0% share in the product category, underscoring its strong appeal among both individual consumers and commercial users seeking indulgent, customizable baked offerings. Ready-to-finish cakes are especially popular due to their versatility across multiple consumption occasions, including birthdays, celebrations, and everyday dessert indulgence.

This segment benefits from evolving consumer demand for convenience without compromising on freshness, as products can be quickly baked or decorated just before serving. Frozen or par-baked cakes allow for flexible inventory management while maintaining product quality, enabling retailers and food service providers to reduce waste and offer varied flavor profiles, portion sizes, and formats.

Manufacturers are investing in innovation through clean-label formulations, eggless and vegan options, and premium inclusions such as fruit fillings, chocolate ganache, and artisanal frostings. The segment continues to grow as consumers seek bakery-style quality at home, and businesses look to expand dessert menus without additional labor or overhead costs.
By End Use, the Household Consumption Segment holds a 55% Market Share

Ready To Finish Bakery Products Market By End Use

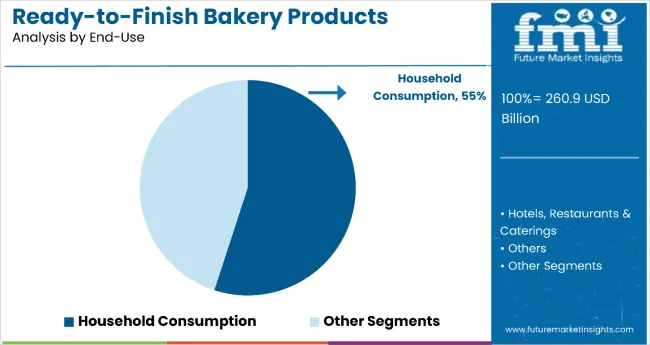
The household consumption segment leads the end-use category with a commanding 55.0% market share, reflecting the rise of at-home baking experiences and the demand for convenient yet high-quality baked goods. Consumers increasingly seek ready-to-finish products that offer the aroma and freshness of homemade baking with minimal preparation effort.

This segment has gained momentum due to changing lifestyle dynamics, particularly post-pandemic, where consumers favor in-home indulgence, family baking activities, and control over final product customization. Products like ready-to-bake cakes, muffins, and pastries provide the satisfaction of baking without requiring time-intensive preparation or technical skill.

Growth in this segment is supported by the expanding availability of ready-to-finish bakery items in modern retail, online grocery platforms, and direct-to-consumer channels. Manufacturers are enhancing their offerings with premium packaging, clear baking instructions, and allergen-friendly options to meet the preferences of health-conscious and convenience-driven consumers. As home baking continues to blur the line between retail and food service quality, the household consumption segment is expected to remain dominant.

What are the Drivers, Restraints, and Key Trends of the Ready-to-Finish Bakery Products Market?

From 2024 to 2025, food service operations adopted automation-compatible ready-to-finish products to streamline kitchen workflows, reduce preparation time, and maintain consistent output quality. This shift positions suppliers offering equipment-integrated solutions as key enablers of operational efficiency in commercial food preparation environments.

Labor Shortage Solutions Drive Ready-to-Finish Adoption

The persistent shortage of skilled bakers and increasing labor costs have been identified as primary catalysts for growth in the ready-to-finish bakery products market. In 2024, food service establishments faced significant challenges in recruiting and retaining qualified baking personnel, prompting widespread adoption of ready-to-finish solutions that require minimal specialized skills. By 2025, commercial kitchens will be increasingly equipped with ready-to-finish products that enable general kitchen staff to produce high-quality baked goods, reducing dependency on specialized labor while maintaining product standards.

These developments demonstrate that operational efficiency rather than cost reduction alone is driving market expansion. Manufacturers providing comprehensive training programs and equipment support alongside their ready-to-finish products are positioned to capture sustained demand from labor-constrained operations.

Automation Integration Creates Market Opportunities

In 2024, commercial kitchen equipment manufacturers began developing specialized ovens and preparation systems designed specifically for ready-to-finish bakery products, enabling fully automated baking processes with minimal manual intervention. By 2025, integrated solutions combining ready-to-finish products with smart cooking equipment were being deployed in high-volume operations to ensure consistent results and reduce operational complexity.

These implementations demonstrate that ready-to-finish products can evolve from convenience solutions to integral components of automated food preparation systems. Suppliers that offer products compatible with computerized equipment and provide integrated solutions are positioned to serve the growing market for technology-enhanced food service operations.
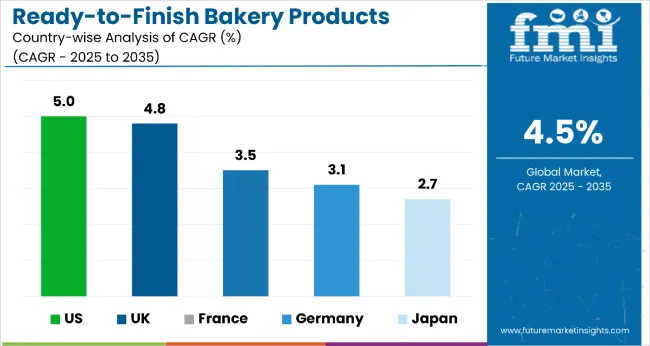
Analysis of Ready-to-Finish Bakery Products Market By Key Countries

Ready To Finish Bakery Products Market By Country

Countries CAGR
USA 5%
UK 4.8%
France 3.5%
Germany 3.1%
Japan 2.7%

In the ready-to-finish bakery products market, the USA leads growth projections with a robust CAGR of 5.0%, reflecting strong consumer demand for convenience and premium baked offerings. The UK follows at 4.8%, fueled by operational efficiencies post-Brexit and growing acceptance of frozen goods. France and Germany show moderate growth at 3.5% and 3.1%, respectively, with France balancing artisanal heritage and efficiency, while Germany’s industrial bakeries push adoption through private labels and cost savings. Japan lags slightly with a CAGR of 2.7%, shaped by a mature market focused on quality, portion control, and premium retail channels for baked goods.

The report covers an in-depth analysis of 40+ countries; five top performing OECD countries are highlighted below.

Future Outlook for Ready-to-Finish Bakery Products Market in the United States

Revenue from ready-to-finish bakery products in the USA is forecast to expand at a CAGR of 5.0% from 2025 to 2035, driven by rising consumer demand for convenience, premium quality, and clean-label bakery items. The retail and food service sectors increasingly rely on ready-to-finish solutions to optimize operations, minimize waste, and deliver consistent product quality. Quick-service restaurants, cafés, and grocery chains are expanding frozen and par-baked bakery lines to meet growing expectations for fresh-baked taste with minimal in-store preparation.

The widespread availability of advanced cold chain logistics and well-developed retail infrastructure enables efficient distribution across urban and suburban areas. Manufacturers are focusing on allergen-friendly and plant-based formulations to cater to evolving dietary trends.

  • Growing demand from QSRs and premium grocery retailers
  • Increasing adoption of plant-based and clean-label formulations
  • Advanced cold chain and logistics networks support national scalability

Growth Analysis of Ready-to-Finish Bakery Products Market in the United Kingdom

The ready-to-finish bakery products market in the UK is projected to grow at a CAGR of 4.8% through 2035, supported by the resurgence of the food service industry and increasing consumer familiarity with frozen and par-baked bakery items. Labor shortages and rising wage costs post-Brexit have led commercial kitchens and retail bakeries to adopt ready-to-finish solutions that reduce dependency on skilled bakers.

Retailers are offering more premium frozen options in both private label and branded formats. At the same time, cafes and casual dining chains introduce ready-to-bake pastries and breads to expand menus cost-effectively. Health-conscious formulations, such as high-fiber or reduced-sugar options, are seeing increased uptake.

  • Operational efficiency key for post-Brexit labor-limited businesses
  • Health-oriented premium products driving retail segment growth
  • Frozen baked goods are gaining trust and shelf space in major supermarkets

Market Integration in the Ready-to-Finish Bakery Products Market in France

Revenue from ready-to-finish bakery products in France is anticipated to rise at a modest CAGR of 3.5% between 2025 and 2035, shaped by its deep-rooted artisanal baking culture. However, commercial operations, particularly in urban centers, are increasingly adopting ready-to-finish bakery solutions to balance tradition with modern efficiency.

Par-baked baguettes, croissants, and viennoi series are widely used in hotels, cafés, and institutional settings where consistency, speed, and quality are paramount. Domestic manufacturers are innovating with formulations that retain traditional textures and flavor profiles post-baking. Despite cultural resistance to frozen products, premiumization and ingredient transparency have improved consumer perception.

  • Artisanal-style frozen products are achieving wider acceptance
  • Operational streamlining in the food service sector boosts adoption
  • Product quality preservation is critical to consumer buy-in

Demand Forecast for Ready-to-Finish Bakery Products Market in Germany

Sales of ready-to-finish bakery products in Germany are projected to flourish at a CAGR of 3.1% during the forecast period, supported by modernization in the industrial bakery sector and demand for consistency across commercial food service outlets. The country’s strong retail and logistics infrastructure enables efficient frozen food distribution nationwide.

Demand is largely driven by private label offerings, discount supermarket chains, and institutional catering companies seeking cost-efficient solutions. German consumers favor premium-quality bakery items, pushing manufacturers to develop better-for-you products with organic, vegan, and gluten-free positioning.

  • Discount retailers and private labels lead frozen bakery sales
  • Industrial bakeries adopt ready-to-finish to reduce complexity
  • Premiumization and health-conscious trends drive product innovation

Ready-to-Finish Bakery Products Market Analysis in Japan

The ready-to-finish bakery products market in Japan is expected to grow at a CAGR of 2.7% from 2025 to 2035, reflecting a mature yet quality-driven landscape. Urbanization and smaller household sizes have led to greater demand for conveniently packaged, portion-controlled frozen bakery goods.

Frozen pastries and cakes dominate the segment, driven by consumer expectations for high visual and taste quality. Department stores and gourmet retailers are key distribution points for premium offerings, while home baking trends support demand for ready-to-bake mixes. Despite relatively slow growth, innovation in packaging, flavor, and texture preservation ensures continued market relevance.

  • Sophisticated consumer base supports premium product demand
  • Department stores and specialty retailers dominate distribution
  • Home baking trend reinforces demand for smaller pack, high-quality mixes

Competitive Landscape of Ready-to-Finish Bakery Products Market

The ready-to-finish bakery products market is moderately consolidated, featuring established food processing companies with strong distribution networks and specialized product portfolios. Dawn Foods and Rich Products Corporation lead through comprehensive product ranges, technical support services, and established relationships with commercial bakeries and food service operations.

Grupo Bimbo and Associated British Foods leverage global manufacturing capabilities and distribution networks to serve diverse market segments. Aryzta AG and Lantmannen Unibake focus on premium product development and European market leadership through quality positioning and innovation capabilities.

Regional players such as General Mills and Flowers Foods maintain strong domestic positions through brand recognition and distribution advantages. The market structure supports both global suppliers and specialized regional producers, with competition based on product quality, technical support, and supply chain reliability.

Entry barriers include significant capital requirements for specialized production facilities, regulatory compliance needs, and established customer relationships that favor incumbent suppliers. Success factors include product innovation capabilities, cold chain distribution networks, and technical support services that help customers optimize product utilization.

Scope of the Report

Item Value
Quantitative Units USD 260.9 Billion
Product Brownies, Cakes, Cookies, Donuts, Muffins, Pastries, a nd Other Baked Goods
End-use Household Consumption, Hotels, Restaurants & Catering Services, a nd Others
Sales Channel B2b, B2c, Supermarkets/Hypermarkets, Convenience Stores, Online Stores, Specialty Stores, a nd Others
Regions Covered North America, Europe, Asia-Pacific, Latin America, Oceania, Middle East & Africa
Country Covered United States, Canada, Germany, France, United Kingdom, China, Japan, India, Brazil, South Africa, Australia, and 40 + countries
Key Companies Profiled Dawn Foods, Rich Products Corporation, Grupo Bimbo, Aryzta AG, Lantmannen Unibake, General Mills, Flowers Foods, Associated British Foods, Conagra Brands, and Kellogg Company
Additional Attributes Dollar sales by product category and end-use application, regional demand trends, competitive landscape, operational efficiency benefits, integration with commercial kitchen equipment, innovations in freezing technology and product formulations for enhanced quality and convenience

Key Segments

By Product:

  • Brownies
  • Cakes
  • Cookies
  • Donuts
  • Muffins
  • Pastry
  • Others

By End-Use:

  • Household Consumption
  • Hotels, Restaurants & Caterings
  • Others

By Sales Channel:

  • B2B
  • B2C
  • Supermarkets/Hypermarkets
  • Convenience Store
  • Online Stores
  • Specialty Store
  • Others

By Region:

  • North America
  • Latin America
  • Western Europe
  • Eastern Europe
  • East Asia
  • South Asia & Pacific
  • Middle East and Africa

Table of Content

  1. Executive Summary
    • Global Market Outlook
    • Demand-side Trends
    • Supply-side Trends
    • Technology Roadmap Analysis
    • Analysis and Recommendations
  2. Market Overview
    • Market Coverage / Taxonomy
    • Market Definition / Scope / Limitations
  3. Market Background
    • Market Dynamics
      • Drivers
      • Restraints
      • Opportunity
      • Trends
    • Scenario Forecast
      • Demand in Optimistic Scenario
      • Demand in Likely Scenario
      • Demand in Conservative Scenario
    • Opportunity Map Analysis
    • Product Life Cycle Analysis
    • Supply Chain Analysis
      • Supply Side Participants and their Roles
        • Producers
        • Mid-Level Participants (Traders/ Agents/ Brokers)
        • Wholesalers and Distributors
      • Value Added and Value Created at Node in the Supply Chain
      • List of Raw Material Suppliers
      • List of Existing and Potential Buyer’s
    • Investment Feasibility Matrix
    • Value Chain Analysis
      • Profit Margin Analysis
      • Wholesalers and Distributors
      • Retailers
    • PESTLE and Porter’s Analysis
    • Regulatory Landscape
      • By Key Regions
      • By Key Countries
    • Regional Parent Market Outlook
    • Production and Consumption Statistics
    • Import and Export Statistics
  4. Global Market Analysis 2020 to 2024 and Forecast, 2025 to 2035
    • Historical Market Size Value (USD Billion) & Volume (Metric Tons) Analysis, 2020 to 2024
    • Current and Future Market Size Value (USD Billion) & Volume (Metric Tons) Projections, 2025 to 2035
      • Y-o-Y Growth Trend Analysis
      • Absolute $ Opportunity Analysis
  5. Global Market Pricing Analysis 2020 to 2024 and Forecast 2025 to 2035
  6. Global Market Analysis 2020 to 2024 and Forecast 2025 to 2035, By Product
    • Introduction / Key Findings
    • Historical Market Size Value (USD Billion) & Volume (Metric Tons) Analysis By Product, 2020 to 2024
    • Current and Future Market Size Value (USD Billion) & Volume (Metric Tons) Analysis and Forecast By Product, 2025 to 2035
      • Brownies
      • Cakes
      • Cookies
      • Donuts
      • Muffins
      • Pastry
      • Others
    • Y-o-Y Growth Trend Analysis By Product, 2020 to 2024
    • Absolute $ Opportunity Analysis By Product, 2025 to 2035
  7. Global Market Analysis 2020 to 2024 and Forecast 2025 to 2035, By End-Use
    • Introduction / Key Findings
    • Historical Market Size Value (USD Billion) & Volume (Metric Tons) Analysis By End-Use, 2020 to 2024
    • Current and Future Market Size Value (USD Billion) & Volume (Metric Tons) Analysis and Forecast By End-Use, 2025 to 2035
      • Household Consumption
      • Hotels, Restaurants & Caterings
      • Others
    • Y-o-Y Growth Trend Analysis By End-Use, 2020 to 2024
    • Absolute $ Opportunity Analysis By End-Use, 2025 to 2035
  8. Global Market Analysis 2020 to 2024 and Forecast 2025 to 2035, By Sales Channel
    • Introduction / Key Findings
    • Historical Market Size Value (USD Billion) & Volume (Metric Tons) Analysis By Sales Channel, 2020 to 2024
    • Current and Future Market Size Value (USD Billion) & Volume (Metric Tons) Analysis and Forecast By Sales Channel, 2025 to 2035
      • B2B
      • B2C
      • Supermarkets/Hypermarkets
      • Convenience Store
      • Online Stores
      • Specialty Store
      • Others
    • Y-o-Y Growth Trend Analysis By Sales Channel, 2020 to 2024
    • Absolute $ Opportunity Analysis By Sales Channel, 2025 to 2035
  9. Global Market Analysis 2020 to 2024 and Forecast 2025 to 2035, By Region
    • Introduction
    • Historical Market Size Value (USD Billion) & Volume (Metric Tons) Analysis By Region, 2020 to 2024
    • Current Market Size Value (USD Billion) & Volume (Metric Tons) Analysis and Forecast By Region, 2025 to 2035
      • North America
      • Latin America
      • Western Europe
      • Eastern Europe
      • East Asia
      • South Asia & Pacific
      • Middle East and Africa
    • Market Attractiveness Analysis By Region
  10. North America Market Analysis 2020 to 2024 and Forecast 2025 to 2035, By Country
    • Historical Market Size Value (USD Billion) & Volume (Metric Tons) Trend Analysis By Market Taxonomy, 2020 to 2024
    • Market Size Value (USD Billion) & Volume (Metric Tons) Forecast By Market Taxonomy, 2025 to 2035
      • By Country
        • USA
        • Canada
        • Mexico
      • By Product
      • By End-Use
      • By Sales Channel
    • Market Attractiveness Analysis
      • By Country
      • By Product
      • By End-Use
      • By Sales Channel
    • Key Takeaways
  11. Latin America Market Analysis 2020 to 2024 and Forecast 2025 to 2035, By Country
    • Historical Market Size Value (USD Billion) & Volume (Metric Tons) Trend Analysis By Market Taxonomy, 2020 to 2024
    • Market Size Value (USD Billion) & Volume (Metric Tons) Forecast By Market Taxonomy, 2025 to 2035
      • By Country
        • Brazil
        • Argentina
        • Rest of LATAM
      • By Product
      • By End-Use
      • By Sales Channel
    • Market Attractiveness Analysis
      • By Country
      • By Product
      • By End-Use
      • By Sales Channel
    • Key Takeaways
  12. Western Europe Market Analysis 2020 to 2024 and Forecast 2025 to 2035, By Country
    • Historical Market Size Value (USD Billion) & Volume (Metric Tons) Trend Analysis By Market Taxonomy, 2020 to 2024
    • Market Size Value (USD Billion) & Volume (Metric Tons) Forecast By Market Taxonomy, 2025 to 2035
      • By Country
        • Germany
        • Italy
        • France
        • UK
        • Spain
        • BENELUX
        • Nordic
        • Rest of W.Europe
      • By Product
      • By End-Use
      • By Sales Channel
    • Market Attractiveness Analysis
      • By Country
      • By Product
      • By End-Use
      • By Sales Channel
    • Key Takeaways
  13. Eastern Europe Market Analysis 2020 to 2024 and Forecast 2025 to 2035, By Country
    • Historical Market Size Value (USD Billion) & Volume (Metric Tons) Trend Analysis By Market Taxonomy, 2020 to 2024
    • Market Size Value (USD Billion) & Volume (Metric Tons) Forecast By Market Taxonomy, 2025 to 2035
      • By Country
        • Russia
        • Hungary
        • Poland
        • Balkan & Baltics
        • Rest of E. Europe
      • By Product
      • By End-Use
      • By Sales Channel
    • Market Attractiveness Analysis
      • By Country
      • By Product
      • By End-Use
      • By Sales Channel
    • Key Takeaways
  14. East Asia Market Analysis 2020 to 2024 and Forecast 2025 to 2035, By Country
    • Historical Market Size Value (USD Billion) & Volume (Metric Tons) Trend Analysis By Market Taxonomy, 2020 to 2024
    • Market Size Value (USD Billion) & Volume (Metric Tons) Forecast By Market Taxonomy, 2025 to 2035
      • By Country
        • China
        • Japan
        • South Korea
      • By Product
      • By End-Use
      • By Sales Channel
    • Market Attractiveness Analysis
      • By Country
      • By Product
      • By End-Use
      • By Sales Channel
    • Key Takeaways
  15. South Asia & Pacific Market Analysis 2020 to 2024 and Forecast 2025 to 2035, By Country
    • Historical Market Size Value (USD Billion) & Volume (Metric Tons) Trend Analysis By Market Taxonomy, 2020 to 2024
    • Market Size Value (USD Billion) & Volume (Metric Tons) Forecast By Market Taxonomy, 2025 to 2035
      • By Country
        • India
        • Australia & New Zealand
        • ASEAN
        • Rest of SAP
      • By Product
      • By End-Use
      • By Sales Channel
    • Market Attractiveness Analysis
      • By Country
      • By Product
      • By End-Use
      • By Sales Channel
    • Key Takeaways
  16. Middle East and Africa Market Analysis 2020 to 2024 and Forecast 2025 to 2035, By Country
    • Historical Market Size Value (USD Billion) & Volume (Metric Tons) Trend Analysis By Market Taxonomy, 2020 to 2024
    • Market Size Value (USD Billion) & Volume (Metric Tons) Forecast By Market Taxonomy, 2025 to 2035
      • By Country
        • GCC Countries
        • Northern Africa
        • South Africa
        • Turkiye
        • Rest of MEA
      • By Product
      • By End-Use
      • By Sales Channel
    • Market Attractiveness Analysis
      • By Country
      • By Product
      • By End-Use
      • By Sales Channel
    • Key Takeaways
  17. Key Countries Market Analysis
    • USA
      • Pricing Analysis
      • Market Share Analysis, 2024
        • By Product
        • By End-Use
        • By Sales Channel
    • Canada
      • Pricing Analysis
      • Market Share Analysis, 2024
        • By Product
        • By End-Use
        • By Sales Channel
    • Brazil
      • Pricing Analysis
      • Market Share Analysis, 2024
        • By Product
        • By End-Use
        • By Sales Channel
    • Mexico
      • Pricing Analysis
      • Market Share Analysis, 2024
        • By Product
        • By End-Use
        • By Sales Channel
    • Argentina
      • Pricing Analysis
      • Market Share Analysis, 2024
        • By Product
        • By End-Use
        • By Sales Channel
  18. Market Structure Analysis
    • Competition Dashboard
    • Competition Benchmarking
    • Market Share Analysis of Top Players
      • By Regional
      • By Product
      • By End-Use
      • By Sales Channel
  19. Competition Analysis
    • Competition Deep Dive
      • Dawn food products Inc.
        • Overview
        • Product Portfolio
        • Profitability by Market Segments (Product/Age /Sales Channel/Region)
        • Sales Footprint
        • Strategy Overview
          • Marketing Strategy
          • Product Strategy
          • Channel Strategy
      • Trenker Bakery
        • Overview
        • Product Portfolio
        • Profitability by Market Segments (Product/Age /Sales Channel/Region)
        • Sales Footprint
        • Strategy Overview
          • Marketing Strategy
          • Product Strategy
          • Channel Strategy
      • Rich Products Incorporation
        • Overview
        • Product Portfolio
        • Profitability by Market Segments (Product/Age /Sales Channel/Region)
        • Sales Footprint
        • Strategy Overview
          • Marketing Strategy
          • Product Strategy
          • Channel Strategy
      • Associated British Foods plc
        • Overview
        • Product Portfolio
        • Profitability by Market Segments (Product/Age /Sales Channel/Region)
        • Sales Footprint
        • Strategy Overview
          • Marketing Strategy
          • Product Strategy
          • Channel Strategy
      • Bimbo Group S.A.B. de C.V.
        • Overview
        • Product Portfolio
        • Profitability by Market Segments (Product/Age /Sales Channel/Region)
        • Sales Footprint
        • Strategy Overview
          • Marketing Strategy
          • Product Strategy
          • Channel Strategy
      • Aryzta AG
        • Overview
        • Product Portfolio
        • Profitability by Market Segments (Product/Age /Sales Channel/Region)
        • Sales Footprint
        • Strategy Overview
          • Marketing Strategy
          • Product Strategy
          • Channel Strategy
      • Lantmannen Unibake International
        • Overview
        • Product Portfolio
        • Profitability by Market Segments (Product/Age /Sales Channel/Region)
        • Sales Footprint
        • Strategy Overview
          • Marketing Strategy
          • Product Strategy
          • Channel Strategy
      • Europastry
        • Overview
        • Product Portfolio
        • Profitability by Market Segments (Product/Age /Sales Channel/Region)
        • Sales Footprint
        • Strategy Overview
          • Marketing Strategy
          • Product Strategy
          • Channel Strategy
      • S.A.
        • Overview
        • Product Portfolio
        • Profitability by Market Segments (Product/Age /Sales Channel/Region)
        • Sales Footprint
        • Strategy Overview
          • Marketing Strategy
          • Product Strategy
          • Channel Strategy
      • Conagra Brands, Inc.
        • Overview
        • Product Portfolio
        • Profitability by Market Segments (Product/Age /Sales Channel/Region)
        • Sales Footprint
        • Strategy Overview
          • Marketing Strategy
          • Product Strategy
          • Channel Strategy
      • General Mills Inc.
        • Overview
        • Product Portfolio
        • Profitability by Market Segments (Product/Age /Sales Channel/Region)
        • Sales Footprint
        • Strategy Overview
          • Marketing Strategy
          • Product Strategy
          • Channel Strategy
      • Kellogg Company
        • Overview
        • Product Portfolio
        • Profitability by Market Segments (Product/Age /Sales Channel/Region)
        • Sales Footprint
        • Strategy Overview
          • Marketing Strategy
          • Product Strategy
          • Channel Strategy
      • Premier Foods plc
        • Overview
        • Product Portfolio
        • Profitability by Market Segments (Product/Age /Sales Channel/Region)
        • Sales Footprint
        • Strategy Overview
          • Marketing Strategy
          • Product Strategy
          • Channel Strategy
      • Vandemoortele NV
        • Overview
        • Product Portfolio
        • Profitability by Market Segments (Product/Age /Sales Channel/Region)
        • Sales Footprint
        • Strategy Overview
          • Marketing Strategy
          • Product Strategy
          • Channel Strategy
  20. Assumptions & Acronyms Used
  21. Research Methodology

List of Tables

  • Table 1: Global Market Value (USD Billion) Forecast by Region, 2020-2035
  • Table 2: Global Market Volume (Metric Tons) Forecast by Region, 2020-2035
  • Table 3: Global Market Value (USD Billion) Forecast by Product, 2020-2035
  • Table 4: Global Market Volume (Metric Tons) Forecast by Product, 2020-2035
  • Table 5: Global Market Value (USD Billion) Forecast by End-Use, 2020-2035
  • Table 6: Global Market Volume (Metric Tons) Forecast by End-Use, 2020-2035
  • Table 7: Global Market Value (USD Billion) Forecast by Sales Channel, 2020-2035
  • Table 8: Global Market Volume (Metric Tons) Forecast by Sales Channel, 2020-2035
  • Table 9: North America Market Value (USD Billion) Forecast by Country, 2020-2035
  • Table 10: North America Market Volume (Metric Tons) Forecast by Country, 2020-2035
  • Table 11: North America Market Value (USD Billion) Forecast by Product, 2020-2035
  • Table 12: North America Market Volume (Metric Tons) Forecast by Product, 2020-2035
  • Table 13: North America Market Value (USD Billion) Forecast by End-Use, 2020-2035
  • Table 14: North America Market Volume (Metric Tons) Forecast by End-Use, 2020-2035
  • Table 15: North America Market Value (USD Billion) Forecast by Sales Channel, 2020-2035
  • Table 16: North America Market Volume (Metric Tons) Forecast by Sales Channel, 2020-2035
  • Table 17: Latin America Market Value (USD Billion) Forecast by Country, 2020-2035
  • Table 18: Latin America Market Volume (Metric Tons) Forecast by Country, 2020-2035
  • Table 19: Latin America Market Value (USD Billion) Forecast by Product, 2020-2035
  • Table 20: Latin America Market Volume (Metric Tons) Forecast by Product, 2020-2035
  • Table 21: Latin America Market Value (USD Billion) Forecast by End-Use, 2020-2035
  • Table 22: Latin America Market Volume (Metric Tons) Forecast by End-Use, 2020-2035
  • Table 23: Latin America Market Value (USD Billion) Forecast by Sales Channel, 2020-2035
  • Table 24: Latin America Market Volume (Metric Tons) Forecast by Sales Channel, 2020-2035
  • Table 25: Western Europe Market Value (USD Billion) Forecast by Country, 2020-2035
  • Table 26: Western Europe Market Volume (Metric Tons) Forecast by Country, 2020-2035
  • Table 27: Western Europe Market Value (USD Billion) Forecast by Product, 2020-2035
  • Table 28: Western Europe Market Volume (Metric Tons) Forecast by Product, 2020-2035
  • Table 29: Western Europe Market Value (USD Billion) Forecast by End-Use, 2020-2035
  • Table 30: Western Europe Market Volume (Metric Tons) Forecast by End-Use, 2020-2035
  • Table 31: Western Europe Market Value (USD Billion) Forecast by Sales Channel, 2020-2035
  • Table 32: Western Europe Market Volume (Metric Tons) Forecast by Sales Channel, 2020-2035
  • Table 33: Eastern Europe Market Value (USD Billion) Forecast by Country, 2020-2035
  • Table 34: Eastern Europe Market Volume (Metric Tons) Forecast by Country, 2020-2035
  • Table 35: Eastern Europe Market Value (USD Billion) Forecast by Product, 2020-2035
  • Table 36: Eastern Europe Market Volume (Metric Tons) Forecast by Product, 2020-2035
  • Table 37: Eastern Europe Market Value (USD Billion) Forecast by End-Use, 2020-2035
  • Table 38: Eastern Europe Market Volume (Metric Tons) Forecast by End-Use, 2020-2035
  • Table 39: Eastern Europe Market Value (USD Billion) Forecast by Sales Channel, 2020-2035
  • Table 40: Eastern Europe Market Volume (Metric Tons) Forecast by Sales Channel, 2020-2035
  • Table 41: East Asia Market Value (USD Billion) Forecast by Country, 2020-2035
  • Table 42: East Asia Market Volume (Metric Tons) Forecast by Country, 2020-2035
  • Table 43: East Asia Market Value (USD Billion) Forecast by Product, 2020-2035
  • Table 44: East Asia Market Volume (Metric Tons) Forecast by Product, 2020-2035
  • Table 45: East Asia Market Value (USD Billion) Forecast by End-Use, 2020-2035
  • Table 46: East Asia Market Volume (Metric Tons) Forecast by End-Use, 2020-2035
  • Table 47: East Asia Market Value (USD Billion) Forecast by Sales Channel, 2020-2035
  • Table 48: East Asia Market Volume (Metric Tons) Forecast by Sales Channel, 2020-2035
  • Table 49: South Asia & Pacific Market Value (USD Billion) Forecast by Country, 2020-2035
  • Table 50: South Asia & Pacific Market Volume (Metric Tons) Forecast by Country, 2020-2035
  • Table 51: South Asia & Pacific Market Value (USD Billion) Forecast by Product, 2020-2035
  • Table 52: South Asia & Pacific Market Volume (Metric Tons) Forecast by Product, 2020-2035
  • Table 53: South Asia & Pacific Market Value (USD Billion) Forecast by End-Use, 2020-2035
  • Table 54: South Asia & Pacific Market Volume (Metric Tons) Forecast by End-Use, 2020-2035
  • Table 55: South Asia & Pacific Market Value (USD Billion) Forecast by Sales Channel, 2020-2035
  • Table 56: South Asia & Pacific Market Volume (Metric Tons) Forecast by Sales Channel, 2020-2035
  • Table 57: Middle East and Africa Market Value (USD Billion) Forecast by Country, 2020-2035
  • Table 58: Middle East and Africa Market Volume (Metric Tons) Forecast by Country, 2020-2035
  • Table 59: Middle East and Africa Market Value (USD Billion) Forecast by Product, 2020-2035
  • Table 60: Middle East and Africa Market Volume (Metric Tons) Forecast by Product, 2020-2035
  • Table 61: Middle East and Africa Market Value (USD Billion) Forecast by End-Use, 2020-2035
  • Table 62: Middle East and Africa Market Volume (Metric Tons) Forecast by End-Use, 2020-2035
  • Table 63: Middle East and Africa Market Value (USD Billion) Forecast by Sales Channel, 2020-2035
  • Table 64: Middle East and Africa Market Volume (Metric Tons) Forecast by Sales Channel, 2020-2035

List of Figures

  • Figure 1: Global Market Volume (Metric Tons) Forecast 2020-2035
  • Figure 2: Global Market Pricing Analysis
  • Figure 3: Global Market Value (USD Billion) Forecast 2020-2035
  • Figure 4: Global Market Value Share and BPS Analysis by Product, 2025 and 2035
  • Figure 5: Global Market Y-o-Y Growth Comparison by Product, 2025-2035
  • Figure 6: Global Market Attractiveness Analysis by Product
  • Figure 7: Global Market Value Share and BPS Analysis by End-Use, 2025 and 2035
  • Figure 8: Global Market Y-o-Y Growth Comparison by End-Use, 2025-2035
  • Figure 9: Global Market Attractiveness Analysis by End-Use
  • Figure 10: Global Market Value Share and BPS Analysis by Sales Channel, 2025 and 2035
  • Figure 11: Global Market Y-o-Y Growth Comparison by Sales Channel, 2025-2035
  • Figure 12: Global Market Attractiveness Analysis by Sales Channel
  • Figure 13: Global Market Value (USD Billion) Share and BPS Analysis by Region, 2025 and 2035
  • Figure 14: Global Market Y-o-Y Growth Comparison by Region, 2025-2035
  • Figure 15: Global Market Attractiveness Analysis by Region
  • Figure 16: North America Market Incremental $ Opportunity, 2025-2035
  • Figure 17: Latin America Market Incremental $ Opportunity, 2025-2035
  • Figure 18: Western Europe Market Incremental $ Opportunity, 2025-2035
  • Figure 19: Eastern Europe Market Incremental $ Opportunity, 2025-2035
  • Figure 20: East Asia Market Incremental $ Opportunity, 2025-2035
  • Figure 21: South Asia & Pacific Market Incremental $ Opportunity, 2025-2035
  • Figure 22: Middle East and Africa Market Incremental $ Opportunity, 2025-2035
  • Figure 23: North America Market Value Share and BPS Analysis by Country, 2025 and 2035
  • Figure 24: North America Market Value Share and BPS Analysis by Product, 2025 and 2035
  • Figure 25: North America Market Y-o-Y Growth Comparison by Product, 2025-2035
  • Figure 26: North America Market Attractiveness Analysis by Product
  • Figure 27: North America Market Value Share and BPS Analysis by End-Use, 2025 and 2035
  • Figure 28: North America Market Y-o-Y Growth Comparison by End-Use, 2025-2035
  • Figure 29: North America Market Attractiveness Analysis by End-Use
  • Figure 30: North America Market Value Share and BPS Analysis by Sales Channel, 2025 and 2035
  • Figure 31: North America Market Y-o-Y Growth Comparison by Sales Channel, 2025-2035
  • Figure 32: North America Market Attractiveness Analysis by Sales Channel
  • Figure 33: Latin America Market Value Share and BPS Analysis by Country, 2025 and 2035
  • Figure 34: Latin America Market Value Share and BPS Analysis by Product, 2025 and 2035
  • Figure 35: Latin America Market Y-o-Y Growth Comparison by Product, 2025-2035
  • Figure 36: Latin America Market Attractiveness Analysis by Product
  • Figure 37: Latin America Market Value Share and BPS Analysis by End-Use, 2025 and 2035
  • Figure 38: Latin America Market Y-o-Y Growth Comparison by End-Use, 2025-2035
  • Figure 39: Latin America Market Attractiveness Analysis by End-Use
  • Figure 40: Latin America Market Value Share and BPS Analysis by Sales Channel, 2025 and 2035
  • Figure 41: Latin America Market Y-o-Y Growth Comparison by Sales Channel, 2025-2035
  • Figure 42: Latin America Market Attractiveness Analysis by Sales Channel
  • Figure 43: Western Europe Market Value Share and BPS Analysis by Country, 2025 and 2035
  • Figure 44: Western Europe Market Value Share and BPS Analysis by Product, 2025 and 2035
  • Figure 45: Western Europe Market Y-o-Y Growth Comparison by Product, 2025-2035
  • Figure 46: Western Europe Market Attractiveness Analysis by Product
  • Figure 47: Western Europe Market Value Share and BPS Analysis by End-Use, 2025 and 2035
  • Figure 48: Western Europe Market Y-o-Y Growth Comparison by End-Use, 2025-2035
  • Figure 49: Western Europe Market Attractiveness Analysis by End-Use
  • Figure 50: Western Europe Market Value Share and BPS Analysis by Sales Channel, 2025 and 2035
  • Figure 51: Western Europe Market Y-o-Y Growth Comparison by Sales Channel, 2025-2035
  • Figure 52: Western Europe Market Attractiveness Analysis by Sales Channel
  • Figure 53: Eastern Europe Market Value Share and BPS Analysis by Country, 2025 and 2035
  • Figure 54: Eastern Europe Market Value Share and BPS Analysis by Product, 2025 and 2035
  • Figure 55: Eastern Europe Market Y-o-Y Growth Comparison by Product, 2025-2035
  • Figure 56: Eastern Europe Market Attractiveness Analysis by Product
  • Figure 57: Eastern Europe Market Value Share and BPS Analysis by End-Use, 2025 and 2035
  • Figure 58: Eastern Europe Market Y-o-Y Growth Comparison by End-Use, 2025-2035
  • Figure 59: Eastern Europe Market Attractiveness Analysis by End-Use
  • Figure 60: Eastern Europe Market Value Share and BPS Analysis by Sales Channel, 2025 and 2035
  • Figure 61: Eastern Europe Market Y-o-Y Growth Comparison by Sales Channel, 2025-2035
  • Figure 62: Eastern Europe Market Attractiveness Analysis by Sales Channel
  • Figure 63: East Asia Market Value Share and BPS Analysis by Country, 2025 and 2035
  • Figure 64: East Asia Market Value Share and BPS Analysis by Product, 2025 and 2035
  • Figure 65: East Asia Market Y-o-Y Growth Comparison by Product, 2025-2035
  • Figure 66: East Asia Market Attractiveness Analysis by Product
  • Figure 67: East Asia Market Value Share and BPS Analysis by End-Use, 2025 and 2035
  • Figure 68: East Asia Market Y-o-Y Growth Comparison by End-Use, 2025-2035
  • Figure 69: East Asia Market Attractiveness Analysis by End-Use
  • Figure 70: East Asia Market Value Share and BPS Analysis by Sales Channel, 2025 and 2035
  • Figure 71: East Asia Market Y-o-Y Growth Comparison by Sales Channel, 2025-2035
  • Figure 72: East Asia Market Attractiveness Analysis by Sales Channel
  • Figure 73: South Asia & Pacific Market Value Share and BPS Analysis by Country, 2025 and 2035
  • Figure 74: South Asia & Pacific Market Value Share and BPS Analysis by Product, 2025 and 2035
  • Figure 75: South Asia & Pacific Market Y-o-Y Growth Comparison by Product, 2025-2035
  • Figure 76: South Asia & Pacific Market Attractiveness Analysis by Product
  • Figure 77: South Asia & Pacific Market Value Share and BPS Analysis by End-Use, 2025 and 2035
  • Figure 78: South Asia & Pacific Market Y-o-Y Growth Comparison by End-Use, 2025-2035
  • Figure 79: South Asia & Pacific Market Attractiveness Analysis by End-Use
  • Figure 80: South Asia & Pacific Market Value Share and BPS Analysis by Sales Channel, 2025 and 2035
  • Figure 81: South Asia & Pacific Market Y-o-Y Growth Comparison by Sales Channel, 2025-2035
  • Figure 82: South Asia & Pacific Market Attractiveness Analysis by Sales Channel
  • Figure 83: Middle East and Africa Market Value Share and BPS Analysis by Country, 2025 and 2035
  • Figure 84: Middle East and Africa Market Value Share and BPS Analysis by Product, 2025 and 2035
  • Figure 85: Middle East and Africa Market Y-o-Y Growth Comparison by Product, 2025-2035
  • Figure 86: Middle East and Africa Market Attractiveness Analysis by Product
  • Figure 87: Middle East and Africa Market Value Share and BPS Analysis by End-Use, 2025 and 2035
  • Figure 88: Middle East and Africa Market Y-o-Y Growth Comparison by End-Use, 2025-2035
  • Figure 89: Middle East and Africa Market Attractiveness Analysis by End-Use
  • Figure 90: Middle East and Africa Market Value Share and BPS Analysis by Sales Channel, 2025 and 2035
  • Figure 91: Middle East and Africa Market Y-o-Y Growth Comparison by Sales Channel, 2025-2035
  • Figure 92: Middle East and Africa Market Attractiveness Analysis by Sales Channel
  • Figure 93: Global Market - Tier Structure Analysis
  • Figure 94: Global Market - Company Share Analysis

Frequently Asked Questions

How big is the ready-to-finish bakery products market in 2025?

The global ready-to-finish bakery products market is estimated to be valued at USD 260.9 billion in 2025.

What will be the size of the ready-to-finish bakery products market in 2035?

The market size for the ready-to-finish bakery products market is projected to reach USD 404 billion by 2035.

How much will the ready-to-finish bakery products market grow between 2025 and 2035?

The ready-to-finish bakery products market is expected to grow at a 4.5% CAGR between 2025 and 2035.

Which product type will be the leading segment in the ready-to-finish bakery products market?

The cakes segment will dominate with 25% of the market share in the ready-to-finish bakery products market.

Which end-use segment is expected to contribute a significant share to the ready-to-finish bakery products market in 2025?

In terms of end-use, the household consumption segment is expected to command a 55% share in the ready-to-finish bakery products market in 2025.

Explore Similar Insights

Future Market Insights

Ready-to-Finish Bakery Products Market

Chat With MaRIA

Chat With

MaRIA

Hi There, I am MaRIA, Your Market Research Intelligence Assistant. How may I help you?