
- Market Size (2026)
- USD 482.5 Mn
- Forecast (2036)
- USD 1420.2 Mn
- CAGR (2026 to 2036)
- 11.4%
How big is Scones Market in 2026?
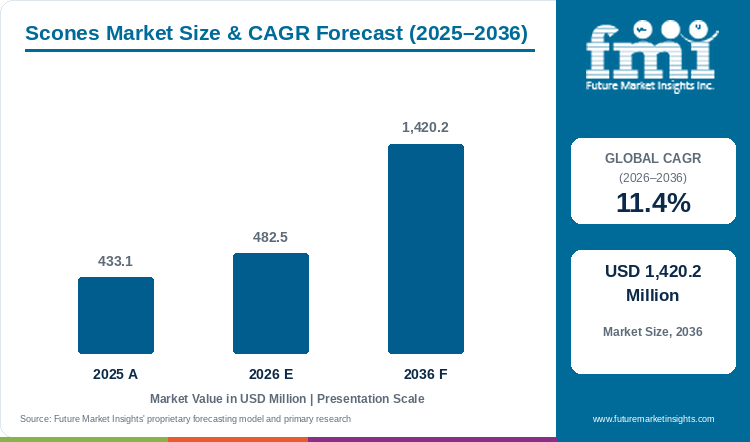
Having recorded a market size of USD 433.1 million in 2025 and moving to USD 482.5 million in 2026, the scones market is projected to scale up to USD 1,420.2 million by the end of 2036, maintaining an 11.4% CAGR.
Steady consumer habit around morning coffee pairings and afternoon tea occasions is supporting repeat orders for finished scones across supermarket bakeries and café chains. October 2026 retail food analysis compiled by U.S. agricultural attachés in London valued United Kingdom grocery retail demand at USD 343,000 million in 2026, with private-label bakery lines capturing 52.2% of shopper baskets as households seek affordable at-home treats. Café managers also order pre-baked frozen scones so staff can thaw only what each day requires. Plain and fruit scones are projected to represent 33.0% across the product type breakdown in 2026, supported by classic buttermilk and sultana recipes even as the broader market trails the 14.4% CAGR of packaged muffins. Starting from a 2025 baseline of USD 433.1 million, global scones industry size is estimated at USD 482.5 million in 2026 and is forecast to reach USD 1,420.2 million by 2036 on an 11.4% CAGR. However, rapid crumb drying after two days on ambient shelves and strict gluten-free bakery separation rules restrain wider foodservice adoption.
Key Market Trends & Insights
- By product type: Plain & fruit scones are expected to hold a 33.0% share in 2026 because classic buttermilk and sultana recipes anchor hotel afternoon-tea and grocery bakery baskets.
- By claim / nature: Conventional recipes are estimated to hold a 53.0% share in 2026 owing to butter-and-wheat crumb tenderness and lower ingredient qualification overhead.
- By format: Fresh scones are projected to account for a 29.0% share in 2026 attributable to immediate bakery-counter aroma and warm coffee-shop service.
- By packaging format: Multipack formats are predicted to record a 35.0% share in 2026 supported by four-pack and six-pack grocery flow-wraps built for household tea occasions.
- By sales channel: Supermarkets and hypermarkets are anticipated to hold a 40.0% share in 2026 enabled by in-store scratch-and-bake-off tables and private-label tiering.
Regional Highlights
- Top national expansion: Canada is forecast to lead profiled countries at a 12.8% CAGR through 2036 due to specialty coffee-chain expansion and supermarket in-store bakery upgrades.
- Broader country progression: New Zealand is projected to expand at a 12.4% CAGR ahead of South Africa at 12.1% and the UK at 11.8%, while Japan is estimated to register a 10.5% CAGR.
Market Size & Forecast
Table 1: Market Size and Forecast for the Scones Market (USD million and CAGR percentage), 2025 to 2036
| Metric | Value |
|---|---|
| 2025 Market Size | USD 433.1 million |
| Estimated Market Size in 2026 | USD 482.5 million |
| Projected Market Size by 2036 | USD 1,420.2 million |
| CAGR, 2026 to 2036 | 11.4% |
| Added Revenue, 2026 to 2036 | USD 937.7 million |
Coffee shops and hotel tearooms require consistent scone crown height and tender internal crumb without employing early-morning scratch bakers at every site. Manual scone batter mixing in store kitchens toughens wheat dough and produces flat pucks that fail counter display standards. In July 2025, a consumer sensory study published in Foods evaluated gluten-free scones formulated with buckwheat and oat flours across 100 panelists and confirmed that inner softness drives purchase intent (p < 0.001). As a result, foodservice operators pair pre-portioned frozen scone pucks with savory muffins and scones assortments to maintain uniform counter presentation.
Café-Counter and Portion-Requirement Sizing
Table 2: Café-Counter and Portion-Requirement Sizing for the Scones Market (USD million and operational ranges), 2025 to 2036
| Metric | 2025 | 2026 | 2036 |
|---|---|---|---|
| Market size (USD million) | 433.1 | 482.5 | 1,420.2 |
| Retail bakery & café outlets (million) | 0.3 to 0.4 | 0.4 to 0.5 | 0.7 to 0.8 |
| Finished scone portions sold per day (million) | 4.2 to 4.8 | 4.6 to 5.3 | 11.5 to 13.0 |
| Post-defrost ambient counter shelf life (days) | 2.0 to 3.0 | 2.0 to 4.0 | 3.0 to 5.0 |
Operational note: Café-counter and portion ranges reflect supermarket in-store bakeries and hotel afternoon-tea venues procuring finished fresh and thaw-and-serve bakery scones.
Hospitality procurement managers evaluate wholesale scone suppliers on four-hour ambient defrost recovery and unsold end-of-day staling rates. Wholesale bakeries coordinate frozen scone deliveries with par-baked bread shipments to consolidate sub-zero van drops across urban cafés.
Per Capita & Bakery Outlet Sizing
Table 3: Per Capita and Bakery Outlet Spending Indicators for the Scones Market (USD), 2025 to 2036
| Metric | 2025 | 2026 | 2036 |
|---|---|---|---|
| World population (billion) | 8.2 | 8.3 | 9.0 |
| Spend per 1,000 people (USD) | 52.8 | 58.1 | 157.8 |
| Annual spend per bakery or café outlet (USD) | 1,080.0 to 1,240.0 | 1,150.0 to 1,320.0 | 1,850.0 to 2,150.0 |
| Supermarket & hypermarket channel share (%) | 39.0% to 41.0% | 40.0% to 42.0% | 42.0% to 45.0% |
Table 4: Bakery Outlet & Channel Spending Indicators for the Scones Market (USD and percentages), 2026
| Metric | Value | Institutional Reference Basis |
|---|---|---|
| Market size, 2026 | USD 482.5 million | 2026 global valuation baseline |
| Stocked bakery & café outlets | 0.4 million | Global grocery bakery and tearoom outlet base |
| Market spend per outlet | USD 1,206.3 | Annualized finished scone procurement |
| Supermarket & hypermarket allocation, 2026 | USD 193.0 million | 40.0% primary sales channel share |
Moisture loss and starch firming dry out scone crumb within 24 hours of unsealed counter exposure. Commercial bakers use enzyme-treated flour systems from bakery ingredients and mixes suppliers to keep multipack scones soft across four-day retail shelf windows.
Analyst Perspective
"Supermarket and café bakery buyers evaluate finished scones on crown lift and four-day post-thaw crumb softness for cream-and-jam service. Suppliers that validate slack-and-serve frozen scones with dedicated gluten-free and plant-based lines will capture recurring national grocery and coffee-chain contracts."
- Nandini Roy Choudhury, Principal Consultant, Future Market Insights.
How is the scones market segmented?
The scones market is segmented by product type, claim / nature, format, packaging format, and sales channel. In 2026, plain & fruit scones are projected at 33.0%, conventional at 53.0%, fresh at 29.0%, multipack at 35.0%, and supermarkets & hypermarkets at 40.0%.
By product type: Plain & fruit scones, savory & cheese scones, glazed & iced scones, and chocolate & specialty.
By claim / nature: Conventional, clean label, organic, and gluten-free.
By format: Fresh, frozen, and ambient packaged.
By packaging format: Multipack, single-serve, and bulk foodservice.
By sales channel: Supermarkets & hypermarkets, artisan & specialty bakeries, convenience & forecourt, online & DTC, and foodservice distributors.
Why do Plain & fruit scones lead the product type category?
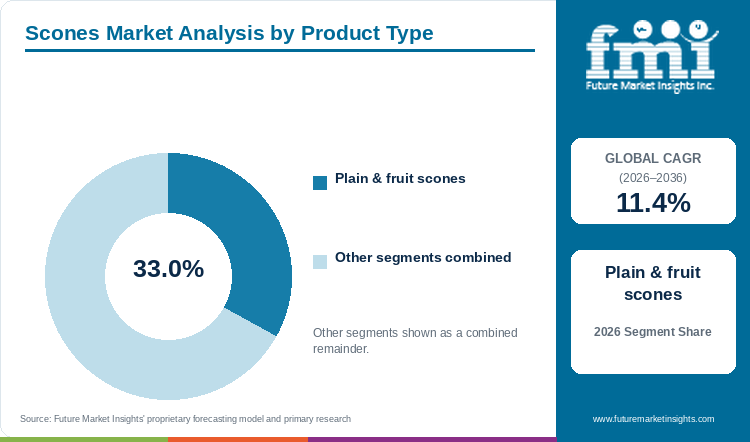
Plain and fruit scones are expected to hold a 33.0% share of the product type segment in 2026, driven by afternoon-tea and breakfast versatility.
Table 5: Product Type Share for the Scones Market (percentage share), 2026
| Product Type | Share (2026) |
|---|---|
| Plain & fruit scones | 33.0% |
| Other Segments Combined* | 67.0% |
| Total | 100.0% |
*Calculated as the balance remaining after deducting the leading segment's reported share from 100.0%.
Table 6: Product Type Leadership and Market Growth for the Scones Market (segment and CAGR percentage), 2026 to 2036
| Metric | Value |
|---|---|
| Global CAGR (2026 to 2036) | 11.4% |
| Leading Segment | Plain & fruit scones |
All-butter plain and sultana fruit scones anchor category sales because the format serves both hotel afternoon-tea tiers and everyday household breakfast toasting. Proper category scope excludes ice-cream cones and confirms that leavened plain and fruit scones lead demand while pairing with baking ingredients such as clotted cream and fruit preserves.
- Plain and fruit scones are expected to hold a 33.0% share in 2026 because sultana and buttermilk recipes deliver high repeat purchase rates across grocery multipacks.
- In August 2025, a baking study in the Journal of the Science of Food and Agriculture confirmed that structured plant-oil gels can replace 50% of dairy butter while retaining cake and pastry moisture.
Why does Conventional define the largest claim / nature segment?
Conventional formulations are estimated to hold a 53.0% share of the claim / nature segment in 2026, owing to butter-and-flour crumb structure.
Traditional wheat-flour and dairy buttermilk formulas remain the commercial benchmark because cold butter pieces create a light, flaky split during baking. Specialty allergen-free variants require dedicated lines similar to United Kingdom gluten-free bakery facilities to prevent cross-contact.
- Conventional scones are estimated to hold a 53.0% share in 2026 resulting from lower ingredient costs and taller oven rise compared with gum-stabilized gluten-free batters.
- A December 2025 flour study in Frontiers in Nutrition found gluten cross-contamination above 20 mg/kg in 50% of unlabeled natural flours versus 16.67% of certified gluten-free flours.
What keeps Fresh ahead by format?
Fresh scones are projected to account for a 29.0% share of the format segment in 2026, attributable to bakery-counter sensory appeal.
Freshly baked scones command the single largest format share at 29.0% because warm butter aroma and tender crumb drive impulse purchases at café and supermarket counters. Meanwhile, frozen thaw-and-serve scones—such as Mademoiselle Desserts' four-hour defrost sultana scones with four-day shelf life—compete closely by cutting daily staling waste across kouign-amann and morning-goods counters.
- Fresh presentations are projected to account for a 29.0% share in 2026 linked to premium single-piece pricing at artisan bakeries and coffee-shop checkout displays.
- In December 2025, a bakery packaging study in Foods demonstrated that carbon-dioxide modified atmosphere packaging with natural plant extracts extends preservative-free bakery shelf life from 6 days to 41 days.
Why does Multipack lead the packaging format category?
Multipack configurations are predicted to record a 35.0% share of the packaging format segment in 2026, supported by take-home grocery economics.
Four-count and six-count thermoformed flow-packs anchor supermarket aisle turnover by matching family weekend tea occasions while keeping packaging cost per scone low. Individually wrapped single-serve scones target convenience forecourts and catering trays next to soft-baked cookies where hygienic handling is mandatory.
- Multipack formats are predicted to record a 35.0% share in 2026 associated with high supermarket shelf velocity and protective blister cavities that prevent crown crushing.
- In March 2026, a baking study in Foods confirmed that pre-emulsified fat dispersion with enzyme treatment improves crumb softness and volume in reduced-fat morning goods.
What gives Supermarkets & hypermarkets the leading position in sales channel?
Supermarkets and hypermarkets are anticipated to hold a 40.0% share of the sales channel segment in 2026, enabled by own-label bakery tiering.
Grocery chains capture 40.0% of sales by merchandising economy four-packs and premium all-butter reserve tiers on high-traffic in-store bakery tables. Retailers cross-merchandise fresh and ambient scones with clotted cream and cookie butter spreads to lift total basket spend.
- Supermarkets and hypermarkets are anticipated to hold a 40.0% share in 2026 stemming from nationwide store networks and scheduled daily bake-off replenishment.
- In February 2026, Finsbury Food Group highlighted in its 2026 Bakery Flavour Trends report that tea-infused and fruit-paired nostalgic bakes are driving supermarket bakery launches.
What are the drivers, restraints, and opportunities in the scones market?
In the scones market, café coffee-accompaniment bundling and thaw-and-serve frozen formats drive repeat orders whereas 24-hour crumb staling and allergen labeling rules restrain margins and gluten-free or vegan scones create growth opportunities.
- Driver: Expanding coffee-shop morning goods programs and hotel afternoon-tea packages convert thaw-and-serve frozen scones into high-margin beverage accompaniments.
- Restraint: Rapid crumb drying after baking and strict prepacked-for-direct-sale allergen labeling obligations increase café waste and compliance costs.
- Opportunity: Buckwheat and oat gluten-free formulations and individually wrapped vegan sultana scones open airline and specialty café catering contracts.
Growth Analysis and Future Potential: Qualitative Demand Catalysts
Out-of-home coffee chains and grocery in-store bakeries are expanding scone facings because the item pairs strong artisanal appeal with simple ambient or warmed service. Unlike laminated croissants that require multi-hour proofing and steam-injected ovens, pre-baked frozen scones thaw at room temperature in four hours and go straight to display stands. Future Market Insights notes that operators bundling scones with hot beverages achieve higher ticket averages next to sourdough bakery premix specialty loaves. In October 2025, a UK Food Standards Agency survey of 964 food-hypersensitive consumers found that 83% eat out or order takeaway at least monthly while 87% trust printed allergen menus. Wholesale distributors therefore supply pre-labeled thaw-and-serve scones that simplify café counter compliance.
Risk Assessment of the Scones Market: Operational and Formulation Friction
Short ambient crumb shelf life and strict allergen cross-contamination liabilities represent the primary operational hurdles restricting retail and café margins. Once baked scones sit on unrefrigerated café counters past 24 hours, moisture loss from the interior crumb produces a dry mouthfeel that reduces repeat buying. In June 2026, the UK Food Standards Agency published its policy paper on Codex precautionary allergen labeling thresholds (ED05), noting the compliance tension between portion-based protein thresholds and strict 20 parts per million gluten-free rules. Small bakeries that handle wheat flour and dairy butter on shared tables cannot substantiate free-from claims without segregated rooms. Producers unable to separate wheat and dairy lines face exclusion from institutional and grocery free-from tenders.
Commercial Opportunity Analysis: Formulation Differentiation and Value-Add Formats
Bakery manufacturers win high-margin foodservice accounts by formulating thaw-and-serve vegan and gluten-free scones that match conventional buttermilk crumb tenderness. Historically, gluten-free rice-flour scones suffered from gritty texture and rapid crumbling when sliced horizontally for jam and cream service. Formulations combining oat and buckwheat flours with moisture-retaining plant fibers remove grittiness and extend post-thaw softness to four days. In April 2026, a bakery review in Foods confirmed that buckwheat and quinoa flours improve crumb stability and dietary fiber in gluten-free baked goods. Suppliers that deliver individually wrapped allergen-safe scones with vegan muffin mix lines capture airline and healthcare catering contracts.
Scones Market by Country (2026 to 2036)
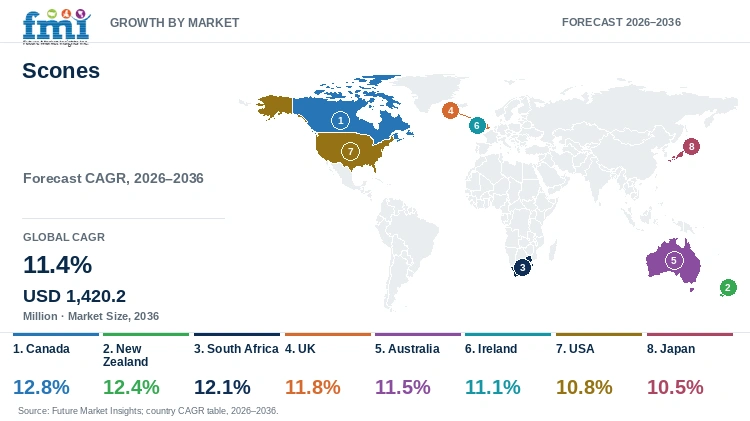
As per FMI, Canada is projected to lead scones market growth across profiled countries at a 12.8% CAGR through 2036, whereas Japan is forecast to progress at a 10.5% CAGR. National performance across Commonwealth bakery markets and East Asian hotel tearooms depends on cold-chain bake-off logistics and retail multipack pricing.
Table 7: Country CAGR and Primary Growth Levers for the Scones Market (CAGR percentage and operational drivers), 2026 to 2036
| Country | CAGR (2026 to 2036) | Primary Growth Lever |
|---|---|---|
| Canada | 12.8% | Specialty coffee-chain morning goods expansion and USD 20,000M consumer food import scale |
| New Zealand | 12.4% | High café density per capita and commercial bakery thaw-and-serve adoption |
| South Africa | 12.1% | Concentrated supermarket in-store bakery chains and tea-time multipack demand |
| UK | 11.8% | Entrenched afternoon-tea heritage and USD 343,000M retail grocery bakery replenishment |
| Australia | 11.5% | Dedicated gluten-free bakery innovation and online grocery multipack delivery |
| Ireland | 11.1% | EUR 10.4B hospitality foodservice sector prioritizing zero-waste frozen bakes |
| USA | 10.8% | Coffee-shop breakfast bundling and clean-label blueberry and cheddar scone rotation |
| Japan | 10.5% | Inbound hotel afternoon-tea buffets and department-store UK bakery fairs |
Source: Future Market Insights analysis
Canada Scones Market Outlook (2026 to 2036)
Demand in Canada is projected to expand at a 12.8% CAGR from 2026 to 2036, placing the country first among all eight profiled markets. Unlike European markets dominated by independent high-street bakeries, Canada is driven by nationwide quick-service coffee chains and centralized supermarket commissaries shipping frozen dough pucks across vast provincial distances. According to the USDA Foreign Agricultural Service in July 2026, Canada's USD 89,000 million foodservice sector grew 5.9% while importing USD 20,000 million in U.S. consumer-oriented agricultural products in 2025. Long cross-province refrigerated trucking routes require freeze-thaw-stable scone formulations that resist crown slumping and moisture loss inside multipack clamshells across regional distribution centers.
Key takeaway: In Canada, nationwide coffee-chain menu standardization and long-haul frozen bakery logistics are projected to anchor 12.8% CAGR expansion.
New Zealand Scones Market Outlook (2026 to 2036)
An exceptionally high density of independent espresso cafés where savory cheese scones and sweet date scones are daily morning staples sets New Zealand apart from North America. Market value in New Zealand is estimated to advance at a 12.4% CAGR between 2026 and 2036 due to café operators replacing early-morning scratch baking with pre-portioned frozen dough pucks. In October 2026, the USDA Foreign Agricultural Service reported in its New Zealand Retail Foods Annual that consumer-oriented food imports and dairy-rich bakery categories experienced strong retail demand in 2025. Uneven weekday footfall outside Auckland and Wellington forces suppliers to offer small-case frozen packs that cafés can bake off in six-unit batches.
Key takeaway: In New Zealand, entrenched café cheese-and-date scone culture and small-batch bake-off economics are estimated to sustain 12.4% CAGR growth.
South Africa Scones Market Outlook (2026 to 2036)
Whereas New Zealand relies on independent coffee shops, South Africa is structurally anchored by five major supermarket groups that command over 60% of formal food retail and operate high-volume in-store bakeries. In October 2026, the USDA Foreign Agricultural Service documented in its South Africa Retail Foods Annual that retail food sales reached USD 55,000 million in 2025 led by Shoprite and Woolworths. Sales in South Africa are forecast to register a 12.1% CAGR from 2026 to 2036 owing to household multipack purchases for weekend tea and festive gatherings. Intermittent municipal power disruptions and cold-chain costs encourage supermarket bakeries to favor ambient-stable multipacks and rapid bake-off mixes.
Key takeaway: In South Africa, consolidated supermarket in-store bakeries and value-priced family multipacks are forecast to drive 12.1% CAGR expansion.
UK Scones Market Outlook (2026 to 2036)
Established cream-tea hospitality traditions and year-round supermarket bakery aisle fixture space make the UK the foundational benchmark for commercial scone specifications across retail and catering channels. In July 2026, Finsbury Food Group reported in its Summer 2026 bakery trends analysis that UK shoppers favor fruit-led and portable bakery formats in smaller portion sizes. However, elevated butter and egg input costs plus promotional restrictions on high-sugar bakery items pressure retail multipack margins across grocery chains. Industry valuation in the UK is anticipated to record an 11.8% CAGR over 2026 to 2036 attributable to premium all-butter grocery tiers and zero-waste thaw-and-serve foodservice scones across regional catering contracts.
Key takeaway: In the UK, entrenched afternoon-tea catering and supermarket reserve bakery tiers are anticipated to support premium all-butter and free-from scone turnover.
Australia Scones Market Outlook (2026 to 2036)
Valuation in Australia is predicted to grow at an 11.5% CAGR from 2026 to 2036 resulting from strong supermarket private-label bakery innovation and strict gluten-free foodservice demand. Australia differs from European scone markets through its strict zero-detectable-gluten labeling standards and rapid consumer adoption of online grocery home delivery. According to the USDA Foreign Agricultural Service in October 2026, major supermarket groups in Australia are expanding private-label bakery and digital grocery channels to compete with discount chains. High household awareness of celiac dietary management across metropolitan centers in Australia also reinforces strict dedicated-bakery line verification and sealed multipack flow-wrapping across national supermarket and specialty café suppliers.
Key takeaway: In Australia, strict gluten-free dietary awareness and supermarket online delivery are predicted to propel certified free-from and multipack scone sales.
Ireland Scones Market Outlook (2026 to 2036)
What distinguishes Ireland from continental Europe is the central role of hotel and tearoom morning scones served with local dairy butter across both domestic and tourist dining occasions. Market size in Ireland is expected to rise at an 11.1% CAGR through 2036 supported by hospitality operators standardizing portion weight and kitchen labor hours. In November 2025, Bord Bia's Foodservice Market Insights Report for Ireland documented that island-of-Ireland foodservice consumer spending reached a record EUR 10.36 billion in 2025 amid rising kitchen labor costs. As a result, regional hotel and independent café buyers in Ireland favor individually frozen pre-baked scones that eliminate early-morning pastry labor and zero out unsold counter waste.
Key takeaway: In Ireland, hospitality kitchen labor shortages and margin pressures are expected to shift hotels toward zero-waste thaw-and-serve scones.
USA Scones Market Outlook (2026 to 2036)
Unlike the UK where round split scones are paired with clotted cream, the USA market favors triangular glazed and savory cheddar scones sold as grab-and-go coffee accompaniments. In June 2026, the USDA Economic Research Service documented in its Food Expenditure Series revision that away-from-home dining and warehouse-club grocery channels continue expanding across the USA. Because scones compete directly against muffins and croissants for limited coffee-shop pastry case slots, commercial suppliers must prevent crumb dryness during ambient display. Demand in the USA is slated to advance at a 10.8% CAGR between 2026 and 2036 linked to regional drive-thru coffee chains and high-turnover supermarket in-store bakery tables.
Key takeaway: In the USA, away-from-home coffee-chain breakfast bundling and in-store bakery tables are slated to sustain glazed and fruit scone demand.
Japan Scones Market Outlook (2026 to 2036)
Luxury hotel afternoon-tea social trends and department-store UK bakery exhibitions provide Japan with a high-margin premium scone niche despite low traditional household baking. In October 2026, the USDA Foreign Agricultural Service reported in its FOODEX Japan 2026 analysis that international gourmet baked goods and Western confectionery continue attracting urban retail and hospitality buyers in Japan. To prevent off-flavors and fat oxidation in oat- and butter-rich scones stored in humid climates, processors in Japan apply heat-stabilized flour treatments and moisture-barrier wrappers. In turn, the market in Japan is likely to progress at a 10.5% CAGR from 2026 to 2036 associated with gift-packaged tearoom boxes and hotel pastry buffets.
Key takeaway: In Japan, luxury hotel afternoon-tea culture and department-store bakery exhibitions are likely to drive demand for gift-packaged artisanal scones.
Full report country CAGRs cover: North America; Latin America; Western Europe; Eastern Europe; East Asia; South Asia and Pacific; Middle East and Africa.
Who are the notable companies in the scones market?
Mademoiselle Desserts, Finsbury Food Group, Premier Foods, Bells of Lazonby, Greggs, Samworth Brothers, The Compleat Food Group, St Pierre Groupe, and Frank Roberts & Sons are the notable companies profiled in the scones market.
FMI analysis indicates that the competitive arena separates into direct wholesale scone manufacturers, branded and private-label retail cake-and-bakery groups, and adjacent food-to-go operators. Mademoiselle Desserts (part of Emmi Group) leads documented foodservice scone supply with plain and sultana scones plus vegan and gluten-free thaw-and-serve variants. Finsbury Food Group and Bells of Lazonby plus Premier Foods and St Pierre Groupe bring scaled grocery bakery and dedicated free-from manufacturing capabilities.
- Direct Wholesale Scone & Thaw-and-Serve Specialists: Mademoiselle Desserts manufactures finished frozen plain and sultana scones plus vegan and gluten-free scones with validated four-hour defrost protocols.
- Retail Sweet Bakery & Dedicated Free-From Platforms: Finsbury Food Group and Bells of Lazonby plus Premier Foods and St Pierre Groupe operate scaled UK and international grocery bakery networks.
- Food-to-Go Retail & Adjacent Bakery Comparators: Greggs and Frank Roberts & Sons plus Samworth Brothers and The Compleat Food Group manage high-frequency bakery retail and chilled foodservice routes.
Competitive Benchmarking: Scones Market
Table 8: Competitive Benchmarking for the Scones Market (qualitative capability ratings), 2026
| Company | Verified Scone Portfolio | Free-From Bakery Depth | Retail / Foodservice Route | Geographic Reach |
|---|---|---|---|---|
| Mademoiselle Desserts | High | High | High | United Kingdom and European wholesale foodservice |
| Finsbury Food Group | Medium | High | High | United Kingdom and European grocery and foodservice |
| Bells of Lazonby | Medium | High | High | United Kingdom, USA, and Australia free-from bakery |
| Premier Foods | Medium | Medium | High | United Kingdom branded grocery and international export |
| St Pierre Groupe | Medium | Low | High | United Kingdom, USA, and European Brioche and bakery |
| Greggs | Medium | Low | High | United Kingdom company-operated bakery retail estate |
| Frank Roberts & Sons | Medium | Low | Medium | United Kingdom grocery and foodservice morning goods |
| The Compleat Food Group | Low | Medium | High | United Kingdom retail and foodservice prepared bakery |
Scoring basis: Capability tiers evaluate documented finished-scone SKU availability, dedicated allergen-segregated gluten-free and plant-based baking lines, and multichannel grocery and café distribution.
Key Developments in the Scones Market
- In July 2026, Finsbury Food Group expanded its better-for-you sweet bakery portfolio through Flower & White to supply portion-controlled treats across UK grocery and foodservice channels.
- In July 2026, Premier Foods expanded Mr Kipling Breakfast Bakes manufacturing at its Stoke bakery facility to capture morning-goods and coffee-accompaniment occasions across UK grocery chains.
- In January 2026, The Compleat Food Group broadened its UK chilled and prepared foodservice platform by acquiring Greencore's sauces and soups business in Bristol following CMA approval.
Key Players in the Scones Market
Direct Wholesale Scone & Thaw-and-Serve Bakery Leaders
- Mademoiselle Desserts (Emmi Group)
- Finsbury Food Group
- Bells of Lazonby
Branded Grocery Sweet Bakery & Morning-Goods Platforms
- Premier Foods
- St Pierre Groupe
- Frank Roberts & Sons
Food-to-Go Bakery Retail & Prepared-Food Operators
- Greggs
- The Compleat Food Group
Scones Market - Report Scope
Table 9: Report Scope for the Scones Market (coverage fields and definitions), 2026 to 2036
| Coverage field | Report scope |
|---|---|
| Market breakdown | Product Type; Claim / Nature; Format; Packaging Format; Sales Channel |
| Quantitative Units | USD Million |
| Market Definition | Commercial first-sale revenue from finished bakery scones (plain, fruit, savory/cheese, glazed, and specialty) sold through retail and foodservice channels. Category Scope Note: Excludes ice-cream sugar/waffle cones, dry baking mixes, clotted cream/jam sold separately, and accompanying hot beverages. |
| Regions Covered | North America; Latin America; Western Europe; Eastern Europe; East Asia; South Asia and Pacific; Middle East and Africa |
| Countries Covered | Canada, New Zealand, South Africa, UK, Australia, Ireland, USA, Japan, and additional countries in the full report |
| Key Companies Covered | Mademoiselle Desserts, Finsbury Food Group, Bells of Lazonby, Premier Foods, St Pierre Groupe, Greggs, Frank Roberts & Sons, Samworth Brothers, The Compleat Food Group |
| Forecast Period | 2026 to 2036 |
| Approach | Primary and secondary research with top-down and bottom-up market triangulation. |
Scones Market - Research Methodology
Table 10: Research Methodology for the Scones Market (research methods and approach), 2026 edition
| Method | Approach |
|---|---|
| Primary Research | Structured interviews with wholesale bakery technical directors, supermarket in-store bakery buyers, hotel afternoon-tea procurement managers, and free-from bakery formulators to validate defrost shelf life and case economics. |
| Secondary Research | Analysis of corporate disclosures (Finsbury Food Group, Premier Foods, Mademoiselle Desserts, Compleat Food Group), UK FSA allergen papers, Bord Bia and USDA ERS/FAS GAIN filings, and PubMed baking studies. |
| Market Sizing and Forecasting | Top-down retail morning-goods and café bakery expenditure models reconciled against bottom-up daily finished scone unit sales across grocery and hospitality outlets from 2026 to 2036. |
| Country Forecasting Model | Econometric country projections weight specialty coffee-shop density, afternoon-tea hospitality spending, supermarket in-store bakery share, and celiac/free-from dietary prevalence across eight countries. |
| Operational Benchmark Traceability | Café-counter and outlet spending indicators in Tables 2, 3, and 4 trace to USDA FAS UK and Canada retail/HRI reports and published thaw-and-serve shelf-life specifications. |
| Data Triangulation and Validation | Demand estimates are cross-checked against wholesale bakery production volumes and grocery scanner data while purging historical ice-cream cone nomenclature errors and excluding dry flour mixes. |
Scones Market by Segments
Scones Market segmented by Product Type:
- Plain & fruit scones
- Savory & cheese scones
- Glazed & iced scones
- Chocolate & specialty
Scones Market segmented by Claim / Nature:
- Conventional
- Clean label
- Gluten-free
Scones Market segmented by Format:
- Fresh
- Frozen
- Ambient packaged
Scones Market segmented by Packaging Format:
- Multipack
- Single-serve
- Bulk foodservice
- Others
Scones Market segmented by Sales Channel:
- Supermarkets & hypermarkets
- Artisan & specialty bakeries
- Convenience & forecourt
- Online & DTC
- Foodservice distributors
Scones Market by Region
- North America
- United States
- Canada
- Latin America
- Brazil
- Mexico
- Argentina
- Chile
- Western Europe
- Germany
- France
- United Kingdom
- Italy
- Spain
- Benelux
- Nordics
- Eastern Europe
- Poland
- Czech Republic
- Romania
- Hungary
- East Asia
- China
- Japan
- South Korea
- South Asia and Pacific
- India
- ASEAN
- Australia and New Zealand
- Middle East and Africa
- GCC Countries
- South Africa
- Türkiye
- Israel
Research Sources and Bibliography
- [1] United States Department of Agriculture, Foreign Agricultural Service. (2026, October 1). United Kingdom: Retail Foods Annual (Attaché Report UK2026-0029). USDA Foreign Agricultural Service GAIN.
- [2] Chae, J., Kim, S., Yeon, J., Shin, S., & Ju, S. (2025, July 14). Consumer Acceptability of Various Gluten-Free Scones with Rice, Buckwheat, Black Rice, Brown Rice, and Oat Flours. Foods, 14(14), 2464 (PubMed PMID 40724284).
- [3] Liu, N., Xue, X., Zhang, K., Li, D., Lin, P., Ju, Q., Chen, Y., Nishinari, K., Zhao, M., & Yao, X. (2025, August 15). Enhanced chiffon cake quality using tannic acid cross-linked diacylglycerol oleogels as a replacement of butter. Journal of the Science of Food and Agriculture, 105(10), 5173-5182 (PubMed PMID 40152238).
- [4] Ocal, H. Y., & Ozel, H. G. (2025, December 11). Naturally gluten-free flours are commonly contaminated, while commercially produced gluten-free flours are relatively safe: a market-based study. Frontiers in Nutrition, 12, 1707584 (PubMed PMID 41459067).
- [5] Offei, C. A., Marianelli, A., Macaluso, M., Mercanti, N., De Sousa, B. A. C. P., Rondanini, M. A., Borsani, S., & Zinnai, A. (2025, December 25). Technological Strategies to Enhance the Shelf Life of PDO Tuscan Bread in a Compostable Bag-in-Bag System. Foods, 15(1), 65 (PubMed PMID 41517131).
- [6] Ozbek, S., & Kirtil, E. (2026, March 10). Interfacial Route to Low-Fat Muffin Cake Quality: Pre-Emulsification-Enabled Lipase Action Improves Structure and Acceptance. Foods, 15(6), 978 (PubMed PMID 41897701).
- [7] Finsbury Food Group. (2026, February 17). 2026 Bakery Flavour Trends: From Matcha and Miso to Elevated Nostalgia. Finsbury Food Group Bakery Insights.
- [8] United Kingdom Food Standards Agency & Ipsos UK. (2025, October 7). Allergen Information for Non-Prepacked Foods: Consumer Experiences, Behaviours and Attitudes. UK Food Standards Agency Science & Research.
- [9] United Kingdom Food Standards Agency. (2026, June 25). FSA Position on the Codex Precautionary Allergen Labelling Standard including Allergen Thresholds (FSA 25-12-05). GOV.UK Food Standards Agency.
- [10] Atudorei, O., Atudorei, D., & Codina, G. G. (2026, April 8). Pseudocereals in Bakery Products: A Review of Nutritional Composition, Health Benefits and Bakery Applications. Foods, 15(8), 1283 (PubMed PMID 42073170).
- [11] United States Department of Agriculture, Foreign Agricultural Service. (2026, July 13). Canada: Food Service - Hotel Restaurant Institutional Annual (Attaché Report CA2026-0016). USDA Foreign Agricultural Service GAIN.
- [12] United States Department of Agriculture, Foreign Agricultural Service. (2026, October 2). New Zealand: Retail Foods Annual (Attaché Report NZ2026-0014). USDA Foreign Agricultural Service GAIN.
- [13] United States Department of Agriculture, Foreign Agricultural Service. (2026, October 2). South Africa: Retail Foods Annual (Attaché Report SF2026-0036). USDA Foreign Agricultural Service GAIN.
- [14] Finsbury Food Group. (2026, July 8). Top Bakery Trends for Summer 2026. Finsbury Food Group Bakery Insights.
- [15] United States Department of Agriculture, Foreign Agricultural Service. (2026, October 2). Australia: Retail Foods Annual (Attaché Report AS2026-0020). USDA Foreign Agricultural Service GAIN.
- [16] Bord Bia (Irish Food Board) & Technomic. (2025, November 11). Irish Foodservice Market Insights Report 2025. Bord Bia Industry Reports.
- [17] United States Department of Agriculture, Economic Research Service. (2026, June 1). Food Expenditure Series - Update and Revision History. USDA Economic Research Service.
- [18] United States Department of Agriculture, Foreign Agricultural Service. (2026, October 20). Japan: FOODEX Japan 2026 Report (Attaché Report JA2026-0017). USDA Foreign Agricultural Service GAIN.
- [19] Finsbury Food Group. (2026, July 14). How Flower & White Is Rewriting the Rules of Sweet Treats. Finsbury Food Group Corporate Insights.
- [20] Premier Foods plc. (2026, July 14). Stoke manufacturing Mr Kipling Breakfast Bakes. Premier Foods Media Library.
- [21] The Compleat Food Group. (2026, January 12). The Compleat Food Group acquires Greencore's sauces and soups business. The Compleat Food Group Corporate Updates.
- [22] Emmi Desserts Group. (2026). Our Global Dessert Product Segments: Retail and Foodservice Bakery Assortments. Emmi Desserts Group.
- [23] Premier Foods plc. (2026, July 14). Stoke manufacturing Mr Kipling Strawberries & Cream Tarts. Premier Foods Media Library.
This bibliography is provided for reader reference and is not exhaustive. The full report contains the complete reference list and detailed citations.
This Report Answers
- How large is the scones market in 2026 and what is forecast for 2036?
- Which café thaw-and-serve and grocery bakery pressures support scone demand?
- Why do Plain & fruit scones lead the product type category after taxonomy reconciliation?
- Why does Conventional hold the largest share within claim / nature?
- How do growth rates differ across Canada and New Zealand versus the UK and Japan?
- Which companies supply direct wholesale scones versus broader sweet bakery ranges?
- How do 24-hour crumb staling and allergen cross-contact rules constrain buyer switching?
- What operational benchmarks should café and grocery buyers verify before contracting scone suppliers?
Table of Content
- Key Takeaways
- Market Size and CAGR
- Top Growth Driver
- Fastest Growing Segment
- Leading Region
- Key Companies
- Emerging Opportunities
- Executive Summary
- Global Market Outlook
- Demand-side Trends
- Supply-side Trends
- Technology Roadmap Analysis
- Analysis and Recommendations
- Analyst Perspective (What is happening? Why now? What should investors know?)
- Key Questions Answered
- How large is the market?
- What is the CAGR?
- What are key trends?
- Which region dominates?
- Who are the leaders?
Read More...
- Market Overview
- Market Coverage / Taxonomy
- Market Definition / Scope / Limitations
- Research Methodology
- Chapter Orientation
- Analytical Lens and Working Hypotheses
- Market Structure, Signals, and Trend Drivers
- Benchmarking and Cross-market Comparability
- Market Sizing, Forecasting, and Opportunity Mapping
- Research Design and Evidence Framework
- Desk Research Programme (Secondary Evidence)
- Expert Input and Fieldwork (Primary Evidence)
- Tooling, Models, and Reference Databases
- Data Engineering and Model Build
- Quality Assurance and Audit Trail
- Market Background
- Market Dynamics (Drivers, Restraints, Opportunity, Trends)
- Scenario Forecast (Optimistic, Likely, Conservative)
- Impact Analysis
- AI Impact
- Sustainability Impact
- Regulatory Impact
- Technology Impact
- Consumer / Buyer Analysis
- Purchase Drivers
- Adoption Barriers
- Buyer Journey
- Opportunity Map Analysis
- Product Life Cycle Analysis
- Supply Chain Analysis
- Investment Feasibility Matrix
- Value Chain Analysis
- PESTLE and Porter's Analysis
- Regulatory Landscape
- Regional Parent Market Outlook
- Production and Consumption Statistics
- Import and Export Statistics
- Global Market Analysis and Forecast, 2021 to 2036
- Historical Market Size Value (USD Million) Analysis, 2021 to 2025
- Current and Future Market Size Value (USD Million) Projections, 2026 to 2036
- Y-o-Y Growth Trend Analysis
- Absolute $ Opportunity Analysis
- Global Market Pricing Analysis, 2021 to 2036
- Global Market Analysis and Forecast, By Product Type, 2021 to 2036
- Introduction / Key Findings
- Historical Market Size Value (USD Million) Analysis By Product Type, 2021 to 2025
- Current and Future Market Size Value (USD Million) Analysis and Forecast By Product Type, 2026 to 2036
- Plain & fruit scones
- Savory & cheese scones
- Glazed & iced scones
- Chocolate & specialty
- Y-o-Y Growth Trend Analysis By Product Type, 2021 to 2025
- Absolute $ Opportunity Analysis By Product Type, 2026 to 2036
- Global Market Analysis and Forecast, By Claim / Nature, 2021 to 2036
- Introduction / Key Findings
- Historical Market Size Value (USD Million) Analysis By Claim / Nature, 2021 to 2025
- Current and Future Market Size Value (USD Million) Analysis and Forecast By Claim / Nature, 2026 to 2036
- Conventional
- Clean label
- Gluten-free
- Y-o-Y Growth Trend Analysis By Claim / Nature, 2021 to 2025
- Absolute $ Opportunity Analysis By Claim / Nature, 2026 to 2036
- Global Market Analysis and Forecast, By Format, 2021 to 2036
- Introduction / Key Findings
- Historical Market Size Value (USD Million) Analysis By Format, 2021 to 2025
- Current and Future Market Size Value (USD Million) Analysis and Forecast By Format, 2026 to 2036
- Fresh
- Frozen
- Ambient packaged
- Y-o-Y Growth Trend Analysis By Format, 2021 to 2025
- Absolute $ Opportunity Analysis By Format, 2026 to 2036
- Global Market Analysis and Forecast, By Packaging Format, 2021 to 2036
- Introduction / Key Findings
- Historical Market Size Value (USD Million) Analysis By Packaging Format, 2021 to 2025
- Current and Future Market Size Value (USD Million) Analysis and Forecast By Packaging Format, 2026 to 2036
- Multipack
- Single-serve
- Bulk foodservice
- Others
- Y-o-Y Growth Trend Analysis By Packaging Format, 2021 to 2025
- Absolute $ Opportunity Analysis By Packaging Format, 2026 to 2036
- Global Market Analysis and Forecast, By Sales Channel, 2021 to 2036
- Introduction / Key Findings
- Historical Market Size Value (USD Million) Analysis By Sales Channel, 2021 to 2025
- Current and Future Market Size Value (USD Million) Analysis and Forecast By Sales Channel, 2026 to 2036
- Supermarkets & hypermarkets
- Artisan & specialty bakeries
- Convenience & forecourt
- Online & DTC
- Foodservice distributors
- Y-o-Y Growth Trend Analysis By Sales Channel, 2021 to 2025
- Absolute $ Opportunity Analysis By Sales Channel, 2026 to 2036
- Global Market Analysis and Forecast, By Region, 2021 to 2036
- Introduction
- Historical Market Size Value (USD Million) Analysis By Region, 2021 to 2025
- Current Market Size Value (USD Million) Analysis and Forecast By Region, 2026 to 2036
- North America
- Latin America
- Western Europe
- Eastern Europe
- East Asia
- South Asia and Pacific
- Middle East and Africa
- Market Attractiveness Analysis By Region
- North America Market Analysis and Forecast, By Country, 2021 to 2036
- Historical Market Size Value (USD Million) Trend Analysis By Market Taxonomy, 2021 to 2025
- Market Size Value (USD Million) Forecast By Market Taxonomy, 2026 to 2036
- By Country
- United States
- Canada
- By Product Type
- By Claim / Nature
- By Format
- By Packaging Format
- By Sales Channel
- By Country
- Market Attractiveness Analysis
- By Country
- By Product Type
- By Claim / Nature
- By Format
- By Packaging Format
- By Sales Channel
- Key Takeaways
- Latin America Market Analysis and Forecast, By Country
- Historical Market Size Value (USD Million) Trend Analysis By Market Taxonomy, 2021 to 2025
- Market Size Value (USD Million) Forecast By Market Taxonomy, 2026 to 2036
- By Country
- Brazil
- Mexico
- Argentina
- Chile
- By Product Type
- By Claim / Nature
- By Format
- By Packaging Format
- By Sales Channel
- By Country
- Market Attractiveness Analysis
- By Country
- By Product Type
- By Claim / Nature
- By Format
- By Packaging Format
- By Sales Channel
- Key Takeaways
- Western Europe Market Analysis and Forecast, By Country
- Historical Market Size Value (USD Million) Trend Analysis By Market Taxonomy, 2021 to 2025
- Market Size Value (USD Million) Forecast By Market Taxonomy, 2026 to 2036
- By Country
- Germany
- France
- United Kingdom
- Italy
- Spain
- Benelux
- Nordics
- By Product Type
- By Claim / Nature
- By Format
- By Packaging Format
- By Sales Channel
- By Country
- Market Attractiveness Analysis
- By Country
- By Product Type
- By Claim / Nature
- By Format
- By Packaging Format
- By Sales Channel
- Key Takeaways
- Eastern Europe Market Analysis and Forecast, By Country
- Historical Market Size Value (USD Million) Trend Analysis By Market Taxonomy, 2021 to 2025
- Market Size Value (USD Million) Forecast By Market Taxonomy, 2026 to 2036
- By Country
- Poland
- Czech Republic
- Romania
- Hungary
- By Product Type
- By Claim / Nature
- By Format
- By Packaging Format
- By Sales Channel
- By Country
- Market Attractiveness Analysis
- By Country
- By Product Type
- By Claim / Nature
- By Format
- By Packaging Format
- By Sales Channel
- Key Takeaways
- East Asia Market Analysis and Forecast, By Country
- Historical Market Size Value (USD Million) Trend Analysis By Market Taxonomy, 2021 to 2025
- Market Size Value (USD Million) Forecast By Market Taxonomy, 2026 to 2036
- By Country
- China
- Japan
- South Korea
- By Product Type
- By Claim / Nature
- By Format
- By Packaging Format
- By Sales Channel
- By Country
- Market Attractiveness Analysis
- By Country
- By Product Type
- By Claim / Nature
- By Format
- By Packaging Format
- By Sales Channel
- Key Takeaways
- South Asia and Pacific Market Analysis and Forecast, By Country
- Historical Market Size Value (USD Million) Trend Analysis By Market Taxonomy, 2021 to 2025
- Market Size Value (USD Million) Forecast By Market Taxonomy, 2026 to 2036
- By Country
- India
- ASEAN
- Australia and New Zealand
- By Product Type
- By Claim / Nature
- By Format
- By Packaging Format
- By Sales Channel
- By Country
- Market Attractiveness Analysis
- By Country
- By Product Type
- By Claim / Nature
- By Format
- By Packaging Format
- By Sales Channel
- Key Takeaways
- Middle East and Africa Market Analysis and Forecast, By Country
- Historical Market Size Value (USD Million) Trend Analysis By Market Taxonomy, 2021 to 2025
- Market Size Value (USD Million) Forecast By Market Taxonomy, 2026 to 2036
- By Country
- GCC Countries
- South Africa
- Türkiye
- Israel
- By Product Type
- By Claim / Nature
- By Format
- By Packaging Format
- By Sales Channel
- By Country
- Market Attractiveness Analysis
- By Country
- By Product Type
- By Claim / Nature
- By Format
- By Packaging Format
- By Sales Channel
- Key Takeaways
- Key Countries Market Analysis
- United States
- Pricing Analysis
- Market Share Analysis, 2025
- By Product Type
- By Claim / Nature
- By Format
- By Packaging Format
- By Sales Channel
- Canada
- Pricing Analysis
- Market Share Analysis, 2025
- By Product Type
- By Claim / Nature
- By Format
- By Packaging Format
- By Sales Channel
- Mexico
- Pricing Analysis
- Market Share Analysis, 2025
- By Product Type
- By Claim / Nature
- By Format
- By Packaging Format
- By Sales Channel
- Brazil
- Pricing Analysis
- Market Share Analysis, 2025
- By Product Type
- By Claim / Nature
- By Format
- By Packaging Format
- By Sales Channel
- Chile
- Pricing Analysis
- Market Share Analysis, 2025
- By Product Type
- By Claim / Nature
- By Format
- By Packaging Format
- By Sales Channel
- Germany
- Pricing Analysis
- Market Share Analysis, 2025
- By Product Type
- By Claim / Nature
- By Format
- By Packaging Format
- By Sales Channel
- United Kingdom
- Pricing Analysis
- Market Share Analysis, 2025
- By Product Type
- By Claim / Nature
- By Format
- By Packaging Format
- By Sales Channel
- Italy
- Pricing Analysis
- Market Share Analysis, 2025
- By Product Type
- By Claim / Nature
- By Format
- By Packaging Format
- By Sales Channel
- Spain
- Pricing Analysis
- Market Share Analysis, 2025
- By Product Type
- By Claim / Nature
- By Format
- By Packaging Format
- By Sales Channel
- France
- Pricing Analysis
- Market Share Analysis, 2025
- By Product Type
- By Claim / Nature
- By Format
- By Packaging Format
- By Sales Channel
- India
- Pricing Analysis
- Market Share Analysis, 2025
- By Product Type
- By Claim / Nature
- By Format
- By Packaging Format
- By Sales Channel
- ASEAN
- Pricing Analysis
- Market Share Analysis, 2025
- By Product Type
- By Claim / Nature
- By Format
- By Packaging Format
- By Sales Channel
- Australia and New Zealand
- Pricing Analysis
- Market Share Analysis, 2025
- By Product Type
- By Claim / Nature
- By Format
- By Packaging Format
- By Sales Channel
- China
- Pricing Analysis
- Market Share Analysis, 2025
- By Product Type
- By Claim / Nature
- By Format
- By Packaging Format
- By Sales Channel
- Japan
- Pricing Analysis
- Market Share Analysis, 2025
- By Product Type
- By Claim / Nature
- By Format
- By Packaging Format
- By Sales Channel
- South Korea
- Pricing Analysis
- Market Share Analysis, 2025
- By Product Type
- By Claim / Nature
- By Format
- By Packaging Format
- By Sales Channel
- Poland
- Pricing Analysis
- Market Share Analysis, 2025
- By Product Type
- By Claim / Nature
- By Format
- By Packaging Format
- By Sales Channel
- Hungary
- Pricing Analysis
- Market Share Analysis, 2025
- By Product Type
- By Claim / Nature
- By Format
- By Packaging Format
- By Sales Channel
- Türkiye
- Pricing Analysis
- Market Share Analysis, 2025
- By Product Type
- By Claim / Nature
- By Format
- By Packaging Format
- By Sales Channel
- South Africa
- Pricing Analysis
- Market Share Analysis, 2025
- By Product Type
- By Claim / Nature
- By Format
- By Packaging Format
- By Sales Channel
- New Zealand
- Pricing Analysis
- Market Share Analysis, 2025
- By Product Type
- By Claim / Nature
- By Format
- By Packaging Format
- By Sales Channel
- Australia
- Pricing Analysis
- Market Share Analysis, 2025
- By Product Type
- By Claim / Nature
- By Format
- By Packaging Format
- By Sales Channel
- Ireland
- Pricing Analysis
- Market Share Analysis, 2025
- By Product Type
- By Claim / Nature
- By Format
- By Packaging Format
- By Sales Channel
- United States
- Market Structure Analysis
- Competition Dashboard
- Competition Benchmarking
- Market Share Analysis of Top Players
- By Regional
- By Product Type
- By Claim / Nature
- By Format
- By Packaging Format
- By Sales Channel
- Emerging Startups
- Innovation Benchmarking
- Competition Analysis
- Competition Deep Dive
- Mademoiselle Desserts
- Overview
- Product Portfolio
- Profitability by Market Segments
- Sales Footprint
- Strategy Overview
- Marketing Strategy
- Product Strategy
- Channel Strategy
- Finsbury Food Group
- Bells of Lazonby
- Premier Foods
- St Pierre Groupe
- Greggs
- Frank Roberts & Sons
- The Compleat Food Group
- Mademoiselle Desserts (Emmi Group)
- Mademoiselle Desserts
- Case Studies
- Success Stories
- Recent Developments
- Competition Deep Dive
- Assumptions & Acronyms Used
List of Tables
- Table 1: Global Market Value (USD Million) Forecast by Region, 2021 to 2036
- Table 2: Global Market Value (USD Million) Forecast by Product Type, 2021 to 2036
- Table 3: Global Market Value (USD Million) Forecast by Claim / Nature, 2021 to 2036
- Table 4: Global Market Value (USD Million) Forecast by Format, 2021 to 2036
- Table 5: Global Market Value (USD Million) Forecast by Packaging Format, 2021 to 2036
- Table 6: Global Market Value (USD Million) Forecast by Sales Channel, 2021 to 2036
- Table 7: North America Market Value (USD Million) Forecast by Country, 2021 to 2036
- Table 8: North America Market Value (USD Million) Forecast by Product Type, 2021 to 2036
- Table 9: North America Market Value (USD Million) Forecast by Claim / Nature, 2021 to 2036
- Table 10: North America Market Value (USD Million) Forecast by Format, 2021 to 2036
- Table 11: North America Market Value (USD Million) Forecast by Packaging Format, 2021 to 2036
- Table 12: North America Market Value (USD Million) Forecast by Sales Channel, 2021 to 2036
- Table 13: Latin America Market Value (USD Million) Forecast by Country, 2021 to 2036
- Table 14: Latin America Market Value (USD Million) Forecast by Product Type, 2021 to 2036
- Table 15: Latin America Market Value (USD Million) Forecast by Claim / Nature, 2021 to 2036
- Table 16: Latin America Market Value (USD Million) Forecast by Format, 2021 to 2036
- Table 17: Latin America Market Value (USD Million) Forecast by Packaging Format, 2021 to 2036
- Table 18: Latin America Market Value (USD Million) Forecast by Sales Channel, 2021 to 2036
- Table 19: Western Europe Market Value (USD Million) Forecast by Country, 2021 to 2036
- Table 20: Western Europe Market Value (USD Million) Forecast by Product Type, 2021 to 2036
- Table 21: Western Europe Market Value (USD Million) Forecast by Claim / Nature, 2021 to 2036
- Table 22: Western Europe Market Value (USD Million) Forecast by Format, 2021 to 2036
- Table 23: Western Europe Market Value (USD Million) Forecast by Packaging Format, 2021 to 2036
- Table 24: Western Europe Market Value (USD Million) Forecast by Sales Channel, 2021 to 2036
- Table 25: Eastern Europe Market Value (USD Million) Forecast by Country, 2021 to 2036
- Table 26: Eastern Europe Market Value (USD Million) Forecast by Product Type, 2021 to 2036
- Table 27: Eastern Europe Market Value (USD Million) Forecast by Claim / Nature, 2021 to 2036
- Table 28: Eastern Europe Market Value (USD Million) Forecast by Format, 2021 to 2036
- Table 29: Eastern Europe Market Value (USD Million) Forecast by Packaging Format, 2021 to 2036
- Table 30: Eastern Europe Market Value (USD Million) Forecast by Sales Channel, 2021 to 2036
- Table 31: East Asia Market Value (USD Million) Forecast by Country, 2021 to 2036
- Table 32: East Asia Market Value (USD Million) Forecast by Product Type, 2021 to 2036
- Table 33: East Asia Market Value (USD Million) Forecast by Claim / Nature, 2021 to 2036
- Table 34: East Asia Market Value (USD Million) Forecast by Format, 2021 to 2036
- Table 35: East Asia Market Value (USD Million) Forecast by Packaging Format, 2021 to 2036
- Table 36: East Asia Market Value (USD Million) Forecast by Sales Channel, 2021 to 2036
- Table 37: South Asia and Pacific Market Value (USD Million) Forecast by Country, 2021 to 2036
- Table 38: South Asia and Pacific Market Value (USD Million) Forecast by Product Type, 2021 to 2036
- Table 39: South Asia and Pacific Market Value (USD Million) Forecast by Claim / Nature, 2021 to 2036
- Table 40: South Asia and Pacific Market Value (USD Million) Forecast by Format, 2021 to 2036
- Table 41: South Asia and Pacific Market Value (USD Million) Forecast by Packaging Format, 2021 to 2036
- Table 42: South Asia and Pacific Market Value (USD Million) Forecast by Sales Channel, 2021 to 2036
- Table 43: Middle East and Africa Market Value (USD Million) Forecast by Country, 2021 to 2036
- Table 44: Middle East and Africa Market Value (USD Million) Forecast by Product Type, 2021 to 2036
- Table 45: Middle East and Africa Market Value (USD Million) Forecast by Claim / Nature, 2021 to 2036
- Table 46: Middle East and Africa Market Value (USD Million) Forecast by Format, 2021 to 2036
- Table 47: Middle East and Africa Market Value (USD Million) Forecast by Packaging Format, 2021 to 2036
- Table 48: Middle East and Africa Market Value (USD Million) Forecast by Sales Channel, 2021 to 2036
List of Figures
- Figure 1: Global Market Pricing Analysis
- Figure 2: Global Market Value (USD Million) Forecast 2021-2036
- Figure 3: Global Market Value Share and BPS Analysis by Product Type, 2026 and 2036
- Figure 4: Global Market Y-o-Y Growth Comparison by Product Type, 2026-2036
- Figure 5: Global Market Attractiveness Analysis by Product Type
- Figure 6: Global Market Value Share and BPS Analysis by Claim / Nature, 2026 and 2036
- Figure 7: Global Market Y-o-Y Growth Comparison by Claim / Nature, 2026-2036
- Figure 8: Global Market Attractiveness Analysis by Claim / Nature
- Figure 9: Global Market Value Share and BPS Analysis by Format, 2026 and 2036
- Figure 10: Global Market Y-o-Y Growth Comparison by Format, 2026-2036
- Figure 11: Global Market Attractiveness Analysis by Format
- Figure 12: Global Market Value Share and BPS Analysis by Packaging Format, 2026 and 2036
- Figure 13: Global Market Y-o-Y Growth Comparison by Packaging Format, 2026-2036
- Figure 14: Global Market Attractiveness Analysis by Packaging Format
- Figure 15: Global Market Value Share and BPS Analysis by Sales Channel, 2026 and 2036
- Figure 16: Global Market Y-o-Y Growth Comparison by Sales Channel, 2026-2036
- Figure 17: Global Market Attractiveness Analysis by Sales Channel
- Figure 18: Global Market Value (USD Million) Share and BPS Analysis by Region, 2026 and 2036
- Figure 19: Global Market Y-o-Y Growth Comparison by Region, 2026-2036
- Figure 20: Global Market Attractiveness Analysis by Region
- Figure 21: North America Market Incremental Dollar Opportunity, 2026-2036
- Figure 22: Latin America Market Incremental Dollar Opportunity, 2026-2036
- Figure 23: Western Europe Market Incremental Dollar Opportunity, 2026-2036
- Figure 24: Eastern Europe Market Incremental Dollar Opportunity, 2026-2036
- Figure 25: East Asia Market Incremental Dollar Opportunity, 2026-2036
- Figure 26: South Asia and Pacific Market Incremental Dollar Opportunity, 2026-2036
- Figure 27: Middle East and Africa Market Incremental Dollar Opportunity, 2026-2036
- Figure 28: North America Market Value Share and BPS Analysis by Country, 2026 and 2036
- Figure 29: North America Market Value Share and BPS Analysis by Product Type, 2026 and 2036
- Figure 30: North America Market Y-o-Y Growth Comparison by Product Type, 2026-2036
- Figure 31: North America Market Attractiveness Analysis by Product Type
- Figure 32: North America Market Value Share and BPS Analysis by Claim / Nature, 2026 and 2036
- Figure 33: North America Market Y-o-Y Growth Comparison by Claim / Nature, 2026-2036
- Figure 34: North America Market Attractiveness Analysis by Claim / Nature
- Figure 35: North America Market Value Share and BPS Analysis by Format, 2026 and 2036
- Figure 36: North America Market Y-o-Y Growth Comparison by Format, 2026-2036
- Figure 37: North America Market Attractiveness Analysis by Format
- Figure 38: North America Market Value Share and BPS Analysis by Packaging Format, 2026 and 2036
- Figure 39: North America Market Y-o-Y Growth Comparison by Packaging Format, 2026-2036
- Figure 40: North America Market Attractiveness Analysis by Packaging Format
- Figure 41: North America Market Value Share and BPS Analysis by Sales Channel, 2026 and 2036
- Figure 42: North America Market Y-o-Y Growth Comparison by Sales Channel, 2026-2036
- Figure 43: North America Market Attractiveness Analysis by Sales Channel
- Figure 44: Latin America Market Value Share and BPS Analysis by Country, 2026 and 2036
- Figure 45: Latin America Market Value Share and BPS Analysis by Product Type, 2026 and 2036
- Figure 46: Latin America Market Y-o-Y Growth Comparison by Product Type, 2026-2036
- Figure 47: Latin America Market Attractiveness Analysis by Product Type
- Figure 48: Latin America Market Value Share and BPS Analysis by Claim / Nature, 2026 and 2036
- Figure 49: Latin America Market Y-o-Y Growth Comparison by Claim / Nature, 2026-2036
- Figure 50: Latin America Market Attractiveness Analysis by Claim / Nature
- Figure 51: Latin America Market Value Share and BPS Analysis by Format, 2026 and 2036
- Figure 52: Latin America Market Y-o-Y Growth Comparison by Format, 2026-2036
- Figure 53: Latin America Market Attractiveness Analysis by Format
- Figure 54: Latin America Market Value Share and BPS Analysis by Packaging Format, 2026 and 2036
- Figure 55: Latin America Market Y-o-Y Growth Comparison by Packaging Format, 2026-2036
- Figure 56: Latin America Market Attractiveness Analysis by Packaging Format
- Figure 57: Latin America Market Value Share and BPS Analysis by Sales Channel, 2026 and 2036
- Figure 58: Latin America Market Y-o-Y Growth Comparison by Sales Channel, 2026-2036
- Figure 59: Latin America Market Attractiveness Analysis by Sales Channel
- Figure 60: Western Europe Market Value Share and BPS Analysis by Country, 2026 and 2036
- Figure 61: Western Europe Market Value Share and BPS Analysis by Product Type, 2026 and 2036
- Figure 62: Western Europe Market Y-o-Y Growth Comparison by Product Type, 2026-2036
- Figure 63: Western Europe Market Attractiveness Analysis by Product Type
- Figure 64: Western Europe Market Value Share and BPS Analysis by Claim / Nature, 2026 and 2036
- Figure 65: Western Europe Market Y-o-Y Growth Comparison by Claim / Nature, 2026-2036
- Figure 66: Western Europe Market Attractiveness Analysis by Claim / Nature
- Figure 67: Western Europe Market Value Share and BPS Analysis by Format, 2026 and 2036
- Figure 68: Western Europe Market Y-o-Y Growth Comparison by Format, 2026-2036
- Figure 69: Western Europe Market Attractiveness Analysis by Format
- Figure 70: Western Europe Market Value Share and BPS Analysis by Packaging Format, 2026 and 2036
- Figure 71: Western Europe Market Y-o-Y Growth Comparison by Packaging Format, 2026-2036
- Figure 72: Western Europe Market Attractiveness Analysis by Packaging Format
- Figure 73: Western Europe Market Value Share and BPS Analysis by Sales Channel, 2026 and 2036
- Figure 74: Western Europe Market Y-o-Y Growth Comparison by Sales Channel, 2026-2036
- Figure 75: Western Europe Market Attractiveness Analysis by Sales Channel
- Figure 76: Eastern Europe Market Value Share and BPS Analysis by Country, 2026 and 2036
- Figure 77: Eastern Europe Market Value Share and BPS Analysis by Product Type, 2026 and 2036
- Figure 78: Eastern Europe Market Y-o-Y Growth Comparison by Product Type, 2026-2036
- Figure 79: Eastern Europe Market Attractiveness Analysis by Product Type
- Figure 80: Eastern Europe Market Value Share and BPS Analysis by Claim / Nature, 2026 and 2036
- Figure 81: Eastern Europe Market Y-o-Y Growth Comparison by Claim / Nature, 2026-2036
- Figure 82: Eastern Europe Market Attractiveness Analysis by Claim / Nature
- Figure 83: Eastern Europe Market Value Share and BPS Analysis by Format, 2026 and 2036
- Figure 84: Eastern Europe Market Y-o-Y Growth Comparison by Format, 2026-2036
- Figure 85: Eastern Europe Market Attractiveness Analysis by Format
- Figure 86: Eastern Europe Market Value Share and BPS Analysis by Packaging Format, 2026 and 2036
- Figure 87: Eastern Europe Market Y-o-Y Growth Comparison by Packaging Format, 2026-2036
- Figure 88: Eastern Europe Market Attractiveness Analysis by Packaging Format
- Figure 89: Eastern Europe Market Value Share and BPS Analysis by Sales Channel, 2026 and 2036
- Figure 90: Eastern Europe Market Y-o-Y Growth Comparison by Sales Channel, 2026-2036
- Figure 91: Eastern Europe Market Attractiveness Analysis by Sales Channel
- Figure 92: East Asia Market Value Share and BPS Analysis by Country, 2026 and 2036
- Figure 93: East Asia Market Value Share and BPS Analysis by Product Type, 2026 and 2036
- Figure 94: East Asia Market Y-o-Y Growth Comparison by Product Type, 2026-2036
- Figure 95: East Asia Market Attractiveness Analysis by Product Type
- Figure 96: East Asia Market Value Share and BPS Analysis by Claim / Nature, 2026 and 2036
- Figure 97: East Asia Market Y-o-Y Growth Comparison by Claim / Nature, 2026-2036
- Figure 98: East Asia Market Attractiveness Analysis by Claim / Nature
- Figure 99: East Asia Market Value Share and BPS Analysis by Format, 2026 and 2036
- Figure 100: East Asia Market Y-o-Y Growth Comparison by Format, 2026-2036
- Figure 101: East Asia Market Attractiveness Analysis by Format
- Figure 102: East Asia Market Value Share and BPS Analysis by Packaging Format, 2026 and 2036
- Figure 103: East Asia Market Y-o-Y Growth Comparison by Packaging Format, 2026-2036
- Figure 104: East Asia Market Attractiveness Analysis by Packaging Format
- Figure 105: East Asia Market Value Share and BPS Analysis by Sales Channel, 2026 and 2036
- Figure 106: East Asia Market Y-o-Y Growth Comparison by Sales Channel, 2026-2036
- Figure 107: East Asia Market Attractiveness Analysis by Sales Channel
- Figure 108: South Asia and Pacific Market Value Share and BPS Analysis by Country, 2026 and 2036
- Figure 109: South Asia and Pacific Market Value Share and BPS Analysis by Product Type, 2026 and 2036
- Figure 110: South Asia and Pacific Market Y-o-Y Growth Comparison by Product Type, 2026-2036
- Figure 111: South Asia and Pacific Market Attractiveness Analysis by Product Type
- Figure 112: South Asia and Pacific Market Value Share and BPS Analysis by Claim / Nature, 2026 and 2036
- Figure 113: South Asia and Pacific Market Y-o-Y Growth Comparison by Claim / Nature, 2026-2036
- Figure 114: South Asia and Pacific Market Attractiveness Analysis by Claim / Nature
- Figure 115: South Asia and Pacific Market Value Share and BPS Analysis by Format, 2026 and 2036
- Figure 116: South Asia and Pacific Market Y-o-Y Growth Comparison by Format, 2026-2036
- Figure 117: South Asia and Pacific Market Attractiveness Analysis by Format
- Figure 118: South Asia and Pacific Market Value Share and BPS Analysis by Packaging Format, 2026 and 2036
- Figure 119: South Asia and Pacific Market Y-o-Y Growth Comparison by Packaging Format, 2026-2036
- Figure 120: South Asia and Pacific Market Attractiveness Analysis by Packaging Format
- Figure 121: South Asia and Pacific Market Value Share and BPS Analysis by Sales Channel, 2026 and 2036
- Figure 122: South Asia and Pacific Market Y-o-Y Growth Comparison by Sales Channel, 2026-2036
- Figure 123: South Asia and Pacific Market Attractiveness Analysis by Sales Channel
- Figure 124: Middle East and Africa Market Value Share and BPS Analysis by Country, 2026 and 2036
- Figure 125: Middle East and Africa Market Value Share and BPS Analysis by Product Type, 2026 and 2036
- Figure 126: Middle East and Africa Market Y-o-Y Growth Comparison by Product Type, 2026-2036
- Figure 127: Middle East and Africa Market Attractiveness Analysis by Product Type
- Figure 128: Middle East and Africa Market Value Share and BPS Analysis by Claim / Nature, 2026 and 2036
- Figure 129: Middle East and Africa Market Y-o-Y Growth Comparison by Claim / Nature, 2026-2036
- Figure 130: Middle East and Africa Market Attractiveness Analysis by Claim / Nature
- Figure 131: Middle East and Africa Market Value Share and BPS Analysis by Format, 2026 and 2036
- Figure 132: Middle East and Africa Market Y-o-Y Growth Comparison by Format, 2026-2036
- Figure 133: Middle East and Africa Market Attractiveness Analysis by Format
- Figure 134: Middle East and Africa Market Value Share and BPS Analysis by Packaging Format, 2026 and 2036
- Figure 135: Middle East and Africa Market Y-o-Y Growth Comparison by Packaging Format, 2026-2036
- Figure 136: Middle East and Africa Market Attractiveness Analysis by Packaging Format
- Figure 137: Middle East and Africa Market Value Share and BPS Analysis by Sales Channel, 2026 and 2036
- Figure 138: Middle East and Africa Market Y-o-Y Growth Comparison by Sales Channel, 2026-2036
- Figure 139: Middle East and Africa Market Attractiveness Analysis by Sales Channel
- Figure 140: Global Market - Tier Structure Analysis
- Figure 141: Global Market - Company Share Analysis
Frequently Asked Questions
How big is the scones market in 2026, and what is forecast for 2036?
According to FMI, global scones market valuation is estimated to reach USD 482.5 million in 2026 from USD 433.1 million in 2025. The market is projected to reach USD 1,420.2 million by 2036 as cafés and supermarkets expand thaw-and-serve and multipack bakery programs.
What is the CAGR for the scones market from 2026 to 2036?
Future Market Insights projects an 11.4% compound annual growth rate between 2026 and 2036, generating USD 937.7 million in incremental market value across retail and foodservice channels.
Which product type segment leads the scones market?
Plain and fruit scones are expected to hold a 33.0% share of the product type segment in 2026 because classic buttermilk and sultana recipes anchor both hotel afternoon-tea service and household grocery multipacks.
Which claim / nature segment leads the scones market?
Conventional formulations are estimated to hold a 53.0% share in 2026 owing to traditional butter-and-wheat crumb tenderness and lower allergen compliance overhead.
Which country has a notable growth outlook during the assessment period?
Canada is projected to lead national expansion at a 12.8% CAGR through 2036, driven by specialty coffee-chain morning goods programs and centralized supermarket bake-off distribution.
Who are the key players in the market?
Mademoiselle Desserts and Finsbury Food Group lead commercial supply with Bells of Lazonby and Premier Foods plus St Pierre Groupe and Greggs across wholesale foodservice and retail bakery channels.
Preview the report firsthand - request a free sample
Get SampleGet the brochure for pricing and purchase details.
Get PDF
