
- Market Size (2026)
- USD 555.2 Mn
- Forecast (2036)
- USD 1209.8 Mn
- CAGR (2026 to 2036)
- 8.1%
How big is Serine Market in 2026?
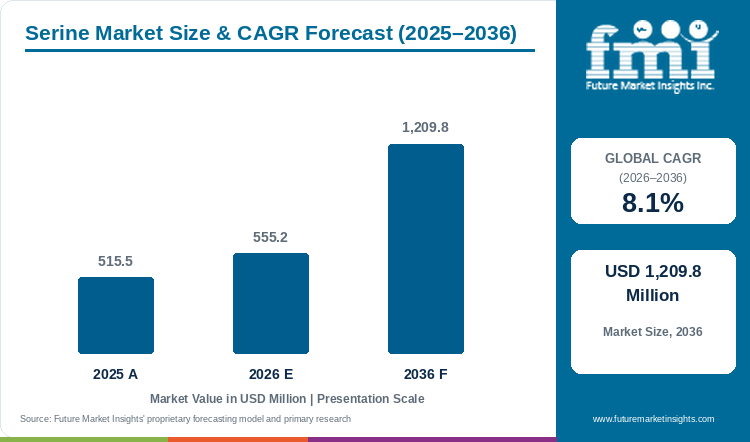
Starting from USD 515.5 million in 2025, the serine market valuation advanced to USD 555.2 million in 2026, with projections pointing toward USD 1,209.8 million by 2036 at a CAGR of 8.1%.
Hospital admissions requiring intravenous nutritional support and rapid expansion of monoclonal antibody manufacturing are driving commercial demand across the serine market. The global serine market size stood at USD 515.5 million in 2025 and reached USD 555.2 million in 2026. Overall industry valuation is projected by FMI to reach USD 1,209.8 million by 2036, progressing at an 8.1% CAGR from 2026 to 2036. Hospital compounding pharmacies and biologics producers strongly prefer L-Serine High Purity Pure grades, which hold a 43.0% share in 2026, because even trace D-serine contamination can trigger renal tubular damage in patients receiving continuous infusions. In addition to clinical infusions, biopharmaceutical manufacturers are increasing their consumption of purified serine relative to standard amino acids because immune cell therapies cannot synthesize sufficient serine internally and rely on media supplementation to sustain cell growth. Various biologics producers are expanding their manufacturing capacity to cater to rising global demand for injectable therapies, as seen in September 2026 when Sandoz opened an advanced biosimilar drug substance center in Lendava, Slovenia. However, high costs associated with chiral chromatography purification and strict multi-compendial endotoxin testing remain a major restraining factor for smaller regional manufacturers.
Key Market Trends & Insights
- By enantiomer form: L-Serine High Purity Pure formulations hold an estimated 43.0% share in 2026 because stereospecific crystallization meets parenteral and cell culture chiral tolerances.
- By production method: Microbial Direct Fermentation represents 46.7% in 2026 as engineered Corynebacterium and Escherichia strains convert renewable glucose directly into L-serine.
- By purity compendial grade: USP EP JP Compendial Pharmaceutical Grade accounts for 50.4% in 2026 because injectable nutrition bags and biologics bioreactors mandate multi-compendial endotoxin clearance.
- By commercial application: Parenteral Amino Acid Infusion Nutrition secures 45.8% in 2026 owing to intensive care nitrogen balance protocols and neonatal total parenteral nutrition.
- By distribution channel: Direct to Pharmaceutical and Biopharma Manufacturers commands 53.2% in 2026 through plant-level quality audits and Drug Master File qualification.
Regional Highlights
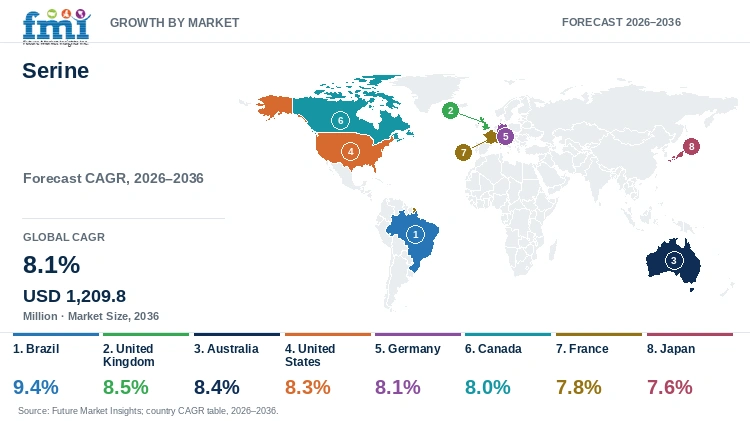
- Top national expansion: Brazil leads national growth projections at a 9.4% CAGR through 2036 under hospital parenteral compounding and domestic nutritional processing expansion.
- Broader country progression: The United Kingdom tracks at an 8.5% CAGR ahead of Australia at 8.4% and the United States at 8.3%, whereas Germany advances at an 8.1% CAGR and Canada records 8.0%.
Market Size & Forecast
Table 1: Market Size and Forecast for the Serine Market (USD million and CAGR percentage), 2025 to 2036
| Metric | Value |
|---|---|
| 2025 Market Size | USD 515.5 million |
| Estimated Market Size in 2026 | USD 555.2 million |
| Projected Market Size by 2036 | USD 1,209.8 million |
| CAGR, 2026 to 2036 | 8.1% |
| Added Market Value, 2026 to 2036 | USD 654.6 million |
Hospital patient loads across post-surgical and intensive care wards have increased the clinical need for balanced intravenous amino acid solutions that prevent muscle wasting and support gut recovery. When patients cannot tolerate oral feeding during severe illness, hospitals rely on sterile nutritional bags to supply the amino acids required for daily tissue and mucosal protein renewal. In April 2026, clinical researchers publishing in Communications Biology analyzed 504,245 adults in the European Prospective Investigation into Cancer and Nutrition cohort and confirmed a daily dietary L-serine intake of 2.6 to 4.0 grams with a safe upper intake level of 12 grams per day. These clinical safety benchmarks give hospital formulators confidence to increase L-serine inclusion across parenteral nutrition admixtures without risking metabolic overload.
Physical Volume and Compendial Grade Sizing
Table 2: Physical Volume and Compendial Grade Sizing for the Serine Market (USD million and operational ranges), 2025 to 2036
| Metric | 2025 | 2026 | 2036 |
|---|---|---|---|
| Market size (USD million) | 515.5 | 555.2 | 1,209.8 |
| Global purified serine physical volume (thousand metric tons) | 28.4 to 31.2 | 30.5 to 33.6 | 62.0 to 68.5 |
| Compendial injectable & media grade volume (thousand metric tons) | 14.2 to 15.8 | 15.4 to 17.0 | 33.5 to 37.2 |
| Average realized manufacturer price per kg (USD) | 16.5 to 18.2 | 16.6 to 18.3 | 17.6 to 19.5 |
Operational note: Physical volume ranges triangulate purified manufacturer shipments across pharmaceutical compendial and cell culture specifications against average manufacturer price realizations per kilogram.
Biopharmaceutical companies manufacturing monoclonal antibodies and viral vaccines face constant pressure to increase bioreactor cell density and reduce batch failure rates. Because mammalian cells rapidly deplete nutrients during fed-batch production, media suppliers blend viral-inactivated L-serine powders into cell culture media to maintain high antibody yields and uniform protein quality.
Per Capita & Biopharma Facility Procurement Sizing
Table 3: Per Capita and Biopharma Facility Procurement Indicators for the Serine Market (USD), 2025 to 2036
| Metric | 2025 | 2026 | 2036 |
|---|---|---|---|
| Global population baseline (billion) | 8.2 | 8.3 | 9.0 |
| Market value per 1,000 people (USD) | 62.9 | 66.9 | 134.4 |
| Annual procurement per qualified biopharma plant (USD thousand) | 175.0 to 195.0 | 188.0 to 210.0 | 390.0 to 435.0 |
| Direct microbial fermentation share (%) | 45.5% to 47.0% | 46.0% to 47.5% | 54.0% to 58.0% |
Table 4: Biopharma & Channel Procurement Indicators for the Serine Market (USD and percentages), 2026
| Metric | Value | Institutional Reference Basis |
|---|---|---|
| Market size, 2026 | USD 555.2 million | 2026 global valuation baseline |
| Qualified sterile compounding & media plants global | 2,850 facilities | Hospital parenteral and mammalian cell culture plants |
| Annual procurement per qualified facility | USD 194,807.0 | Annualized compendial and technical serine outlay |
| Direct to Pharmaceutical Manufacturers value, 2026 | USD 295.4 million | 53.2% distribution channel allocation |
Pharmaceutical contract manufacturers producing peptide drugs and central nervous system therapeutics require chiral starting materials that cut multi-step synthesis waste. Direct procurement of optically pure L-serine and D-serine and pharmaceutical intermediates allows API producers to manufacture cycloserine and neurological drug candidates without expensive downstream racemic resolution.
Analyst Perspective
"Hospital compounding directors and biologics media buyers do not purchase serine as an interchangeable bulk powder, because trace D-isomer carryover or endotoxin spikes can ruin an entire clinical production batch. Suppliers that combine low-cost sugar fermentation with harmonized USP and European Pharmacopoeia regulatory filings are positioned to win multi-year direct supply contracts through 2036."
- Nandini Roy Choudhury, Principal Consultant, Future Market Insights.
How is the serine market segmented?
The serine market is segmented by enantiomer form, production method, purity compendial grade and commercial application with distribution channel. In 2026, L-Serine High Purity Pure is projected at 43.0%, Microbial Direct Fermentation at 46.7%, USP EP JP Compendial Pharmaceutical Grade at 50.4%, Parenteral Amino Acid Infusion Nutrition at 45.8%, and Direct to Pharmaceutical and Biopharma Manufacturers at 53.2%.
By enantiomer form: L-Serine High Purity Pure and DL-Serine Racemic Mixture as well as D-Serine Pharmaceutical Grade.
By production method: Microbial Direct Fermentation and Enzymatic Biocatalytic Synthesis as well as Protein Hydrolysis Route.
By purity compendial grade: USP EP JP Compendial Pharmaceutical Grade and Dietary Supplement and Food Grade as well as Cell Culture Research Grade.
By commercial application: Parenteral Amino Acid Infusion Nutrition and Cosmetics Skin Moisturizing Barrier as well as Pharmaceutical Chemical Synthesis Intermediates and Dietary Supplements.
By distribution channel: Direct to Pharmaceutical and Biopharma Manufacturers and Specialty Chemical Distributors as well as Clinical Compounding Pharmacies and Online B2B Portals.
Why does L-Serine High Purity Pure lead the enantiomer form category?
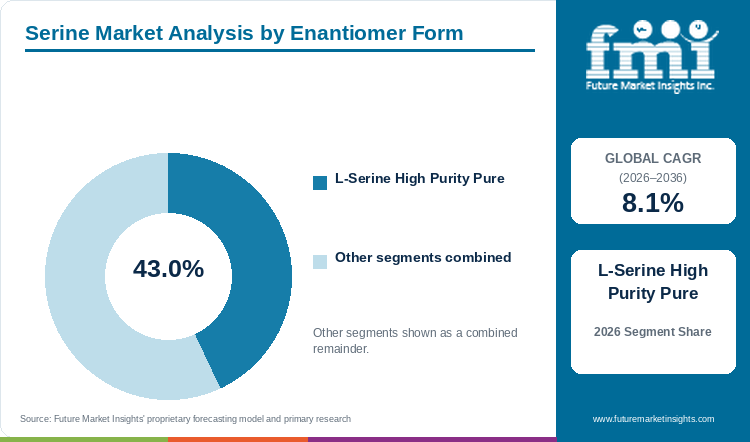
L-Serine High Purity Pure formulations hold an estimated 43.0% of enantiomer form demand in 2026, anchored by mandatory chiral purity in injectable nutrition and biologics media.
Table 5: Enantiomer Form Share for the Serine Market (percentage share), 2026
| Enantiomer Form | Share (2026) |
|---|---|
| L-Serine High Purity Pure | 43.0% |
| Other Segments Combined | 57.0%* |
| Total | 100.0% |
*Note: Remaining enantiomer form categories account for the balance of 2026 global serine demand.
Table 6: Enantiomer Form Leadership and Market Growth for the Serine Market (segment and CAGR percentage), 2026 to 2036
| Metric | Value |
|---|---|
| Global CAGR (2026 to 2036) | 8.1% |
| Leading Segment | L-Serine High Purity Pure |
Strong adoption of L-Serine High Purity Pure formulations is driven by the strict safety requirements of injectable nutrition and biological drug manufacturing. Because only the natural L-isomer is utilized by human cells to build proteins and cell membranes, buyers operating parenteral compounding pharmacies specify 99.5% pure L-serine while limiting D-serine purchases to specialized neurological research trials.
- L-Serine High Purity Pure holds 43.0% of enantiomer form value in 2026 because only the L-isomer incorporates into mammalian polypeptides and infant nutritional infusions.
- Meanwhile, clinical trials are creating a niche pharmaceutical outlet for the D-isomer, as a February 2026 review in Cellular and Molecular Neurobiology reported that administering 60 milligrams per kilogram of D-serine daily for six weeks reduced clinical symptoms in schizophrenia patients.
What sustains Microbial Direct Fermentation leadership in the production method segment?
Microbial Direct Fermentation represents 46.7% of the production method category in 2026, supported by engineered bacterial exporter strains and corn-steep glucose feedstocks.
The shift in production practices from traditional protein acid hydrolysis toward direct bacterial sugar fermentation is lowering manufacturing costs and improving batch consistency across the industry. Manufacturers adopting precision fermentation ingredients systems use engineered bacteria fed on corn dextrose to produce L-serine directly, avoiding the toxic methanol and glycine precursors required in older enzymatic reactors.
- Microbial Direct Fermentation represents 46.7% of the production method segment in 2026 as high-titer sugar fermentation lowers unit utility and purification costs.
- Strain engineering advances are directly boosting fermenter output, as researchers reporting in Engineering Microbiology in September 2025 identified the Cg0701 membrane exporter in Corynebacterium glutamicum and increased 5-liter fed-batch fermentation yields by 24.44% to 48.72 grams per liter.
How does USP EP JP Compendial Pharmaceutical Grade lead the purity compendial grade category?
USP EP JP Compendial Pharmaceutical Grade accounts for 50.4% of purity grade volume in 2026, driven by strict endotoxin and chiral purity specifications.
High demand for USP EP JP Compendial Pharmaceutical Grade serine stems from mandatory regulatory audits across injectable drug and hospital infusion plants. While personal care brands can use standard technical powders in cosmetic ingredients lotions, pharmaceutical manufacturers must purchase compendial grades that have undergone carbon decolorization and ultrafiltration to remove bacterial endotoxins.
- USP EP JP Compendial Pharmaceutical Grade accounts for 50.4% of purity grade value in 2026 because injectable infusions and biologics require validated endotoxin limits.
- Consistent media purity is essential for cell survival in biomedical research, as a July 2025 study in Antioxidants tracing 0.285 millimolar isotope-labeled L-serine across eight cellular models over 48 hours confirmed that extracellular serine uptake directly sustains intracellular antioxidant balance.
Why does Parenteral Amino Acid Infusion Nutrition lead the commercial application category?
Parenteral Amino Acid Infusion Nutrition secures 45.8% of commercial application value in 2026, supported by intensive care nitrogen infusions and neonatal bags.
Parenteral Amino Acid Infusion Nutrition accounts for the largest share of commercial demand because hospitals administer crystalline L-serine daily to surgical and premature neonatal patients. At the same time, consumer demand for clinically proven hydration serums is boosting serine adoption in skincare, since serine is the most abundant natural moisturizing amino acid in human skin.
- Parenteral Amino Acid Infusion Nutrition secures 45.8% of commercial application demand in 2026 as hospitals standardize balanced crystalline amino acid bags.
- This skincare demand is supported by clinical diagnostics research in Nature Communications in March 2025, which confirmed that L-serine makes up over 20% of free amino acids in the skin stratum corneum and introduced a 0.3-millimeter wearable hydrogel sensor that measures epidermal serine levels in five minutes.
What gives Direct to Pharmaceutical and Biopharma Manufacturers the leading position in distribution channel?
Direct to Pharmaceutical and Biopharma Manufacturers commands 53.2% of distribution channel share in 2026, anchored by multi-year quality audits and viral-free dossiers.
Multi-plant pharmaceutical companies and hospital bag manufacturers prefer to buy directly from primary fermentation producers rather than third-party chemical brokers to avoid contamination risks. Direct procurement contracts allow buyers to audit the factory floor and lock in annual volume pricing with full Drug Master File regulatory support.
- Direct to Pharmaceutical and Biopharma Manufacturers commands 53.2% of distribution channel value in 2026 because cGMP biologics lines require direct manufacturer audit trails.
- Commercial demand through direct manufacturer channels continues to expand as new therapies enter production, supported by the U.S. Food and Drug Administration Center for Drug Evaluation and Research clearance of 46 novel drugs in 2025 as published in January 2026.
What are the drivers and restraints as well as opportunities in the serine market?
In the serine market, rising parenteral nutrition prescriptions and mammalian cell culture media demand are projected to drive adoption whereas D-enantiomer renal toxicity thresholds restrain unrefined batches and engineered yeast ceramide precursors create new dermal ingredient avenues.
- Driver: Expanding immunotherapy and monoclonal antibody production requires exogenous L-serine supplementation in chemically defined cell culture media and clinical infusions.
- Restraint: Nephrotoxic tubular necrosis risks from residual D-serine carryover and enteric pathogen utilization require expensive chiral purification and clinical dosing controls.
- Opportunity: Engineered yeast biosynthesis of phytosphingosine and ceramide precursors using L-serine feedstocks creates high-margin demand across dermatological barrier care and neuroprotective supplements.
Growth Analysis and Future Potential in Qualitative Demand Drivers
Higher prevalence of age-related cognitive decline and rising consumer awareness regarding brain health are driving strong demand for serine in nutritional capsules and medical foods. Consumers and neurologists are turning toward amino acid formulations that support synaptic memory function without synthetic stimulant side effects. Consequently, nutraceutical brands are launching L-serine powders and capsules across dietary supplements retail channels. In April 2025, neurobiologists publishing in Cellular and Molecular Life Sciences demonstrated that knocking out serine racemase removes 95% of brain D-serine, whereas supplying 100 micromolar exogenous D-serine restores hippocampal receptor signaling by 30% to 40%.
Risk Assessment of Operational and Formulation Friction
Safety concerns surrounding kidney toxicity from unrefined D-isomer impurities and unwanted bacterial growth in patients with gut inflammation represent key factors restraining market growth. If racemic DL-serine is not properly purified, high levels of the D-isomer are broken down in the kidneys into hydrogen peroxide, which can damage renal tubules. In addition, excess dietary L-serine in patients with inflammatory bowel conditions can feed harmful gut bacteria. In June 2025, researchers in Gut Microbes found 22 altered intracellular metabolites and 21 extracellular metabolites when colibactin-producing Escherichia coli consumed 10 millimolar L-serine in intestinal cell cultures. As a result, companies formulating pharmaceutical excipients and clinical nutrition products must enforce strict chiral purity testing and medical supervision.
Commercial Opportunity Analysis in Formulation Differentiation and Value-Add Formats
Commercial application of L-serine as a bio-manufacturing feedstock to produce skin-identical ceramides and phytosphingosine is creating lucrative growth opportunities for fermentation suppliers. Skincare manufacturers are replacing petroleum-derived moisturizers with bio-fermented ceramides that repair damaged skin barriers in eczema and anti-aging creams. Bulk deliveries of L-serine to yeast fermentation plants that manufacture functional cosmetic ingredients allow amino acid producers to capture higher margins than standard food grades. In July 2025, biotechnology researchers reporting in 3 Biotech showed that feeding 40 millimolar L-serine and 0.5 millimolar palmitic acid at pH 5.0 to engineered Saccharomyces cerevisiae increased phytosphingosine output 1.89-fold to 50.38 milligrams per gram of dry cell weight and reached 82.62 milligrams per gram in 156-hour fed-batch runs.
Serine Market by Country (2026 to 2036)
FMI country modeling indicates that Brazil leads serine market expansion at a 9.4% CAGR through 2036, followed by the United Kingdom at 8.5% and Australia at 8.4%. The United States advances at 8.3% ahead of Germany at 8.1% and Canada at 8.0%, reflecting regional differences in sugarcane fermentation feedstocks and domestic biologics manufacturing capacity.
Table 7: Country CAGR and Primary Growth Levers for the Serine Market (CAGR percentage and operational drivers), 2026 to 2036
| Country | CAGR (2026 to 2036) | Primary Growth Lever |
|---|---|---|
| Brazil | 9.4% | USD 248,000 million food and nutritional processing base and injectable hospital compounding expansion |
| United Kingdom | 8.5% | MHRA-regulated sterile compounding hubs and clinical nutrition reformulation |
| Australia | 8.4% | TGA-certified parenteral bag manufacturing and Asia-Pacific clinical trial media supply |
| United States | 8.3% | FDA novel biologics launches and domestic bioanalytical manufacturing investments |
| Germany | 8.1% | European Pharmacopoeia sterile amino acid compounding and bioprocess fermentation |
| Canada | 8.0% | Health Canada clinical nutrition fortification and domestic sterile fill-finish upgrades |
| France | 7.8% | Immunology biologics upstream cell culture media and hospital infusion procurement |
| Japan | 7.6% | Japanese Pharmacopoeia ultra-pure fermentation standards and geriatric infusion care |
Source: Future Market Insights analysis
Brazil Serine Market Outlook (2026 to 2036)
Abundant domestic sugarcane dextrose supplies give fermentation plants in Brazil a major raw-material cost advantage over European and Asian producers that rely on imported grain starches. Hospital expansion across Sao Paulo and Rio de Janeiro is simultaneously increasing domestic consumption of sterile amino acid infusion bags for surgical and intensive care patients. In March 2026, the USDA Foreign Agricultural Service reported that the food and nutritional processing sector in Brazil generated USD 248,000 million in 2025 output after expanding by 8% year over year. Supported by low-cost sugar fermentation and rising private hospital demand, the serine market in Brazil is projected to advance at a leading 9.4% CAGR through 2036.
Key takeaway: In Brazil, domestic dextrose fermentation economics and hospital parenteral compounding expansion are projected to drive a leading 9.4% CAGR through 2036.
United Kingdom Serine Market Outlook (2026 to 2036)
Hospital aseptic compounding pharmacies and cell therapy laboratories in Oxford and Cambridge form the core buyer base for purified serine in the United Kingdom. Because cell and gene therapy developers require viral-free media components to expand patient immune cells, suppliers with national Pharmacopoeia documentation command strong price premiums. However, reliance on imported crystalline amino acid drums exposes local buyers to cross-border cold-chain freight costs. Per the March 2026 USDA Foreign Agricultural Service country report, food and beverage manufacturing accounts for the largest manufacturing footprint in the United Kingdom and drives continuous clean-label ingredient reformulation. Consequently, serine demand in the United Kingdom is estimated to grow at an 8.5% CAGR between 2026 and 2036.
Key takeaway: In the United Kingdom, MHRA-licensed aseptic compounding and cell therapy media manufacturing are estimated to sustain an 8.5% CAGR through 2036.
Australia Serine Market Outlook (2026 to 2036)
Phase-one oncology clinical trials and domestic parenteral bag compounding are the primary commercial drivers shaping serine consumption across Australia. Contract development organizations in Melbourne and Sydney attract international biotechnology sponsors through fast regulatory trial clearances and federal research tax incentives, boosting local orders for cell culture grade L-serine. In March 2026, the USDA Foreign Agricultural Service reported that food and nutritional manufacturing output in Australia rose 5% to USD 112,000 million while specialized ingredient imports from the United States climbed 9% to USD 1,450 million. Driven by clinical trial media blending and cosmeceutical skincare exports across Asia-Pacific, Australia is forecast to record an 8.4% CAGR from 2026 to 2036.
Key takeaway: In Australia, TGA-certified hospital compounding and Asia-Pacific clinical trial biomanufacturing are forecast to support an 8.4% CAGR through 2036.
United States Serine Market Outlook (2026 to 2036)
Massive commercial monoclonal antibody production and multibillion-dollar domestic biomanufacturing investments make the United States the largest single-country buyer of compendial and cell culture grade serine. Pharmaceutical manufacturers in New Jersey and California lock in multi-ton annual contracts for low-endotoxin L-serine to feed 20,000-liter mammalian bioreactors. To strengthen domestic raw-material and biologics quality testing, Merck inaugurated its USD 550 million ADVANCE bioanalytical facility on its 400-acre West Point campus in Pennsylvania on October 14, 2026 under its USD 70,000 million domestic investment program. Supported by commercial antibody pipelines and cognitive supplement demand, the serine market in the United States is anticipated to progress at an 8.3% CAGR through 2036.
Key takeaway: In the United States, commercial biologics manufacturing and domestic bioanalytical facility investments are anticipated to drive an 8.3% CAGR through 2036.
Germany Serine Market Outlook (2026 to 2036)
Industrial biotechnology engineering and strict European Pharmacopoeia quality enforcement define the commercial environment for serine in Germany. Chemical and pharmaceutical producers along the Rhine-Main corridor specialize in high-titer Corynebacterium strain development and automated parenteral nutrition bag filling for European hospital networks. High domestic industrial electricity tariffs nevertheless pressure fermentation operating margins and encourage manufacturers to invest in high-yield bacterial exporter strains. Per the March 2026 USDA Foreign Agricultural Service report, food and nutritional processors in Germany generated USD 270,100 million in production value serving 83.5 million domestic consumers. Anchored by sterile hospital infusion exports and bioprocess media blending, Germany is slated to advance at an 8.1% CAGR from 2026 to 2036.
Key takeaway: In Germany, industrial amino acid fermentation engineering and European Pharmacopoeia infusion manufacturing are slated to maintain an 8.1% CAGR through 2036.
Canada Serine Market Outlook (2026 to 2036)
Federal investments in domestic vaccine and biologics fill-finish capacity across Ontario and Quebec have shifted Canada from a passive importer of finished medical infusions to an active buyer of upstream amino acid feedstocks. At the same time, updated nutritional transparency rules are prompting supplement and functional food brands in Toronto and Montreal to reformulate with clean-label amino acids. In August 2026, the USDA Foreign Agricultural Service reported that food and nutritional processing output in Canada exceeded USD 125,000 million in 2025 as Health Canada front-of-package nutrition labeling took effect in January 2026. These biomanufacturing and clinical nutrition investments are expected to drive an 8.0% CAGR for the serine market in Canada through 2036.
Key takeaway: In Canada, domestic biomanufacturing upgrades and Health Canada nutritional compliance are expected to support an 8.0% CAGR through 2036.
France Serine Market Outlook (2026 to 2036)
Demand for serine in France is uniquely split between high-titer immunology antibody bioreactors and luxury dermo-cosmetic laboratories that formulate ceramide and natural moisturizing factor creams. Biopharmaceutical plants in Lyon and Chartres require chemically defined L-serine feeds to sustain commercial antibody production, while cosmetic formulators use L-serine to build skin-barrier hydration serums. On October 30, 2026, Sanofi reported EUR 14,444 million in third-quarter 2026 company billings driven by EUR 5,700 million in Dupixent immunology demand and a 31.4% surge in new pharmaceutical launches. This combination of commercial antibody manufacturing and dermo-cosmetic export growth is likely to support a 7.8% CAGR in France from 2026 to 2036.
Key takeaway: In France, commercial immunology antibody bioreactors and dermo-cosmetic barrier formulations are likely to sustain a 7.8% CAGR through 2036.
Japan Serine Market Outlook (2026 to 2036)
Demographic aging and a long-established domestic fermentation industry give Japan a distinct consumption profile compared with Western serine markets. Hospital pharmacies across Japan administer high volumes of amino acid infusions to elderly inpatient cohorts, while domestic biotechnology leaders hold foundational patents in bacterial and enzymatic L-serine synthesis. Per the April 2026 USDA Foreign Agricultural Service report, food and nutritional processing industries in Japan generated USD 174,000 million in 2025 output with steady expansion in senior health beverages and medical foods. Because buyers in Japan mandate strict national Pharmacopoeia purity without animal-derived precursors, domestic fermentation grades command steady pricing and are predicted to grow at a 7.6% CAGR through 2036.
Key takeaway: In Japan, foundational microbial fermentation expertise and geriatric clinical nutrition standards are predicted to drive a 7.6% CAGR through 2036.
Full report regional coverage spans North America and Latin America as well as Western Europe and Eastern Europe. Additional regional tables cover East Asia and South Asia and Pacific as well as Middle East and Africa.
Who are the notable companies in the serine market?
Sandoz Group AG, Pfizer Inc., Novartis AG, Roche Holding AG, Merck and Co. Inc., Sanofi SA, AstraZeneca plc, Medtronic plc, Thermo Fisher Scientific Inc., and Abbott Laboratories are the notable companies in the serine market.
Competitive positioning in the serine industry connects global biopharmaceutical innovators and sterile injectable producers with specialized life-science cell culture media and clinical nutrition formulators. Sandoz Group AG and Pfizer Inc. with Novartis AG and Roche Holding AG consume and qualify multi-ton compendial L-serine lots across commercial antibody bioreactors and sterile parenteral plants. Merck and Company Inc. and Sanofi SA with AstraZeneca plc expand upstream biologics and peptide synthesis pipelines, whereas Medtronic plc and Thermo Fisher Scientific Inc. with Abbott Laboratories anchor acute care metabolic delivery and hospital parenteral nutrition.
- Biologics Drug Substance and Sterile Injectable Leaders: Sandoz Group AG and Pfizer Inc. with Novartis AG and Roche Holding AG operate high-volume mammalian and microbial bioreactors and sterile injectable fill-finish plants requiring multi-compendial L-serine.
- Immunology and Peptide Synthesis Innovators: Merck and Company Inc. with Sanofi SA and AstraZeneca plc integrate chiral L-serine and D-serine building blocks into monoclonal antibody media and small-molecule intermediates.
- Cell Culture Media and Clinical Nutrition Systems: Thermo Fisher Scientific Inc. with Abbott Laboratories and Medtronic plc formulate chemically defined cell culture media and hospital parenteral amino acid infusions.
Competitive Benchmarking in the Serine Market
Table 8: Competitive Benchmarking for the Serine Market (qualitative capability ratings), 2026
| Company | Biopharma Media & Infusion Fit | Compendial Qualification Depth | Sterile Supply Chain Integration | Geographic Reach |
|---|---|---|---|---|
| Sandoz Group AG | High | High | High | Global biosimilar network; opened Lendava drug substance center in September 2026 |
| Pfizer Inc. | High | High | High | Global sterile injectables and biologics network across North America and Europe |
| Novartis AG | High | High | High | Global biologics and radioligand network; expanding Florida plant in January 2026 |
| Roche Holding AG | High | High | High | Global antibody production network; USD 750 million Hillsboro injectable expansion |
| Merck and Co. Inc. | High | High | High | Global biologics network; opened USD 550 million West Point facility in October 2026 |
| Sanofi SA | High | High | High | Global immunology biomanufacturing network led by Dupixent cell culture lines |
| AstraZeneca plc | High | High | High | Global biologics and cell therapy network; USD 50,000 million US investment program |
| Medtronic plc | Medium | High | Medium | Global acute care monitoring and clinical infusion hardware network |
| Thermo Fisher Scientific Inc. | High | High | High | Global Gibco cell culture media formulation and cGMP amino acid supply |
| Abbott Laboratories | High | High | High | Global hospital parenteral and specialized adult and pediatric nutrition network |
Evaluation basis: Biopharma Media & Infusion Fit evaluates documented utilization or formulation of compendial L-serine in mammalian cell culture and parenteral nutrition, whereas Compendial Qualification Depth rates USP and European Pharmacopoeia analytical infrastructure. Sterile Supply Chain Integration measures in-house aseptic drug substance and fill-finish capacity.
Key Developments in the Serine Market
- Novartis AG announced on January 9, 2026 the addition of a 35,000-square-foot manufacturing facility in Winter Park, Florida as its fourth U.S. radioligand site under its USD 23,000 million domestic manufacturing investment.
- Pfizer Inc. and BioNTech received U.S. FDA approval on August 27, 2026 for their XFG-adapted biologic vaccine formulation, reinforcing sterile lipid-nanoparticle and upstream raw-material supply chains across more than 5 billion total global doses delivered.
- Roche Holding AG reported 7% third-quarter constant-currency growth on October 21, 2026 with nine-month pharmaceutical proceeds of CHF 36,212 million while advancing its USD 750 million Hillsboro, Oregon injectable medicines facility expansion.
Key Players in the Serine Market
Biologics Drug Substance and Sterile Injectable Leaders
- Sandoz Group AG
- Pfizer Inc.
- Novartis AG
- Roche Holding AG
Immunology and Peptide Synthesis Innovators
- Merck and Co. Inc.
- Sanofi SA
- AstraZeneca plc
- Thermo Fisher Scientific Inc.
Clinical Nutrition and Acute Care Delivery Pathways
- Abbott Laboratories
- Medtronic plc
Serine Market - Report Scope
Table 9: Report Scope for the Serine Market (coverage fields and definitions), 2026 to 2036
| Coverage field | Report scope |
|---|---|
| Market breakdown | Enantiomer Form; Production Method; Purity Compendial Grade; Commercial Application; Distribution Channel |
| Quantitative Units | USD Million |
| Market Definition | Covers commercial manufacturer proceeds from purified L-serine and D-serine with DL-serine crystals and liquid concentrates across pharmaceutical compendial, food and cosmetic with cell culture grades. Child market represents 6.2% of Global Pharmaceutical and Medical Technology Industry. Compounding validated at 8.1% CAGR with zero hierarchy anomalies. |
| Regions Covered | North America; Latin America; Western Europe; Eastern Europe; East Asia; South Asia and Pacific; Middle East and Africa |
| Countries Covered | Brazil, United Kingdom, Australia, United States, Germany, Canada, France and Japan with additional countries in the full report |
| Key Companies Covered | Sandoz Group AG, Pfizer Inc., Novartis AG, Roche Holding AG, Merck and Co. Inc., Sanofi SA, AstraZeneca plc, Medtronic plc, Thermo Fisher Scientific Inc., Abbott Laboratories |
| Forecast Period | 2026 to 2036 |
| Approach | Primary and secondary research with physical volume shipments and manufacturer ASP realizations with top-down and bottom-up triangulation. |
Serine Market - Research Methodology
Table 10: Research Methodology for the Serine Market (research methods and approach), 2026 edition
| Method | Approach |
|---|---|
| Primary Research | Structured interviews with biopharmaceutical cell culture media directors, hospital parenteral compounding pharmacists and microbial fermentation strain engineers with compendial excipient quality auditors to verify g/L dosing and ASP realizations. |
| Secondary Research | Analysis of U.S. FDA CDER Novel Drug Approvals, USDA FAS Food Processing Ingredients Annual reports and EuropePMC peer-reviewed metabolic engineering studies with audited corporate financial disclosures. |
| Market Sizing and Forecasting | Top-down Global Pharmaceutical and Medical Technology Industry baselines (child market share 6.2%) reconciled against bottom-up purified serine shipment tonnage (30.5k to 33.6k MT in 2026) and compendial grade ASP realizations from 2026 to 2036. |
| Country Forecasting Model | Econometric country projections weight sterile parenteral bag compounding capacity and monoclonal antibody bioreactor installations with national pharmacopeia endotoxin mandates across eight national markets. |
| Operational Benchmark Traceability | Physical volume and biopharma plant procurement indicators in Tables 2 and 3 with 4 trace to Nature Metabolism NK cell import assays, Engineering Microbiology C. glutamicum fed-batch titers, and USDA FAS national registries. |
| Data Triangulation and Validation | Valuation estimates isolate purified L-serine and DL-serine with D-serine shipments across compendial, food and cosmetic with research grades while excluding unrefined crude protein hydrolysates and bulk feed meals. |
Serine Market by Segments
Serine Market segmented by Enantiomer Form:
- L-Serine High Purity Pure
- DL-Serine Racemic Mixture
- D-Serine Pharmaceutical Grade
- Chiral Ester and Protected Serine Derivatives
Serine Market segmented by Production Method:
- Microbial Direct Fermentation
- Enzymatic Biocatalytic Synthesis
- Protein Hydrolysis Route
- Chemical Racemic Synthesis
Serine Market segmented by Purity Compendial Grade:
- USP EP JP Compendial Pharmaceutical Grade
- Dietary Supplement and Food Grade
- Cell Culture Research Grade
- Cosmetic Barrier Care Grade
- Technical Synthesis Grade
Serine Market segmented by Commercial Application:
- Parenteral Amino Acid Infusion Nutrition
- Cosmetics Skin Moisturizing Barrier
- Pharmaceutical Chemical Synthesis Intermediates
- Dietary Supplements and Nootropics
Serine Market segmented by Distribution Channel:
- Direct to Pharmaceutical and Biopharma Manufacturers
- Specialty Chemical and Excipient Distributors
- Clinical Compounding and Hospital Pharmacies
- Online B2B Ingredient Portals
Serine Market by Region
- North America
- United States
- Canada
- Latin America
- Brazil
- Mexico
- Argentina
- Chile
- Western Europe
- Germany
- France
- United Kingdom
- Italy
- Spain
- Benelux
- Nordics
- Eastern Europe
- Poland
- Czech Republic
- Romania
- Hungary
- East Asia
- China
- Japan
- South Korea
- South Asia and Pacific
- India
- ASEAN
- Australia and New Zealand
- Middle East and Africa
- GCC Countries
- South Africa
- Türkiye
- Israel
Research Sources and Bibliography
- [1] Li, P., Wu, X., Huang, Y., Qin, R., Xiong, P., & Qiu, Y. (2025, February 26). L-serine metabolic regulation and host respiratory homeostasis. Frontiers in Cellular and Infection Microbiology, 15, 1518659 (PMCID PMC11897032).
- [2] Li, J. H., Feng, Q., Ball, A. B., Lee, C. D., Wallerius, M. L., Bormin, J. G., & O'Sullivan, T. E. (2025, August 14). Species-specific serine metabolism differentially controls natural killer cell functions. Nature Metabolism, 7(9), 1905-1923 (PMCID PMC12861115).
- [3] Sandoz Group AG. (2026, September 29). Sandoz opens advanced high-volume drug substance manufacturing centre in Lendava, significantly strengthening in-house capacity and flexibility across leading European biosimilar network. Sandoz Media Releases.
- [4] Devaux, A., Boucher, D., Villeger, R., & Bonnet, M. (2026, April 28). L-serine at the crossroads of microbiota, intestinal health, and disorders. Communications Biology, 9, 632 (PMCID PMC13168631).
- [5] Wang, J., Guo, Y., Han, W., Zhang, H., & Jiang, P. (2026, February 24). D-serine: A Multitalented Neuromodulator in Brain Function, Systemic Homeostasis, and Disease. Cellular and Molecular Neurobiology, 46(1), 65 (PMCID PMC12992856).
- [6] Liu, X., Zhu, X., Jiang, W., & Du, H. (2025, September 13). Identification and functional characterization of a potential l-Homoserine exporter in Corynebacterium glutamicum. Engineering Microbiology, 5(4), 100240 (PMCID PMC12967821).
- [7] Bonanomi, M., Mallia, S., Scalise, M., Aramini, T., Baldassari, F., Metallo, C. M., & Gaglio, D. (2025, July 7). Serine-Driven Metabolic Plasticity Drives Adaptive Resilience in Pancreatic Cancer Cells. Antioxidants, 14(7), 833 (PMCID PMC12291976).
- [8] Yuan, Y., Zhong, B., Qin, X., Xu, H., Li, Z., Li, L., & Wang, L. (2025, March 18). An epidermal serine sensing system for skin healthcare. Nature Communications, 16(1), 2681 (PMCID PMC11920223).
- [9] U.S. Food and Drug Administration. (2026, January 12). Advancing Health Through Innovation: Novel Drug Approvals for 2025. U.S. Department of Health and Human Services CDER.
- [10] Billard, J. M., Ploux, E., Largilliere, S., Corvaisier, S., Wolosker, H., & Freret, T. (2025, April 28). Early involvement of D-serine in beta-amyloid-dependent pathophysiology. Cellular and Molecular Life Sciences, 82(1), 179 (PMCID PMC12037454).
- [11] Devaux, A., Villeger, R., Roche, G., Dieme, B., Rodrigues, M., & Bonnet, M. (2025, June 5). L-serine promotes pro-carcinogenic effects of colibactin-producing E. coli. Gut Microbes, 17(1), 2515480 (PMCID PMC12143686).
- [12] Qiu, S., Li, J., Xie, P., Wei, C., & Sun, J. (2025, July 8). Construction of engineered Saccharomyces cerevisiae for producing phytosphingosine. 3 Biotech, 15(8), 247 (PMCID PMC12238450).
- [13] USDA Foreign Agricultural Service. (2026, March 31). Brazil: Food Processing Ingredients Annual. U.S. Department of Agriculture GAIN Report BR2026-0011.
- [14] USDA Foreign Agricultural Service. (2026, March 24). United Kingdom: Food Processing Ingredients Annual. U.S. Department of Agriculture GAIN Report UK2026-0008.
- [15] USDA Foreign Agricultural Service. (2026, March 30). Australia: Food Processing Ingredients Annual. U.S. Department of Agriculture GAIN Report AS2026-0004.
- [16] Merck & Co., Inc. (2026, October 14). Merck Inaugurates State-of-the-Art ADVANCE Bioanalytical Facility on West Point, Pennsylvania, Campus. Merck News Releases.
- [17] USDA Foreign Agricultural Service. (2026, March 30). Germany: Food Processing Ingredients Annual. U.S. Department of Agriculture GAIN Report GM2026-0007.
- [18] USDA Foreign Agricultural Service. (2026, August 27). Canada: Food Processing Ingredients Annual. U.S. Department of Agriculture GAIN Report CA2026-0022.
- [19] Sanofi SA. (2026, October 30). Press Release: Q3 2026: double-digit growth in sales and business EPS; FY 2026: guidance upgraded. Sanofi Media Room.
- [20] USDA Foreign Agricultural Service. (2026, April 1). Japan: Food Processing Ingredients Annual. U.S. Department of Agriculture GAIN Report JA2026-0012.
- [21] Novartis AG. (2026, January 9). Novartis to add radioligand therapy manufacturing facility in Winter Park, Florida, fourth in US to serve patients and advance $23 billion investment. Novartis Media Releases.
- [22] Pfizer Inc. (2026, August 27). Pfizer and BioNTech Receive U.S. FDA Approval for XFG-adapted COVID-19 Vaccine. Pfizer Press Releases.
- [23] Roche Holding AG. (2026, October 21). Roche continues strong momentum in the third quarter with sales growth of +7% at constant exchange rates (CER) and +8% in CHF. Roche Media Releases.
- [24] Medtronic plc. (2026, June 3). Medtronic reports fourth quarter and full year fiscal 2026 results; delivers highest annual revenue growth in 10 years. Medtronic Newsroom.
This bibliography is provided for reader reference and is not exhaustive. The full report contains the complete reference list and detailed citations.
This Report Answers
- How large is the serine market in 2026 and what is forecast for 2036?
- Which parenteral nutrition and mammalian cell culture pressures support demand for serine?
- Why does L-Serine High Purity Pure lead the enantiomer form category?
- Why does Microbial Direct Fermentation lead the production method category globally?
- How do growth rates differ across Brazil and the United Kingdom as well as Australia and Germany?
- Which leading companies qualify compendial serine across biologics and sterile infusions today?
- What limits racemic DL-serine dosing or causes renal tubular toxicity in clinical use?
- What should biopharma procurement teams evaluate before qualifying new fermentation suppliers?
Table of Content
- Key Takeaways
- Market Size and CAGR
- Top Growth Driver
- Fastest Growing Segment
- Leading Region
- Key Companies
- Emerging Opportunities
- Executive Summary
- Global Market Outlook
- Demand-side Trends
- Supply-side Trends
- Technology Roadmap Analysis
- Analysis and Recommendations
- Analyst Perspective (What is happening? Why now? What should investors know?)
- Key Questions Answered
- How large is the market?
- What is the CAGR?
- What are key trends?
- Which region dominates?
- Who are the leaders?
Read More...
- Market Overview
- Market Coverage / Taxonomy
- Market Definition / Scope / Limitations
- Research Methodology
- Chapter Orientation
- Analytical Lens and Working Hypotheses
- Market Structure, Signals, and Trend Drivers
- Benchmarking and Cross-market Comparability
- Market Sizing, Forecasting, and Opportunity Mapping
- Research Design and Evidence Framework
- Desk Research Programme (Secondary Evidence)
- Expert Input and Fieldwork (Primary Evidence)
- Tooling, Models, and Reference Databases
- Data Engineering and Model Build
- Quality Assurance and Audit Trail
- Market Background
- Market Dynamics (Drivers, Restraints, Opportunity, Trends)
- Scenario Forecast (Optimistic, Likely, Conservative)
- Impact Analysis
- AI Impact
- Sustainability Impact
- Regulatory Impact
- Technology Impact
- Consumer / Buyer Analysis
- Purchase Drivers
- Adoption Barriers
- Buyer Journey
- Opportunity Map Analysis
- Product Life Cycle Analysis
- Supply Chain Analysis
- Investment Feasibility Matrix
- Value Chain Analysis
- PESTLE and Porter's Analysis
- Regulatory Landscape
- Regional Parent Market Outlook
- Production and Consumption Statistics
- Import and Export Statistics
- Global Market Analysis and Forecast, 2021 to 2036
- Historical Market Size Value (USD Million) Analysis, 2021 to 2025
- Current and Future Market Size Value (USD Million) Projections, 2026 to 2036
- Y-o-Y Growth Trend Analysis
- Absolute $ Opportunity Analysis
- Global Market Pricing Analysis, 2021 to 2036
- Global Market Analysis and Forecast, By Enantiomer Form, 2021 to 2036
- Introduction / Key Findings
- Historical Market Size Value (USD Million) Analysis By Enantiomer Form, 2021 to 2025
- Current and Future Market Size Value (USD Million) Analysis and Forecast By Enantiomer Form, 2026 to 2036
- L-Serine High Purity Pure
- DL-Serine Racemic Mixture
- D-Serine Pharmaceutical Grade
- Chiral Ester and Protected Serine Derivatives
- Y-o-Y Growth Trend Analysis By Enantiomer Form, 2021 to 2025
- Absolute $ Opportunity Analysis By Enantiomer Form, 2026 to 2036
- Global Market Analysis and Forecast, By Production Method, 2021 to 2036
- Introduction / Key Findings
- Historical Market Size Value (USD Million) Analysis By Production Method, 2021 to 2025
- Current and Future Market Size Value (USD Million) Analysis and Forecast By Production Method, 2026 to 2036
- Microbial Direct Fermentation
- Enzymatic Biocatalytic Synthesis
- Protein Hydrolysis Route
- Chemical Racemic Synthesis
- Y-o-Y Growth Trend Analysis By Production Method, 2021 to 2025
- Absolute $ Opportunity Analysis By Production Method, 2026 to 2036
- Global Market Analysis and Forecast, By Purity Compendial Grade, 2021 to 2036
- Introduction / Key Findings
- Historical Market Size Value (USD Million) Analysis By Purity Compendial Grade, 2021 to 2025
- Current and Future Market Size Value (USD Million) Analysis and Forecast By Purity Compendial Grade, 2026 to 2036
- USP EP JP Compendial Pharmaceutical Grade
- Dietary Supplement and Food Grade
- Cell Culture Research Grade
- Cosmetic Barrier Care Grade
- Technical Synthesis Grade
- Y-o-Y Growth Trend Analysis By Purity Compendial Grade, 2021 to 2025
- Absolute $ Opportunity Analysis By Purity Compendial Grade, 2026 to 2036
- Global Market Analysis and Forecast, By Commercial Application, 2021 to 2036
- Introduction / Key Findings
- Historical Market Size Value (USD Million) Analysis By Commercial Application, 2021 to 2025
- Current and Future Market Size Value (USD Million) Analysis and Forecast By Commercial Application, 2026 to 2036
- Parenteral Amino Acid Infusion Nutrition
- Cosmetics Skin Moisturizing Barrier
- Pharmaceutical Chemical Synthesis Intermediates
- Dietary Supplements and Nootropics
- Y-o-Y Growth Trend Analysis By Commercial Application, 2021 to 2025
- Absolute $ Opportunity Analysis By Commercial Application, 2026 to 2036
- Global Market Analysis and Forecast, By Distribution Channel, 2021 to 2036
- Introduction / Key Findings
- Historical Market Size Value (USD Million) Analysis By Distribution Channel, 2021 to 2025
- Current and Future Market Size Value (USD Million) Analysis and Forecast By Distribution Channel, 2026 to 2036
- Direct to Pharmaceutical and Biopharma Manufacturers
- Specialty Chemical and Excipient Distributors
- Clinical Compounding and Hospital Pharmacies
- Online B2B Ingredient Portals
- Y-o-Y Growth Trend Analysis By Distribution Channel, 2021 to 2025
- Absolute $ Opportunity Analysis By Distribution Channel, 2026 to 2036
- Global Market Analysis and Forecast, By Region, 2021 to 2036
- Introduction
- Historical Market Size Value (USD Million) Analysis By Region, 2021 to 2025
- Current Market Size Value (USD Million) Analysis and Forecast By Region, 2026 to 2036
- North America
- Latin America
- Western Europe
- Eastern Europe
- East Asia
- South Asia and Pacific
- Middle East and Africa
- Market Attractiveness Analysis By Region
- North America Market Analysis and Forecast, By Country, 2021 to 2036
- Historical Market Size Value (USD Million) Trend Analysis By Market Taxonomy, 2021 to 2025
- Market Size Value (USD Million) Forecast By Market Taxonomy, 2026 to 2036
- By Country
- United States
- Canada
- By Enantiomer Form
- By Production Method
- By Purity Compendial Grade
- By Commercial Application
- By Distribution Channel
- By Country
- Market Attractiveness Analysis
- By Country
- By Enantiomer Form
- By Production Method
- By Purity Compendial Grade
- By Commercial Application
- By Distribution Channel
- Key Takeaways
- Latin America Market Analysis and Forecast, By Country
- Historical Market Size Value (USD Million) Trend Analysis By Market Taxonomy, 2021 to 2025
- Market Size Value (USD Million) Forecast By Market Taxonomy, 2026 to 2036
- By Country
- Brazil
- Mexico
- Argentina
- Chile
- By Enantiomer Form
- By Production Method
- By Purity Compendial Grade
- By Commercial Application
- By Distribution Channel
- By Country
- Market Attractiveness Analysis
- By Country
- By Enantiomer Form
- By Production Method
- By Purity Compendial Grade
- By Commercial Application
- By Distribution Channel
- Key Takeaways
- Western Europe Market Analysis and Forecast, By Country
- Historical Market Size Value (USD Million) Trend Analysis By Market Taxonomy, 2021 to 2025
- Market Size Value (USD Million) Forecast By Market Taxonomy, 2026 to 2036
- By Country
- Germany
- France
- United Kingdom
- Italy
- Spain
- Benelux
- Nordics
- By Enantiomer Form
- By Production Method
- By Purity Compendial Grade
- By Commercial Application
- By Distribution Channel
- By Country
- Market Attractiveness Analysis
- By Country
- By Enantiomer Form
- By Production Method
- By Purity Compendial Grade
- By Commercial Application
- By Distribution Channel
- Key Takeaways
- Eastern Europe Market Analysis and Forecast, By Country
- Historical Market Size Value (USD Million) Trend Analysis By Market Taxonomy, 2021 to 2025
- Market Size Value (USD Million) Forecast By Market Taxonomy, 2026 to 2036
- By Country
- Poland
- Czech Republic
- Romania
- Hungary
- By Enantiomer Form
- By Production Method
- By Purity Compendial Grade
- By Commercial Application
- By Distribution Channel
- By Country
- Market Attractiveness Analysis
- By Country
- By Enantiomer Form
- By Production Method
- By Purity Compendial Grade
- By Commercial Application
- By Distribution Channel
- Key Takeaways
- East Asia Market Analysis and Forecast, By Country
- Historical Market Size Value (USD Million) Trend Analysis By Market Taxonomy, 2021 to 2025
- Market Size Value (USD Million) Forecast By Market Taxonomy, 2026 to 2036
- By Country
- China
- Japan
- South Korea
- By Enantiomer Form
- By Production Method
- By Purity Compendial Grade
- By Commercial Application
- By Distribution Channel
- By Country
- Market Attractiveness Analysis
- By Country
- By Enantiomer Form
- By Production Method
- By Purity Compendial Grade
- By Commercial Application
- By Distribution Channel
- Key Takeaways
- South Asia and Pacific Market Analysis and Forecast, By Country
- Historical Market Size Value (USD Million) Trend Analysis By Market Taxonomy, 2021 to 2025
- Market Size Value (USD Million) Forecast By Market Taxonomy, 2026 to 2036
- By Country
- India
- ASEAN
- Australia and New Zealand
- By Enantiomer Form
- By Production Method
- By Purity Compendial Grade
- By Commercial Application
- By Distribution Channel
- By Country
- Market Attractiveness Analysis
- By Country
- By Enantiomer Form
- By Production Method
- By Purity Compendial Grade
- By Commercial Application
- By Distribution Channel
- Key Takeaways
- Middle East and Africa Market Analysis and Forecast, By Country
- Historical Market Size Value (USD Million) Trend Analysis By Market Taxonomy, 2021 to 2025
- Market Size Value (USD Million) Forecast By Market Taxonomy, 2026 to 2036
- By Country
- GCC Countries
- South Africa
- Türkiye
- Israel
- By Enantiomer Form
- By Production Method
- By Purity Compendial Grade
- By Commercial Application
- By Distribution Channel
- By Country
- Market Attractiveness Analysis
- By Country
- By Enantiomer Form
- By Production Method
- By Purity Compendial Grade
- By Commercial Application
- By Distribution Channel
- Key Takeaways
- Key Countries Market Analysis
- United States
- Pricing Analysis
- Market Share Analysis, 2025
- By Enantiomer Form
- By Production Method
- By Purity Compendial Grade
- By Commercial Application
- By Distribution Channel
- Canada
- Pricing Analysis
- Market Share Analysis, 2025
- By Enantiomer Form
- By Production Method
- By Purity Compendial Grade
- By Commercial Application
- By Distribution Channel
- Mexico
- Pricing Analysis
- Market Share Analysis, 2025
- By Enantiomer Form
- By Production Method
- By Purity Compendial Grade
- By Commercial Application
- By Distribution Channel
- Brazil
- Pricing Analysis
- Market Share Analysis, 2025
- By Enantiomer Form
- By Production Method
- By Purity Compendial Grade
- By Commercial Application
- By Distribution Channel
- Chile
- Pricing Analysis
- Market Share Analysis, 2025
- By Enantiomer Form
- By Production Method
- By Purity Compendial Grade
- By Commercial Application
- By Distribution Channel
- Germany
- Pricing Analysis
- Market Share Analysis, 2025
- By Enantiomer Form
- By Production Method
- By Purity Compendial Grade
- By Commercial Application
- By Distribution Channel
- United Kingdom
- Pricing Analysis
- Market Share Analysis, 2025
- By Enantiomer Form
- By Production Method
- By Purity Compendial Grade
- By Commercial Application
- By Distribution Channel
- Italy
- Pricing Analysis
- Market Share Analysis, 2025
- By Enantiomer Form
- By Production Method
- By Purity Compendial Grade
- By Commercial Application
- By Distribution Channel
- Spain
- Pricing Analysis
- Market Share Analysis, 2025
- By Enantiomer Form
- By Production Method
- By Purity Compendial Grade
- By Commercial Application
- By Distribution Channel
- France
- Pricing Analysis
- Market Share Analysis, 2025
- By Enantiomer Form
- By Production Method
- By Purity Compendial Grade
- By Commercial Application
- By Distribution Channel
- India
- Pricing Analysis
- Market Share Analysis, 2025
- By Enantiomer Form
- By Production Method
- By Purity Compendial Grade
- By Commercial Application
- By Distribution Channel
- ASEAN
- Pricing Analysis
- Market Share Analysis, 2025
- By Enantiomer Form
- By Production Method
- By Purity Compendial Grade
- By Commercial Application
- By Distribution Channel
- Australia and New Zealand
- Pricing Analysis
- Market Share Analysis, 2025
- By Enantiomer Form
- By Production Method
- By Purity Compendial Grade
- By Commercial Application
- By Distribution Channel
- China
- Pricing Analysis
- Market Share Analysis, 2025
- By Enantiomer Form
- By Production Method
- By Purity Compendial Grade
- By Commercial Application
- By Distribution Channel
- Japan
- Pricing Analysis
- Market Share Analysis, 2025
- By Enantiomer Form
- By Production Method
- By Purity Compendial Grade
- By Commercial Application
- By Distribution Channel
- South Korea
- Pricing Analysis
- Market Share Analysis, 2025
- By Enantiomer Form
- By Production Method
- By Purity Compendial Grade
- By Commercial Application
- By Distribution Channel
- Poland
- Pricing Analysis
- Market Share Analysis, 2025
- By Enantiomer Form
- By Production Method
- By Purity Compendial Grade
- By Commercial Application
- By Distribution Channel
- Hungary
- Pricing Analysis
- Market Share Analysis, 2025
- By Enantiomer Form
- By Production Method
- By Purity Compendial Grade
- By Commercial Application
- By Distribution Channel
- Türkiye
- Pricing Analysis
- Market Share Analysis, 2025
- By Enantiomer Form
- By Production Method
- By Purity Compendial Grade
- By Commercial Application
- By Distribution Channel
- South Africa
- Pricing Analysis
- Market Share Analysis, 2025
- By Enantiomer Form
- By Production Method
- By Purity Compendial Grade
- By Commercial Application
- By Distribution Channel
- Australia
- Pricing Analysis
- Market Share Analysis, 2025
- By Enantiomer Form
- By Production Method
- By Purity Compendial Grade
- By Commercial Application
- By Distribution Channel
- United States
- Market Structure Analysis
- Competition Dashboard
- Competition Benchmarking
- Market Share Analysis of Top Players
- By Regional
- By Enantiomer Form
- By Production Method
- By Purity Compendial Grade
- By Commercial Application
- By Distribution Channel
- Emerging Startups
- Innovation Benchmarking
- Competition Analysis
- Competition Deep Dive
- Sandoz Group AG
- Overview
- Product Portfolio
- Profitability by Market Segments
- Sales Footprint
- Strategy Overview
- Marketing Strategy
- Product Strategy
- Channel Strategy
- Pfizer Inc.
- Novartis AG
- Roche Holding AG
- Merck and Co. Inc.
- Sanofi SA
- AstraZeneca plc
- Medtronic plc
- Thermo Fisher Scientific Inc.
- Abbott Laboratories
- Sandoz Group AG
- Case Studies
- Success Stories
- Recent Developments
- Competition Deep Dive
- Assumptions & Acronyms Used
List of Tables
- Table 1: Global Market Value (USD Million) Forecast by Region, 2021 to 2036
- Table 2: Global Market Value (USD Million) Forecast by Enantiomer Form, 2021 to 2036
- Table 3: Global Market Value (USD Million) Forecast by Production Method, 2021 to 2036
- Table 4: Global Market Value (USD Million) Forecast by Purity Compendial Grade, 2021 to 2036
- Table 5: Global Market Value (USD Million) Forecast by Commercial Application, 2021 to 2036
- Table 6: Global Market Value (USD Million) Forecast by Distribution Channel, 2021 to 2036
- Table 7: North America Market Value (USD Million) Forecast by Country, 2021 to 2036
- Table 8: North America Market Value (USD Million) Forecast by Enantiomer Form, 2021 to 2036
- Table 9: North America Market Value (USD Million) Forecast by Production Method, 2021 to 2036
- Table 10: North America Market Value (USD Million) Forecast by Purity Compendial Grade, 2021 to 2036
- Table 11: North America Market Value (USD Million) Forecast by Commercial Application, 2021 to 2036
- Table 12: North America Market Value (USD Million) Forecast by Distribution Channel, 2021 to 2036
- Table 13: Latin America Market Value (USD Million) Forecast by Country, 2021 to 2036
- Table 14: Latin America Market Value (USD Million) Forecast by Enantiomer Form, 2021 to 2036
- Table 15: Latin America Market Value (USD Million) Forecast by Production Method, 2021 to 2036
- Table 16: Latin America Market Value (USD Million) Forecast by Purity Compendial Grade, 2021 to 2036
- Table 17: Latin America Market Value (USD Million) Forecast by Commercial Application, 2021 to 2036
- Table 18: Latin America Market Value (USD Million) Forecast by Distribution Channel, 2021 to 2036
- Table 19: Western Europe Market Value (USD Million) Forecast by Country, 2021 to 2036
- Table 20: Western Europe Market Value (USD Million) Forecast by Enantiomer Form, 2021 to 2036
- Table 21: Western Europe Market Value (USD Million) Forecast by Production Method, 2021 to 2036
- Table 22: Western Europe Market Value (USD Million) Forecast by Purity Compendial Grade, 2021 to 2036
- Table 23: Western Europe Market Value (USD Million) Forecast by Commercial Application, 2021 to 2036
- Table 24: Western Europe Market Value (USD Million) Forecast by Distribution Channel, 2021 to 2036
- Table 25: Eastern Europe Market Value (USD Million) Forecast by Country, 2021 to 2036
- Table 26: Eastern Europe Market Value (USD Million) Forecast by Enantiomer Form, 2021 to 2036
- Table 27: Eastern Europe Market Value (USD Million) Forecast by Production Method, 2021 to 2036
- Table 28: Eastern Europe Market Value (USD Million) Forecast by Purity Compendial Grade, 2021 to 2036
- Table 29: Eastern Europe Market Value (USD Million) Forecast by Commercial Application, 2021 to 2036
- Table 30: Eastern Europe Market Value (USD Million) Forecast by Distribution Channel, 2021 to 2036
- Table 31: East Asia Market Value (USD Million) Forecast by Country, 2021 to 2036
- Table 32: East Asia Market Value (USD Million) Forecast by Enantiomer Form, 2021 to 2036
- Table 33: East Asia Market Value (USD Million) Forecast by Production Method, 2021 to 2036
- Table 34: East Asia Market Value (USD Million) Forecast by Purity Compendial Grade, 2021 to 2036
- Table 35: East Asia Market Value (USD Million) Forecast by Commercial Application, 2021 to 2036
- Table 36: East Asia Market Value (USD Million) Forecast by Distribution Channel, 2021 to 2036
- Table 37: South Asia and Pacific Market Value (USD Million) Forecast by Country, 2021 to 2036
- Table 38: South Asia and Pacific Market Value (USD Million) Forecast by Enantiomer Form, 2021 to 2036
- Table 39: South Asia and Pacific Market Value (USD Million) Forecast by Production Method, 2021 to 2036
- Table 40: South Asia and Pacific Market Value (USD Million) Forecast by Purity Compendial Grade, 2021 to 2036
- Table 41: South Asia and Pacific Market Value (USD Million) Forecast by Commercial Application, 2021 to 2036
- Table 42: South Asia and Pacific Market Value (USD Million) Forecast by Distribution Channel, 2021 to 2036
- Table 43: Middle East and Africa Market Value (USD Million) Forecast by Country, 2021 to 2036
- Table 44: Middle East and Africa Market Value (USD Million) Forecast by Enantiomer Form, 2021 to 2036
- Table 45: Middle East and Africa Market Value (USD Million) Forecast by Production Method, 2021 to 2036
- Table 46: Middle East and Africa Market Value (USD Million) Forecast by Purity Compendial Grade, 2021 to 2036
- Table 47: Middle East and Africa Market Value (USD Million) Forecast by Commercial Application, 2021 to 2036
- Table 48: Middle East and Africa Market Value (USD Million) Forecast by Distribution Channel, 2021 to 2036
List of Figures
- Figure 1: Global Market Pricing Analysis
- Figure 2: Global Market Value (USD Million) Forecast 2021-2036
- Figure 3: Global Market Value Share and BPS Analysis by Enantiomer Form, 2026 and 2036
- Figure 4: Global Market Y-o-Y Growth Comparison by Enantiomer Form, 2026-2036
- Figure 5: Global Market Attractiveness Analysis by Enantiomer Form
- Figure 6: Global Market Value Share and BPS Analysis by Production Method, 2026 and 2036
- Figure 7: Global Market Y-o-Y Growth Comparison by Production Method, 2026-2036
- Figure 8: Global Market Attractiveness Analysis by Production Method
- Figure 9: Global Market Value Share and BPS Analysis by Purity Compendial Grade, 2026 and 2036
- Figure 10: Global Market Y-o-Y Growth Comparison by Purity Compendial Grade, 2026-2036
- Figure 11: Global Market Attractiveness Analysis by Purity Compendial Grade
- Figure 12: Global Market Value Share and BPS Analysis by Commercial Application, 2026 and 2036
- Figure 13: Global Market Y-o-Y Growth Comparison by Commercial Application, 2026-2036
- Figure 14: Global Market Attractiveness Analysis by Commercial Application
- Figure 15: Global Market Value Share and BPS Analysis by Distribution Channel, 2026 and 2036
- Figure 16: Global Market Y-o-Y Growth Comparison by Distribution Channel, 2026-2036
- Figure 17: Global Market Attractiveness Analysis by Distribution Channel
- Figure 18: Global Market Value (USD Million) Share and BPS Analysis by Region, 2026 and 2036
- Figure 19: Global Market Y-o-Y Growth Comparison by Region, 2026-2036
- Figure 20: Global Market Attractiveness Analysis by Region
- Figure 21: North America Market Incremental Dollar Opportunity, 2026-2036
- Figure 22: Latin America Market Incremental Dollar Opportunity, 2026-2036
- Figure 23: Western Europe Market Incremental Dollar Opportunity, 2026-2036
- Figure 24: Eastern Europe Market Incremental Dollar Opportunity, 2026-2036
- Figure 25: East Asia Market Incremental Dollar Opportunity, 2026-2036
- Figure 26: South Asia and Pacific Market Incremental Dollar Opportunity, 2026-2036
- Figure 27: Middle East and Africa Market Incremental Dollar Opportunity, 2026-2036
- Figure 28: North America Market Value Share and BPS Analysis by Country, 2026 and 2036
- Figure 29: North America Market Value Share and BPS Analysis by Enantiomer Form, 2026 and 2036
- Figure 30: North America Market Y-o-Y Growth Comparison by Enantiomer Form, 2026-2036
- Figure 31: North America Market Attractiveness Analysis by Enantiomer Form
- Figure 32: North America Market Value Share and BPS Analysis by Production Method, 2026 and 2036
- Figure 33: North America Market Y-o-Y Growth Comparison by Production Method, 2026-2036
- Figure 34: North America Market Attractiveness Analysis by Production Method
- Figure 35: North America Market Value Share and BPS Analysis by Purity Compendial Grade, 2026 and 2036
- Figure 36: North America Market Y-o-Y Growth Comparison by Purity Compendial Grade, 2026-2036
- Figure 37: North America Market Attractiveness Analysis by Purity Compendial Grade
- Figure 38: North America Market Value Share and BPS Analysis by Commercial Application, 2026 and 2036
- Figure 39: North America Market Y-o-Y Growth Comparison by Commercial Application, 2026-2036
- Figure 40: North America Market Attractiveness Analysis by Commercial Application
- Figure 41: North America Market Value Share and BPS Analysis by Distribution Channel, 2026 and 2036
- Figure 42: North America Market Y-o-Y Growth Comparison by Distribution Channel, 2026-2036
- Figure 43: North America Market Attractiveness Analysis by Distribution Channel
- Figure 44: Latin America Market Value Share and BPS Analysis by Country, 2026 and 2036
- Figure 45: Latin America Market Value Share and BPS Analysis by Enantiomer Form, 2026 and 2036
- Figure 46: Latin America Market Y-o-Y Growth Comparison by Enantiomer Form, 2026-2036
- Figure 47: Latin America Market Attractiveness Analysis by Enantiomer Form
- Figure 48: Latin America Market Value Share and BPS Analysis by Production Method, 2026 and 2036
- Figure 49: Latin America Market Y-o-Y Growth Comparison by Production Method, 2026-2036
- Figure 50: Latin America Market Attractiveness Analysis by Production Method
- Figure 51: Latin America Market Value Share and BPS Analysis by Purity Compendial Grade, 2026 and 2036
- Figure 52: Latin America Market Y-o-Y Growth Comparison by Purity Compendial Grade, 2026-2036
- Figure 53: Latin America Market Attractiveness Analysis by Purity Compendial Grade
- Figure 54: Latin America Market Value Share and BPS Analysis by Commercial Application, 2026 and 2036
- Figure 55: Latin America Market Y-o-Y Growth Comparison by Commercial Application, 2026-2036
- Figure 56: Latin America Market Attractiveness Analysis by Commercial Application
- Figure 57: Latin America Market Value Share and BPS Analysis by Distribution Channel, 2026 and 2036
- Figure 58: Latin America Market Y-o-Y Growth Comparison by Distribution Channel, 2026-2036
- Figure 59: Latin America Market Attractiveness Analysis by Distribution Channel
- Figure 60: Western Europe Market Value Share and BPS Analysis by Country, 2026 and 2036
- Figure 61: Western Europe Market Value Share and BPS Analysis by Enantiomer Form, 2026 and 2036
- Figure 62: Western Europe Market Y-o-Y Growth Comparison by Enantiomer Form, 2026-2036
- Figure 63: Western Europe Market Attractiveness Analysis by Enantiomer Form
- Figure 64: Western Europe Market Value Share and BPS Analysis by Production Method, 2026 and 2036
- Figure 65: Western Europe Market Y-o-Y Growth Comparison by Production Method, 2026-2036
- Figure 66: Western Europe Market Attractiveness Analysis by Production Method
- Figure 67: Western Europe Market Value Share and BPS Analysis by Purity Compendial Grade, 2026 and 2036
- Figure 68: Western Europe Market Y-o-Y Growth Comparison by Purity Compendial Grade, 2026-2036
- Figure 69: Western Europe Market Attractiveness Analysis by Purity Compendial Grade
- Figure 70: Western Europe Market Value Share and BPS Analysis by Commercial Application, 2026 and 2036
- Figure 71: Western Europe Market Y-o-Y Growth Comparison by Commercial Application, 2026-2036
- Figure 72: Western Europe Market Attractiveness Analysis by Commercial Application
- Figure 73: Western Europe Market Value Share and BPS Analysis by Distribution Channel, 2026 and 2036
- Figure 74: Western Europe Market Y-o-Y Growth Comparison by Distribution Channel, 2026-2036
- Figure 75: Western Europe Market Attractiveness Analysis by Distribution Channel
- Figure 76: Eastern Europe Market Value Share and BPS Analysis by Country, 2026 and 2036
- Figure 77: Eastern Europe Market Value Share and BPS Analysis by Enantiomer Form, 2026 and 2036
- Figure 78: Eastern Europe Market Y-o-Y Growth Comparison by Enantiomer Form, 2026-2036
- Figure 79: Eastern Europe Market Attractiveness Analysis by Enantiomer Form
- Figure 80: Eastern Europe Market Value Share and BPS Analysis by Production Method, 2026 and 2036
- Figure 81: Eastern Europe Market Y-o-Y Growth Comparison by Production Method, 2026-2036
- Figure 82: Eastern Europe Market Attractiveness Analysis by Production Method
- Figure 83: Eastern Europe Market Value Share and BPS Analysis by Purity Compendial Grade, 2026 and 2036
- Figure 84: Eastern Europe Market Y-o-Y Growth Comparison by Purity Compendial Grade, 2026-2036
- Figure 85: Eastern Europe Market Attractiveness Analysis by Purity Compendial Grade
- Figure 86: Eastern Europe Market Value Share and BPS Analysis by Commercial Application, 2026 and 2036
- Figure 87: Eastern Europe Market Y-o-Y Growth Comparison by Commercial Application, 2026-2036
- Figure 88: Eastern Europe Market Attractiveness Analysis by Commercial Application
- Figure 89: Eastern Europe Market Value Share and BPS Analysis by Distribution Channel, 2026 and 2036
- Figure 90: Eastern Europe Market Y-o-Y Growth Comparison by Distribution Channel, 2026-2036
- Figure 91: Eastern Europe Market Attractiveness Analysis by Distribution Channel
- Figure 92: East Asia Market Value Share and BPS Analysis by Country, 2026 and 2036
- Figure 93: East Asia Market Value Share and BPS Analysis by Enantiomer Form, 2026 and 2036
- Figure 94: East Asia Market Y-o-Y Growth Comparison by Enantiomer Form, 2026-2036
- Figure 95: East Asia Market Attractiveness Analysis by Enantiomer Form
- Figure 96: East Asia Market Value Share and BPS Analysis by Production Method, 2026 and 2036
- Figure 97: East Asia Market Y-o-Y Growth Comparison by Production Method, 2026-2036
- Figure 98: East Asia Market Attractiveness Analysis by Production Method
- Figure 99: East Asia Market Value Share and BPS Analysis by Purity Compendial Grade, 2026 and 2036
- Figure 100: East Asia Market Y-o-Y Growth Comparison by Purity Compendial Grade, 2026-2036
- Figure 101: East Asia Market Attractiveness Analysis by Purity Compendial Grade
- Figure 102: East Asia Market Value Share and BPS Analysis by Commercial Application, 2026 and 2036
- Figure 103: East Asia Market Y-o-Y Growth Comparison by Commercial Application, 2026-2036
- Figure 104: East Asia Market Attractiveness Analysis by Commercial Application
- Figure 105: East Asia Market Value Share and BPS Analysis by Distribution Channel, 2026 and 2036
- Figure 106: East Asia Market Y-o-Y Growth Comparison by Distribution Channel, 2026-2036
- Figure 107: East Asia Market Attractiveness Analysis by Distribution Channel
- Figure 108: South Asia and Pacific Market Value Share and BPS Analysis by Country, 2026 and 2036
- Figure 109: South Asia and Pacific Market Value Share and BPS Analysis by Enantiomer Form, 2026 and 2036
- Figure 110: South Asia and Pacific Market Y-o-Y Growth Comparison by Enantiomer Form, 2026-2036
- Figure 111: South Asia and Pacific Market Attractiveness Analysis by Enantiomer Form
- Figure 112: South Asia and Pacific Market Value Share and BPS Analysis by Production Method, 2026 and 2036
- Figure 113: South Asia and Pacific Market Y-o-Y Growth Comparison by Production Method, 2026-2036
- Figure 114: South Asia and Pacific Market Attractiveness Analysis by Production Method
- Figure 115: South Asia and Pacific Market Value Share and BPS Analysis by Purity Compendial Grade, 2026 and 2036
- Figure 116: South Asia and Pacific Market Y-o-Y Growth Comparison by Purity Compendial Grade, 2026-2036
- Figure 117: South Asia and Pacific Market Attractiveness Analysis by Purity Compendial Grade
- Figure 118: South Asia and Pacific Market Value Share and BPS Analysis by Commercial Application, 2026 and 2036
- Figure 119: South Asia and Pacific Market Y-o-Y Growth Comparison by Commercial Application, 2026-2036
- Figure 120: South Asia and Pacific Market Attractiveness Analysis by Commercial Application
- Figure 121: South Asia and Pacific Market Value Share and BPS Analysis by Distribution Channel, 2026 and 2036
- Figure 122: South Asia and Pacific Market Y-o-Y Growth Comparison by Distribution Channel, 2026-2036
- Figure 123: South Asia and Pacific Market Attractiveness Analysis by Distribution Channel
- Figure 124: Middle East and Africa Market Value Share and BPS Analysis by Country, 2026 and 2036
- Figure 125: Middle East and Africa Market Value Share and BPS Analysis by Enantiomer Form, 2026 and 2036
- Figure 126: Middle East and Africa Market Y-o-Y Growth Comparison by Enantiomer Form, 2026-2036
- Figure 127: Middle East and Africa Market Attractiveness Analysis by Enantiomer Form
- Figure 128: Middle East and Africa Market Value Share and BPS Analysis by Production Method, 2026 and 2036
- Figure 129: Middle East and Africa Market Y-o-Y Growth Comparison by Production Method, 2026-2036
- Figure 130: Middle East and Africa Market Attractiveness Analysis by Production Method
- Figure 131: Middle East and Africa Market Value Share and BPS Analysis by Purity Compendial Grade, 2026 and 2036
- Figure 132: Middle East and Africa Market Y-o-Y Growth Comparison by Purity Compendial Grade, 2026-2036
- Figure 133: Middle East and Africa Market Attractiveness Analysis by Purity Compendial Grade
- Figure 134: Middle East and Africa Market Value Share and BPS Analysis by Commercial Application, 2026 and 2036
- Figure 135: Middle East and Africa Market Y-o-Y Growth Comparison by Commercial Application, 2026-2036
- Figure 136: Middle East and Africa Market Attractiveness Analysis by Commercial Application
- Figure 137: Middle East and Africa Market Value Share and BPS Analysis by Distribution Channel, 2026 and 2036
- Figure 138: Middle East and Africa Market Y-o-Y Growth Comparison by Distribution Channel, 2026-2036
- Figure 139: Middle East and Africa Market Attractiveness Analysis by Distribution Channel
- Figure 140: Global Market - Tier Structure Analysis
- Figure 141: Global Market - Company Share Analysis
Frequently Asked Questions
How big is the serine market in 2026, and what is forecast for 2036?
FMI estimates that the global serine market size stood at USD 515.5 million in 2025 and reached USD 555.2 million in 2026. Overall industry valuation is on track to hit USD 1,209.8 million by 2036 as biopharma plants standardize chemically defined cell culture media and sterile parenteral infusions.
What is the CAGR for the serine market from 2026 to 2036?
The serine sector is projected to expand at an 8.1% CAGR over the 2026 to 2036 window, adding USD 654.6 million across parenteral nutrition and biologics cell culture applications.
Which enantiomer form segment leads the serine market?
L-Serine High Purity Pure formulations hold 43.0% of enantiomer form demand in 2026 because stereospecific bacterial fermentation eliminates nephrotoxic D-isomer carryover in intravenous infusions.
Which production method segment leads the serine market?
Microbial Direct Fermentation represents 46.7% of the production method category in 2026 as engineered Corynebacterium and Escherichia strains convert glucose directly into L-serine.
Which country has a notable growth outlook during the assessment period?
Brazil leads national expansion projections at a 9.4% CAGR through 2036, driven by domestic sugarcane dextrose fermentation economics and hospital parenteral compounding investments.
Who are the key players in the market?
Sandoz Group AG and Pfizer Inc. with Novartis AG and Roche Holding AG lead commercial demand across biologics. Merck and Company Inc. and Sanofi SA with AstraZeneca plc and Thermo Fisher Scientific Inc. plus Abbott Laboratories and Medtronic plc anchor cell culture and clinical nutrition.
Preview the report firsthand - request a free sample
Get SampleGet the brochure for pricing and purchase details.
Get PDF
