

- Market Size (2026)
- USD 157.7 Mn
- Forecast (2036)
- USD 366.4 Mn
- CAGR (2026 to 2036)
- 8.8%
How big is the Slow-Release Micronutrients Market in 2026?
Demand in the slow-release micronutrients market is anticipated to expand at 8.8% CAGR through 2036. Industry valuation grows from USD 144.9 million in 2025 to USD 157.7 million in 2026 and is anticipated to reach USD 366.4 million by 2036.
Rise in requirement for keeping zinc, boron, iron and manganese available nearer to crop uptake is supporting slow-release micronutrients. Different carrier systems protect micronutrients after application and work alongside nutrient release modifiers to reduce early fixation. USDA NASS reported in 2025 that commercial fertilizers are applied to over 97% of major cereal and grain acres.[1] This base is expected to upkeep recurring consumption, although soil conditions can change release period. FMI estimates market value to rise from USD 144.9 million in 2025 to USD 157.7 million in 2026 and reach USD 366.4 million by 2036, expanding at 8.8% CAGR during 2026 to 2036.
Country demand is developing according to field scale, fertilizer practice and product qualification. Germany is anticipated to expand at 8.4% CAGR during 2026 to 2036, compared with 8.1% for the USA. Germany’s composition records are likely to increase preference for products having local trial evidence, whereas wide U.S. corn and wheat acreage supports dry-blend and starter-placement opportunities. Destatis recorded 11.53 million hectares of German arable land in 2026, while USDA estimated 95.3 million corn acres and 42.7 million wheat acres in June 2026.[13][11] FMI expects uniform flow, storage stability and equipment compatibility to create growth avenues, while variable soil conditions may restrict equal adoption across both countries.
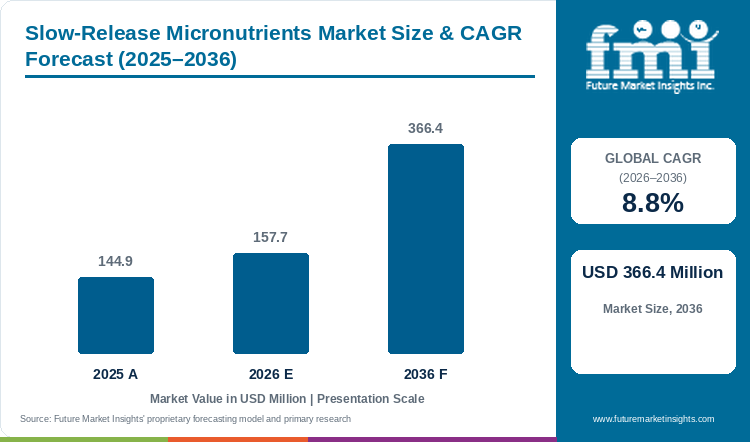
Slow-Release Micronutrients Market Size & CAGR Forecast (2025-2036)
| Year | Basis | Market value (USD million) |
|---|---|---|
| 2025 | Actual | 144.9 |
| 2026 | Estimate | 157.7 |
| 2036 | Forecast | 366.4 |
| CAGR, 2026 to 2036 | 8.8% | |
Source: Future Market Insights proprietary forecasting model and primary research.
Key Takeaways
- Demand for slow-release micronutrients is driven by the need to improve nutrient-use efficiency and align nutrient availability with crop uptake.
- By release mechanism, mineral or bio-based carrier systems are projected to account for 46.2% in 2026, supported by blend compatibility and gradual nutrient availability.
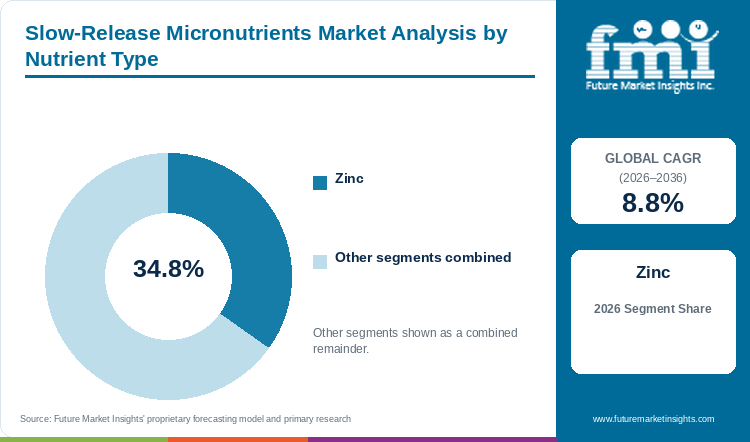
- Based on nutrient type, zinc is estimated to hold 34.8% in 2026, attributable to widespread deficiency management across cereals, oilseeds, and horticulture.
- In 2026, cereals and grains are expected to lead crop type with 40.8% share, driven by large planted areas and repeatable application windows.
- By application method, soil incorporation and dry blending are forecast to represent 48.6% in 2026, influenced by compatibility with established basal programs.
- Germany is projected at 8.4% CAGR through 2036, while the USA is estimated at 8.1% as local evidence and field scale shape adoption.
Analyst Perspective
“I see increasing adoption where slow-release micronutrients remain available during the required crop stage and works with existing fertilizer practices. Local field trials and stable blend performance will create higher opportunities than broad claims which do not explain crop response.”
- Nikhil Kaitwade, Principal Consultant, Future Market Insights.
How is the slow-release micronutrients market segmented?
The market is segmented by nutrient type, release mechanism, crop type, application method, sales channel, and region. In 2026, zinc is estimated at 34.8%, mineral or bio-based carriers at 46.2%, cereals and grains at 40.8%, soil incorporation and dry blending at 48.6%, and agri-input distributors at 40.6%.
The slow-release micronutrients market is segmented by nutrient type, release mechanism, crop type, application method, sales channel, and region.
By nutrient type: zinc, boron, iron, manganese, copper, molybdenum, and multi-micronutrient blends.
By release mechanism: mineral or bio-based carrier, polymer-coated or encapsulated, chemically stabilised or chelated, and other controlled-delivery systems.
By crop type: cereals and grains, fruits and vegetables, oilseeds and pulses, turf and ornamentals, and other crops.
By application method: soil incorporation or dry blending, seed-row or starter placement, foliar application, fertigation, and other methods.
By sales channel: agri-input distributors, cooperatives, direct-to-farm, agri-retail chains, and digital channels.
By region: North America, Latin America, Western Europe, Eastern Europe, East Asia, South Asia and Pacific, and Middle East and Africa.
Why does zinc lead nutrient type demand?
Based on nutrient type, zinc is estimated to hold 34.8% in 2026, attributable to broad deficiency management across major crops.
| Nutrient type | Share (2026) |
|---|---|
| Zinc | 34.8% |
| Other segments combined | 65.2%* |
| Total | 100.0% |
| Metric | Value |
|---|---|
| Global CAGR (2026-2036) | 8.8% |
| Leading segment | Zinc |
Increasing zinc deficiency across alkaline, calcareous and low-organic-matter soils is supporting demand for slow-release zinc products. The Korean Soil Information System states that zinc solubility becomes low when soil pH exceeds 8.0, due to which crops may face deficiency even when zinc is present in soil.[4] Slow-release formats are used for keeping zinc available for a longer period and reducing early fixation after application, complementing specialized citrate mineral blends in alkaline soils. Soil testing and crop-based application rates will continue to influence product selection.
- Zinc is estimated to hold 34.8% of nutrient-type demand in 2026 because deficiency risk spans multiple crop systems.
- Longer availability is gaining importance where soluble zinc becomes fixed soon after its application in alkaline soils.
Why do mineral or bio-based carriers lead release mechanism demand?
By release mechanism, mineral or bio-based carriers are projected to account for 46.2% in 2026, supported by blend compatibility and gradual nutrient availability.
An FMI analyst notes that mineral and bio-based carriers help in holding micronutrients and releasing them over a longer period near the crop root zone. These carriers can also be mixed with granular fertilizers and integrated into commercial programs alongside organic fertilizer systems. Soileos has reported more than 300 field trials for its cellulose-based slow-release micronutrients across crops and field conditions.[3] However, the release period can change with soil moisture, pH and microbial activity, which makes local testing important for wider adoption.
- Mineral or bio-based carrier systems are projected to hold 46.2% share in 2026 because handling and nutrient availability are evaluated together.
- Gradual availability and compatibility with granular fertilizers are supporting use across basal and root-zone application programs.
How do cereals and grains support crop-type use?
In 2026, cereals and grains are expected to lead crop type with 40.8% share, driven by large planted areas and repeatable field programs.
Large cereal areas are increasing the application scope for granular micronutrients used with basal fertilizers and starter programs. Destatis reported that German agricultural farms harvested 45.0 million tons of grain across commercial cereal acreage in 2025.[5] This acreage allows suppliers to provide zinc, boron and multi-micronutrient products through established phosphate fertilizer blending channels. However, differences in soil zones and seasonal moisture can change nutrient release, and therefore products will require crop and location based evidence.
- Cereals and grains are expected to represent 40.8% of crop-type demand in 2026 because established programs cover extensive acreage.
- Granular formats are gaining preference because the same blend can cover wide cereal acreage through established field equipment.
Why does soil incorporation and dry blending lead application demand?
By application method, soil incorporation and dry blending are forecast to represent 48.6% in 2026, influenced by existing basal fertiliser workflows.
As per FMI, soil incorporation and dry blending places slow-release micronutrients near the developing root and reduces the requirement for a separate foliar application. England reported that 82% of holdings spread fertiliser in 2026, while farmers alone completed the activity on 55% of holdings.[6] This existing equipment base is expected to support products which flow evenly, remain stable during storage and do not separate inside commercial specialty fertilizers blends. Compatibility with common spreaders and basal fertilizer programs will further support the segment.
- Soil incorporation and dry blending are forecast at 48.6% in 2026 because growers can use established application equipment.
- Uniform flow, storage stability and lower risk of segregation are expected to support use through existing spreader systems.
Why do agri-input distributors remain important?
Agri-input distributors are set to lead sales channels with 40.6% share in 2026, underpinned by local agronomy and product-selection support.
Slow-release micronutrients require proper selection according to soil test, crop stage, placement method and fertilizer blend. Therefore, agri-input distributors are important for connecting product availability with local agronomy and application support. In April 2026, Rovensa Next expanded an evidence platform containing more than 10,000 internal articles and findings from over 4,000 trials.[7] Agri-input distributors can connect product labels with farm equipment, compatible agricultural surfactants, and actual soil conditions, which increases their importance in this market. Owing to their local presence and advisory role, agri-input distributors are projected to hold 40.6% of sales channel demand in 2026.
- Agri-input distributors are projected to hold 40.6% of sales in 2026 because access and agronomic interpretation often arrive together.
- Crop-based guidance and local availability are increasing distributor importance where product selection changes with soil and placement method.
What are the drivers, restraints, and opportunities in the slow-release micronutrients market?
The central driver is longer nutrient availability, the main restraint is variable field release, and the strongest opportunity is soil-test-led controlled delivery.
- Driver: Growers adopt slow-release micronutrients when the product keeps a limiting element available closer to crop demand.
- Restraint: Soil chemistry, moisture, temperature, carrier breakdown, and storage conditions can change release performance.
- Opportunity: Soil testing and precision placement can match a controlled-delivery product with a documented nutrient constraint.
Longer Nutrient Availability Supports Adoption
Micronutrients which dissolve immediately may become fixed in soil before the crop reaches its main uptake period. Slow-release products are therefore gaining demand as they keep the required nutrient available for a longer duration. England's AHDB Nutrient Management Guide RB209, updated in 2026, emphasizes that targeted micronutrient availability during early vegetative stages improves nutrient use efficiency across arable crops.[8] Increasing focus on nutrient availability and reduction of avoidable losses is expected to support market growth, especially when delivered in conjunction with humic and fulvic acid based biostimulants to enhance root absorption. Repeat use will depend on crop-level results.
Variable Release Raises Qualification Risk
Variation in soil chemistry and climate is one of the major factors restraining adoption of slow-release micronutrients. Alkaline soil, low moisture, storage temperature and competing ions can change the release period and crop availability, prompting interest in companion mineral solubilizer blends to overcome uptake barriers. A 2026 agronomic study in Frontiers in Plant Science found that release rates from coated and bio-based carriers fluctuated significantly across varying soil moisture, pH, and temperature conditions.[9] This wide range of environmental factors shows why one release pattern cannot be applied across every field. Therefore, suppliers need local data which connects carrier type, nutrient, dose and placement with measured soil conditions.
Precision Placement Creates New Routes
Increasing use of soil diagnosis and defined application zones is creating growth opportunities for slow-release micronutrient products. Japan’s 2026 MIDORI cooperation update describes satellite-based field plotting and digital soil diagnosis for balanced fertilisation and lower fertilizer use.[10] These systems can identify fields where zinc, boron, iron or manganese availability is restricted and a controlled-delivery product or struvite-based slow-release phosphorus fertilizer program can be applied. In addition to this, defined placement and crop-based rates can reduce unnecessary application across unaffected areas. Products supported by soil condition, placement method and expected crop response are anticipated to witness higher adoption during the forecast period.
Which country CAGRs are profiled in the slow-release micronutrients market?
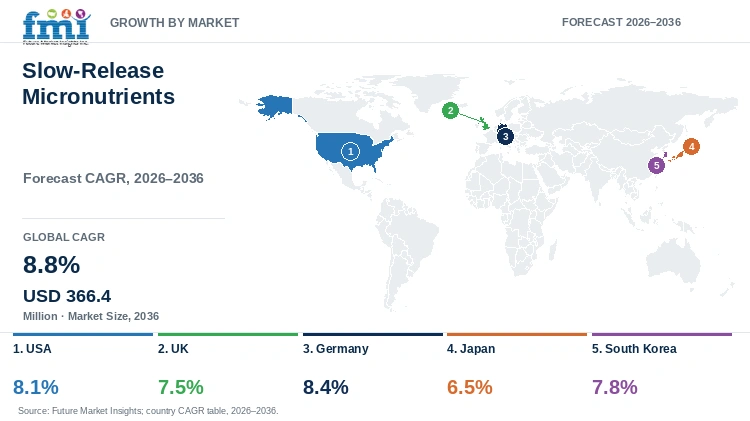
| Country | 2026 to 2036 CAGR |
|---|---|
| USA | 8.1% |
| UK | 7.5% |
| Germany | 8.4% |
| Japan | 6.5% |
| South Korea | 7.8% |
How do country-level CAGRs compare in the slow-release micronutrients market?
As per the analysis from FMI, country growth rates differ through 2036 because regulatory standards, arable land availability, and fertilizer-application infrastructure are not uniform across markets. Germany and the USA lead projected growth above 8.0 per cent, while South Korea, the UK, and Japan follow distinct nutrient-management structures.
- USA demand benefits from extensive cereal and corn acreage alongside established fertilizer-blending and bulk-distribution infrastructure.
- The UK combines high spreader utilization on commercial holdings with growing farm-level focus on targeted soil nutrient timing.
- Germany relies on extensive arable crop production, planned nutrient management, and strict documentation for registered fertilizing products.
- Japan emphasizes official fertilizer registration dossiers, controlled product specifications, and precision nutrient planning across diverse cultivation zones.
- South Korea benefits from comprehensive parcel-level soil mapping and digital nutrient-recommendation systems across commercial farming districts.
Full report country CAGRs cover: North America; Latin America; Western Europe; Eastern Europe; East Asia; South Asia and Pacific; Middle East and Africa.
Country-wise Analysis
- Slow-release micronutrient sales in the USA are forecast to expand at 8.1% CAGR through 2036, supported by large cereal acreage and established fertilizer distribution. USDA estimated 95.3 million planted corn acres and 42.7 million wheat acres during June 2026.[11] This provides a wide application base for zinc, boron and multi-micronutrient products used through dry blends, starter placement, and commercial agronomic biofortification initiatives. However, soil and water conditions vary across states, which can change nutrient release and crop response. Increasing preference for products compatible with common farm equipment is expected to support adoption. Regional trials, state-ready labels and storage stability will remain important for repeat use.
- The UK slow-release micronutrients market is anticipated to advance at 7.5% CAGR through 2036, owing to established fertilizer-spreading practices. In July 2026, Defra published the 2025 British Survey of Fertiliser Practice, recording systematic nutrient application rates and timing across 3.0 million hectares of UK arable and cereal crops.[12] This equipment pattern is supporting products which can be used through existing spreaders without additional handling. Dry granules require uniform flow and blending, whereas foliar products require proper mixing instructions. Increasing focus on nutrient value from each field pass is likely to support market growth. Local trials showing better nutrient timing or retention will further increase adoption across farms.
- Germany is projected to grow at 8.4% CAGR through 2036, attributable to extensive arable production and planned nutrient application. Destatis recorded 11.53 million hectares of arable land in 2026, including 5.94 million hectares under cereals for grain.[13] This agricultural area supports granular zinc, boron and multi-micronutrient products applied through basal and starter programs. Furthermore, buyers require accurate composition, use instructions and evidence according to the crop and soil condition. Products showing a stable release period under local conditions are expected to gain higher preference. Documented nutrient requirement and repeatable field performance will continue to support adoption in Germany.
- Adoption of slow-release micronutrients in Japan is estimated to expand at 6.5% CAGR through 2036, supported by registered fertilizer inputs and precision nutrient planning. MAFF maintained a searchable fertilizer registration system updated in October 2026, covering composition, registration class, producer and validity period.[14] FMI data suggests that this structure helps buyers connect a micronutrient product with its permitted use rather than relying on a broad marketing claim. Crop-specific recommendations are also important because field size, crop type and application practices differ across production areas. Granular, fertigation and horticultural products are expected to gain demand where trial records explain release timing. Local labels and adviser support will remain important for market entry.
- The South Korean slow-release micronutrients market is projected to record 7.8% CAGR through 2036, supported by plot-level soil information and crop recommendations. The official soil system uses detailed 1:5,000 maps and analyses pH, organic matter, phosphorus, calcium, magnesium, potassium, conductivity, silica and lime demand.[15] This information provides growers a base for comparing slow-release products with standard soluble nutrients. Soil-applied zinc, iron and manganese can gain demand where high pH or fixation reduces nutrient availability. However, products must show additional crop value beyond a correctly applied conventional rate. Regional demonstrations will influence whether trial use develops into regular purchasing.
Who are the notable companies in the slow-release micronutrients market?
Representative participants include Nutrien through Loveland Products, Rovensa Next through Oro Agri, Lucent Bio through Soileos, Wilbur-Ellis, Croda, Clariant, Evonik, Syensqo, and Stepan Company.
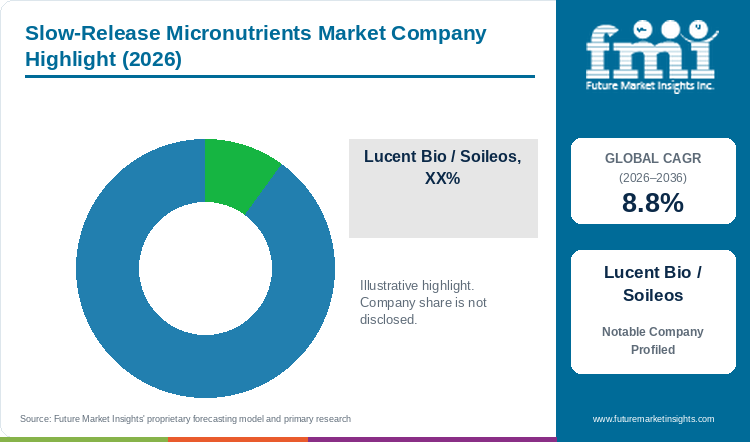
The slow-release micronutrients market includes product manufacturers, crop-nutrition companies, fertilizer blenders and formulation technology suppliers. In the FMI report, competitive position is connected with carrier depth, blend compatibility, and field validation rather than general chemical manufacturing capacity. Soileos provides slow-release zinc, boron, copper, iron and manganese products, while Loveland Products and Wilbur-Ellis connect nutrient products with agronomy and distribution channels. Croda, Clariant, Evonik, Syensqo and Stepan Company provide formulation technologies where wetting, dispersion, carrying or retention is required. Public information does not establish one company holding a verified global market share leadership.
- Direct product platforms: Soileos, Loveland Products, Wilbur-Ellis, and selected specialist micronutrient manufacturers.
- Channel and agronomy platforms: Nutrien Ag Solutions, Rovensa Next, and Wilbur-Ellis.
- Formulation and carrier specialists: Croda, Clariant, Evonik, Syensqo, and Stepan Company, included only where evidence connects their technology to nutrient delivery.
Competitive Benchmarking: Slow-Release Micronutrients Market
| Company | Carrier depth | Application fit | Current activity | Reach |
|---|---|---|---|---|
| Lucent Bio / Soileos | High | High | High | Medium |
| Nutrien / Loveland Products | High | High | High | High |
| Rovensa Next | Medium | High | High | High |
| Wilbur-Ellis | Medium | High | High | Medium |
| Croda | Medium | High | High | High |
| Clariant | Medium | High | High | High |
| Evonik | Medium | High | High | High |
| Syensqo | Medium | High | High | High |
| Stepan Company | Medium | Medium | High | Medium |
High represents broad public evidence across the stated capability, Medium represents narrower evidence, and Low represents limited documented breadth. These ratings describe public company capability and do not indicate product quality, revenue share or company ranking.
Key Developments in the Slow-Release Micronutrients Market
- April 2026: Rovensa Next expanded global distributor training and an AI knowledge platform containing findings from over 4,000 trials.[16]
- March 2026: Syensqo launched Geropon D2566 for crystal-growth control and stability in complex suspension concentrates.[17]
- March 2025: Clariant introduced Synergen Soil and Synergen Guard 100 for water movement, coverage, and rainfastness.[18]
- March 2025: Evonik presented BREAK-THRU BP and BREAK-THRU SF 420 for carrying, adhesion, and rain retention in agricultural formulations.[19]
Key Players in the Slow-Release Micronutrients Market
Direct slow-release micronutrient manufacturers
- Lucent Bio (Soileos)
- Loveland Products
- Wilbur-Ellis
Crop nutrition and agronomy distribution platforms
- Nutrien Ag Solutions
- Rovensa Next
Formulation, dispersion, and carrier specialists
- Croda
- Clariant
- Evonik
- Syensqo
- Stepan Company
Slow-Release Micronutrients Market - Report Scope
| Coverage field | Report scope |
|---|---|
| Market breakdown | Nutrient type, release mechanism, crop type, application method, sales channel, and region. |
| Quantitative units | USD million. |
| Market definition | Supplier revenue from purpose-specific micronutrient fertilisers designed to delay release or extend nutrient availability. |
| Exclusions | Generic soluble micronutrients, standalone adjuvants, bulk NPK fertilisers, and technologies without a defined micronutrient-delivery use. |
| Regions covered | North America, Latin America, Western Europe, Eastern Europe, East Asia, South Asia and Pacific, Middle East and Africa. |
| Countries profiled | USA, UK, Germany, Japan, and South Korea. |
| Forecast period | 2026 to 2036. |
| Key companies profiled | Lucent Bio (Soileos), Nutrien (Loveland Products), Rovensa Next, Wilbur-Ellis, Croda, Clariant, Evonik, Syensqo, and Stepan Company. |
Slow-Release Micronutrients Market - Research Methodology
| Method | Approach |
|---|---|
| Primary Research | Analysts gathered input from manufacturers, service providers, technology developers, distributors, end users, procurement teams, and subject-matter experts. Interviews examined purchasing decisions, product evaluation, adoption barriers, approval requirements, pricing, and technical support. |
| Desk Research | Desk research covered government statistics, regulatory publications, trade data, industry associations, technical literature, standards, company filings, product information, and official corporate announcements. Sources were checked for date, geography, and direct market relevance. |
| Market Sizing and Forecasting | The model combined the baseline value with historical performance, segment structure, pricing and volume indicators, adoption levels, company participation, and country demand conditions. Forecast assumptions included regulation, technology use, purchasing cycles, and supply availability. |
| Data Validation | Estimates were checked against public data, company activity, trade patterns, and primary-research findings. Adjacent categories, unsupported claims, overlapping revenue, and activities outside the defined market were excluded. |
Slow-Release Micronutrients Market by Segments
Slow-Release Micronutrients Market segmented by Nutrient Type:
- Zinc
- Boron
- Iron
- Manganese
- Copper
- Molybdenum
- Multi-micronutrient blends
Slow-Release Micronutrients Market segmented by Release Mechanism:
- Mineral or bio-based carrier
- Polymer-coated or encapsulated
- Chemically stabilised or chelated
- Other controlled-delivery systems
Slow-Release Micronutrients Market segmented by Crop Type:
- Cereals and grains
- Fruits and vegetables
- Oilseeds and pulses
- Turf and ornamentals
- Others
Slow-Release Micronutrients Market segmented by Application Method:
- Soil incorporation or dry blending
- Seed-row or starter placement
- Foliar application
- Fertigation
- Other methods
Slow-Release Micronutrients Market segmented by Sales Channel:
- Agri-input distributors
- Cooperatives
- Direct-to-farm
- Agri-retail chains
- Digital channels
Slow-Release Micronutrients Market by Region
- North America
- United States
- Canada
- Mexico
- Latin America
- Brazil
- Argentina
- Chile
- Rest of Latin America
- Western Europe
- Germany
- United Kingdom
- France
- Italy
- Spain
- BENELUX
- Nordics
- Rest of Western Europe
- Eastern Europe
- Poland
- Romania
- Hungary
- Rest of Eastern Europe
- East Asia
- China
- Japan
- South Korea
- South Asia and Pacific
- India
- ASEAN
- Australia and New Zealand
- Rest of South Asia and Pacific
- Middle East and Africa
- GCC Countries
- South Africa
- Türkiye
- Rest of Middle East and Africa
Research Sources and Bibliography
- [1] U.S. Department of Agriculture, National Agricultural Statistics Service. (2025). Commercial fertilizer and chemical use in field crops.
- [2] Rural Development Administration, Republic of Korea. (2025, September 2). 2026 budget plan for smart agriculture and crop protection.
- [3] Soileos. (2026). Slow-release micronutrient solutions and field-trial evidence.
- [4] Rural Development Administration, Republic of Korea. (2026). Korean Soil Information System: Soil chemical properties.
- [5] German Federal Statistical Office. (2025, November). Special survey on crop yields and grain harvest volume.
- [6] Department for Environment, Food & Rural Affairs. (2026, June 11). Fertiliser, manure and slurry spreaders.
- [7] Rovensa Next. (2026, April 15). Global training and AI support for distribution partners and growers.
- [8] Agriculture and Horticulture Development Board. (2026). Nutrient Management Guide (RB209): Principles of crop nutrient management and trace element availability.
- [9] Frontiers in Plant Science. (2026, January). Release kinetics and environmental stability of engineered slow-release micronutrient formulations.
- [10] Ministry of Agriculture, Forestry and Fisheries, Japan. (2026, August). ASEAN-Japan MIDORI Cooperation Plan.
- [11] U.S. Department of Agriculture, National Agricultural Statistics Service. (2026, June 30). Corn planted acreage down 3% from 2025, soybean acreage up 5% from last year.
- [12] Department for Environment, Food & Rural Affairs. (2026, July 16). The British Survey of Fertiliser Practice 2025: Annual report on nutrient application.
- [13] German Federal Statistical Office. (2026, July 31). Arable land after the main groups and crops.
- [14] Ministry of Agriculture, Forestry and Fisheries, Japan. (2026). Fertiliser registration search.
- [15] Rural Development Administration, Republic of Korea. (2026). Korean Soil Information System: Data and detailed soil maps.
- [16] Rovensa Next. (2026, April 15). Distribution partner training and agronomic trial platform expansion.
- [17] Syensqo. (2026, March 10). Geropon D2566 for complex suspension concentrate formulations.
- [18] Clariant. (2025, March 13). Novel solutions for enhancing crop health and biological formulations at CAC 2025.
- [19] Evonik. (2025, March 19). Sustainable solutions and innovations for the agricultural sector at ISAA 2025.
- [20] Wilbur-Ellis. (2025, February 26). NUTRIO N-TUNE launch and field-trial results.
- [21] Stepan Company. (2025, June 10). Agricultural solutions showcased at ICSCE 2025.
- [22] Nutrien. (2026, February 18). Full-year 2025 results and 2026 guidance.
This bibliography is provided for reader reference. The full report contains the complete reference list and detailed citations.
This Report Answers
- What is the Slow-Release Micronutrients Market worth during 2026?
- What value is the Slow-Release Micronutrients Market projected to reach by 2036?
- Which release mechanism holds a notable Slow-Release Micronutrients Market share?
- Which nutrient type holds a notable Slow-Release Micronutrients Market share?
- Which countries have notable Slow-Release Micronutrients Market growth?
- Which companies are notable in the Slow-Release Micronutrients Market today?
Frequently Asked Questions
How large is the Slow-Release Micronutrients Market expected to be in 2026?
Future Market Insights estimates that the slow-release micronutrients market will reach USD 157.7 million in 2026. The market is projected to expand further and reach USD 366.4 million by 2036.
What CAGR is forecast for the Slow-Release Micronutrients Market through 2036?
As per FMI, the slow-release micronutrients market is projected to grow at an 8.8% CAGR from 2026 to 2036. Growth is supported by increasing adoption of controlled-delivery systems and precision nutrient placement across field crops.
Which release mechanism holds a notable slow-release micronutrients demand share in 2026?
Future Market Insights projects mineral or bio-based carriers to hold 46.2% of release mechanism demand in 2026. The segment benefits from blend compatibility with bulk granular fertilizers and gradual nutrient availability.
Which nutrient category holds a notable slow-release micronutrients share in 2026?
FMI finds that zinc products will hold 34.8% of nutrient type demand in 2026. Demand is supported by widespread deficiency management across cereals, oilseeds, and horticultural crops.
Which country has a notable slow-release micronutrients expansion outlook during the forecast period?
Future Market Insights predicts Germany to expand at an 8.4% CAGR during the 2026 to 2036 assessment period. Growth is supported by extensive cereal acreage, planned nutrient management, and strict fertilizing product standards.
Which companies are active in the Slow-Release Micronutrients Market during 2026?
As per FMI analysis, notable companies include Nutrien (Loveland Products), Rovensa Next (Oro Agri), Lucent Bio (Soileos), Wilbur-Ellis, Croda, Clariant, Evonik, Syensqo, and Stepan Company. These companies are focusing on carrier performance, formulation stability, agronomy access, and field trial validation.
Preview the report firsthand - request a free sample
Get SampleGet the brochure for pricing and purchase details.
Get PDFTable of Content
- Key Takeaways
- Market Size and CAGR
- Top Growth Driver
- Fastest Growing Segment
- Leading Region
- Key Companies
- Emerging Opportunities
- Executive Summary
- Global Market Outlook
- Demand-side Trends
- Supply-side Trends
- Technology Roadmap Analysis
- Analysis and Recommendations
- Analyst Perspective (What is happening? Why now? What should investors know?)
- Key Questions Answered
- How large is the market?
- What is the CAGR?
- What are key trends?
- Which region dominates?
- Who are the leaders?
- Market Overview
- Market Coverage / Taxonomy
- Market Definition / Scope / Limitations
- Research Methodology
- Chapter Orientation
- Analytical Lens and Working Hypotheses
- Market Structure, Signals, and Trend Drivers
- Benchmarking and Cross-market Comparability
- Market Sizing, Forecasting, and Opportunity Mapping
- Research Design and Evidence Framework
- Desk Research Programme (Secondary Evidence)
- Expert Input and Fieldwork (Primary Evidence)
- Tooling, Models, and Reference Databases
- Data Engineering and Model Build
- Quality Assurance and Audit Trail
- Market Background
- Market Dynamics (Drivers, Restraints, Opportunity, Trends)
- Scenario Forecast (Optimistic, Likely, Conservative)
- Impact Analysis
- AI Impact
- Sustainability Impact
- Regulatory Impact
- Technology Impact
- Consumer / Buyer Analysis
- Purchase Drivers
- Adoption Barriers
- Buyer Journey
- Opportunity Map Analysis
- Product Life Cycle Analysis
- Supply Chain Analysis
- Investment Feasibility Matrix
- Value Chain Analysis
- PESTLE and Porter's Analysis
- Regulatory Landscape
- Regional Parent Market Outlook
- Production and Consumption Statistics
- Import and Export Statistics
- Global Market Analysis and Forecast, 2021 to 2036
- Historical Market Size Value (USD Million) Analysis, 2021 to 2025
- Current and Future Market Size Value (USD Million) Projections, 2026 to 2036
- Y-o-Y Growth Trend Analysis
- Absolute $ Opportunity Analysis
- Global Market Pricing Analysis, 2021 to 2036
- Global Market Analysis and Forecast, By Nutrient Type, 2021 to 2036
- Introduction / Key Findings
- Historical Market Size Value (USD Million) Analysis By Nutrient Type, 2021 to 2025
- Current and Future Market Size Value (USD Million) Analysis and Forecast By Nutrient Type, 2026 to 2036
- Zinc
- Boron
- Iron
- Manganese
- Copper
- Molybdenum
- Multi-micronutrient blends
- Y-o-Y Growth Trend Analysis By Nutrient Type, 2021 to 2025
- Absolute $ Opportunity Analysis By Nutrient Type, 2026 to 2036
- Global Market Analysis and Forecast, By Release Mechanism, 2021 to 2036
- Introduction / Key Findings
- Historical Market Size Value (USD Million) Analysis By Release Mechanism, 2021 to 2025
- Current and Future Market Size Value (USD Million) Analysis and Forecast By Release Mechanism, 2026 to 2036
- Mineral or bio-based carrier
- Polymer-coated or encapsulated
- Chemically stabilised or chelated
- Other controlled-delivery systems
- Y-o-Y Growth Trend Analysis By Release Mechanism, 2021 to 2025
- Absolute $ Opportunity Analysis By Release Mechanism, 2026 to 2036
- Global Market Analysis and Forecast, By Crop Type, 2021 to 2036
- Introduction / Key Findings
- Historical Market Size Value (USD Million) Analysis By Crop Type, 2021 to 2025
- Current and Future Market Size Value (USD Million) Analysis and Forecast By Crop Type, 2026 to 2036
- Cereals and grains
- Fruits and vegetables
- Oilseeds and pulses
- Turf and ornamentals
- Others
- Y-o-Y Growth Trend Analysis By Crop Type, 2021 to 2025
- Absolute $ Opportunity Analysis By Crop Type, 2026 to 2036
- Global Market Analysis and Forecast, By Application Method, 2021 to 2036
- Introduction / Key Findings
- Historical Market Size Value (USD Million) Analysis By Application Method, 2021 to 2025
- Current and Future Market Size Value (USD Million) Analysis and Forecast By Application Method, 2026 to 2036
- Soil incorporation or dry blending
- Seed-row or starter placement
- Foliar application
- Fertigation
- Other methods
- Y-o-Y Growth Trend Analysis By Application Method, 2021 to 2025
- Absolute $ Opportunity Analysis By Application Method, 2026 to 2036
- Global Market Analysis and Forecast, By Sales Channel, 2021 to 2036
- Introduction / Key Findings
- Historical Market Size Value (USD Million) Analysis By Sales Channel, 2021 to 2025
- Current and Future Market Size Value (USD Million) Analysis and Forecast By Sales Channel, 2026 to 2036
- Agri-input distributors
- Cooperatives
- Direct-to-farm
- Agri-retail chains
- Digital channels
- Y-o-Y Growth Trend Analysis By Sales Channel, 2021 to 2025
- Absolute $ Opportunity Analysis By Sales Channel, 2026 to 2036
- Global Market Analysis and Forecast, By Region, 2021 to 2036
- Introduction
- Historical Market Size Value (USD Million) Analysis By Region, 2021 to 2025
- Current Market Size Value (USD Million) Analysis and Forecast By Region, 2026 to 2036
- North America
- Latin America
- Western Europe
- Eastern Europe
- East Asia
- South Asia and Pacific
- Middle East and Africa
- Market Attractiveness Analysis By Region
- North America Market Analysis and Forecast, By Country, 2021 to 2036
- Historical Market Size Value (USD Million) Trend Analysis By Market Taxonomy, 2021 to 2025
- Market Size Value (USD Million) Forecast By Market Taxonomy, 2026 to 2036
- By Country
- United States
- Canada
- Mexico
- By Nutrient Type
- By Release Mechanism
- By Crop Type
- By Application Method
- By Sales Channel
- By Country
- Market Attractiveness Analysis
- By Country
- By Nutrient Type
- By Release Mechanism
- By Crop Type
- By Application Method
- By Sales Channel
- Key Takeaways
- Latin America Market Analysis and Forecast, By Country
- Historical Market Size Value (USD Million) Trend Analysis By Market Taxonomy, 2021 to 2025
- Market Size Value (USD Million) Forecast By Market Taxonomy, 2026 to 2036
- By Country
- Brazil
- Argentina
- Chile
- Rest of Latin America
- By Nutrient Type
- By Release Mechanism
- By Crop Type
- By Application Method
- By Sales Channel
- By Country
- Market Attractiveness Analysis
- By Country
- By Nutrient Type
- By Release Mechanism
- By Crop Type
- By Application Method
- By Sales Channel
- Key Takeaways
- Western Europe Market Analysis and Forecast, By Country
- Historical Market Size Value (USD Million) Trend Analysis By Market Taxonomy, 2021 to 2025
- Market Size Value (USD Million) Forecast By Market Taxonomy, 2026 to 2036
- By Country
- Germany
- United Kingdom
- France
- Italy
- Spain
- BENELUX
- Nordics
- Rest of Western Europe
- By Nutrient Type
- By Release Mechanism
- By Crop Type
- By Application Method
- By Sales Channel
- By Country
- Market Attractiveness Analysis
- By Country
- By Nutrient Type
- By Release Mechanism
- By Crop Type
- By Application Method
- By Sales Channel
- Key Takeaways
- Eastern Europe Market Analysis and Forecast, By Country
- Historical Market Size Value (USD Million) Trend Analysis By Market Taxonomy, 2021 to 2025
- Market Size Value (USD Million) Forecast By Market Taxonomy, 2026 to 2036
- By Country
- Poland
- Romania
- Hungary
- Rest of Eastern Europe
- By Nutrient Type
- By Release Mechanism
- By Crop Type
- By Application Method
- By Sales Channel
- By Country
- Market Attractiveness Analysis
- By Country
- By Nutrient Type
- By Release Mechanism
- By Crop Type
- By Application Method
- By Sales Channel
- Key Takeaways
- East Asia Market Analysis and Forecast, By Country
- Historical Market Size Value (USD Million) Trend Analysis By Market Taxonomy, 2021 to 2025
- Market Size Value (USD Million) Forecast By Market Taxonomy, 2026 to 2036
- By Country
- China
- Japan
- South Korea
- By Nutrient Type
- By Release Mechanism
- By Crop Type
- By Application Method
- By Sales Channel
- By Country
- Market Attractiveness Analysis
- By Country
- By Nutrient Type
- By Release Mechanism
- By Crop Type
- By Application Method
- By Sales Channel
- Key Takeaways
- South Asia and Pacific Market Analysis and Forecast, By Country
- Historical Market Size Value (USD Million) Trend Analysis By Market Taxonomy, 2021 to 2025
- Market Size Value (USD Million) Forecast By Market Taxonomy, 2026 to 2036
- By Country
- India
- ASEAN
- Australia and New Zealand
- Rest of South Asia and Pacific
- By Nutrient Type
- By Release Mechanism
- By Crop Type
- By Application Method
- By Sales Channel
- By Country
- Market Attractiveness Analysis
- By Country
- By Nutrient Type
- By Release Mechanism
- By Crop Type
- By Application Method
- By Sales Channel
- Key Takeaways
- Middle East and Africa Market Analysis and Forecast, By Country
- Historical Market Size Value (USD Million) Trend Analysis By Market Taxonomy, 2021 to 2025
- Market Size Value (USD Million) Forecast By Market Taxonomy, 2026 to 2036
- By Country
- GCC Countries
- South Africa
- Türkiye
- Rest of Middle East and Africa
- By Nutrient Type
- By Release Mechanism
- By Crop Type
- By Application Method
- By Sales Channel
- By Country
- Market Attractiveness Analysis
- By Country
- By Nutrient Type
- By Release Mechanism
- By Crop Type
- By Application Method
- By Sales Channel
- Key Takeaways
- Key Countries Market Analysis
- United States
- Pricing Analysis
- Market Share Analysis, 2025
- By Nutrient Type
- By Release Mechanism
- By Crop Type
- By Application Method
- By Sales Channel
- Canada
- Pricing Analysis
- Market Share Analysis, 2025
- By Nutrient Type
- By Release Mechanism
- By Crop Type
- By Application Method
- By Sales Channel
- Mexico
- Pricing Analysis
- Market Share Analysis, 2025
- By Nutrient Type
- By Release Mechanism
- By Crop Type
- By Application Method
- By Sales Channel
- Brazil
- Pricing Analysis
- Market Share Analysis, 2025
- By Nutrient Type
- By Release Mechanism
- By Crop Type
- By Application Method
- By Sales Channel
- Chile
- Pricing Analysis
- Market Share Analysis, 2025
- By Nutrient Type
- By Release Mechanism
- By Crop Type
- By Application Method
- By Sales Channel
- Germany
- Pricing Analysis
- Market Share Analysis, 2025
- By Nutrient Type
- By Release Mechanism
- By Crop Type
- By Application Method
- By Sales Channel
- United Kingdom
- Pricing Analysis
- Market Share Analysis, 2025
- By Nutrient Type
- By Release Mechanism
- By Crop Type
- By Application Method
- By Sales Channel
- Italy
- Pricing Analysis
- Market Share Analysis, 2025
- By Nutrient Type
- By Release Mechanism
- By Crop Type
- By Application Method
- By Sales Channel
- Spain
- Pricing Analysis
- Market Share Analysis, 2025
- By Nutrient Type
- By Release Mechanism
- By Crop Type
- By Application Method
- By Sales Channel
- France
- Pricing Analysis
- Market Share Analysis, 2025
- By Nutrient Type
- By Release Mechanism
- By Crop Type
- By Application Method
- By Sales Channel
- India
- Pricing Analysis
- Market Share Analysis, 2025
- By Nutrient Type
- By Release Mechanism
- By Crop Type
- By Application Method
- By Sales Channel
- ASEAN
- Pricing Analysis
- Market Share Analysis, 2025
- By Nutrient Type
- By Release Mechanism
- By Crop Type
- By Application Method
- By Sales Channel
- Australia and New Zealand
- Pricing Analysis
- Market Share Analysis, 2025
- By Nutrient Type
- By Release Mechanism
- By Crop Type
- By Application Method
- By Sales Channel
- China
- Pricing Analysis
- Market Share Analysis, 2025
- By Nutrient Type
- By Release Mechanism
- By Crop Type
- By Application Method
- By Sales Channel
- Japan
- Pricing Analysis
- Market Share Analysis, 2025
- By Nutrient Type
- By Release Mechanism
- By Crop Type
- By Application Method
- By Sales Channel
- South Korea
- Pricing Analysis
- Market Share Analysis, 2025
- By Nutrient Type
- By Release Mechanism
- By Crop Type
- By Application Method
- By Sales Channel
- Poland
- Pricing Analysis
- Market Share Analysis, 2025
- By Nutrient Type
- By Release Mechanism
- By Crop Type
- By Application Method
- By Sales Channel
- Hungary
- Pricing Analysis
- Market Share Analysis, 2025
- By Nutrient Type
- By Release Mechanism
- By Crop Type
- By Application Method
- By Sales Channel
- Türkiye
- Pricing Analysis
- Market Share Analysis, 2025
- By Nutrient Type
- By Release Mechanism
- By Crop Type
- By Application Method
- By Sales Channel
- South Africa
- Pricing Analysis
- Market Share Analysis, 2025
- By Nutrient Type
- By Release Mechanism
- By Crop Type
- By Application Method
- By Sales Channel
- United States
- Market Structure Analysis
- Competition Dashboard
- Competition Benchmarking
- Market Share Analysis of Top Players
- By Regional
- By Nutrient Type
- By Release Mechanism
- By Crop Type
- By Application Method
- By Sales Channel
- Emerging Startups
- Innovation Benchmarking
- Competition Analysis
- Competition Deep Dive
- Lucent Bio / Soileos
- Overview
- Product Portfolio
- Profitability by Market Segments
- Sales Footprint
- Strategy Overview
- Marketing Strategy
- Product Strategy
- Channel Strategy
- Nutrien / Loveland Products
- Rovensa Next
- Wilbur-Ellis
- Croda
- Clariant
- Evonik
- Syensqo
- Stepan Company
- Loveland Products
- Nutrien Ag Solutions
- Lucent Bio / Soileos
- Case Studies
- Success Stories
- Recent Developments
- Competition Deep Dive
- Assumptions & Acronyms Used


