

- Market Size (2026)
- USD 860.7 Mn
- Forecast (2036)
- USD 2294.0 Mn
- CAGR (2026 to 2036)
- 10.3%
How big is the Sports Turf Sensors Market in 2026?
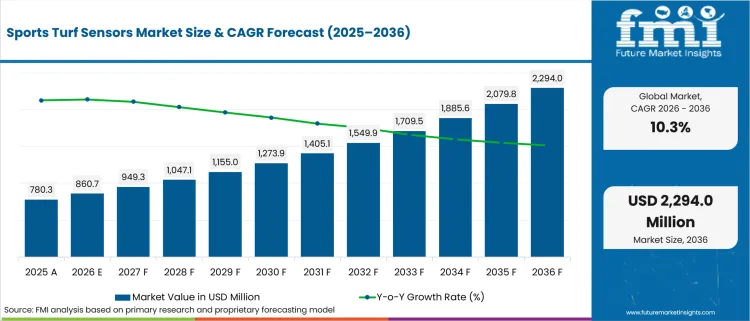
USD 860.7 million in 2026 and USD 2,294.0 million by 2036 at a 10.3% CAGR.
Sports turf management is shifting from visual field checks to measured root-zone control across stadiums and golf courses. Turf teams need proof that water is reaching the active profile before stress appears on the surface. EPA WaterSense materials state that as much as 50% of landscape irrigation water can be wasted from overwatering and system inefficiency. That waste risk makes readings more valuable in pitch irrigation systems that must protect turf health and water budgets. This shift supports sensors that translate agronomic readings into maintenance action.
Golf superintendents and stadium operators are using turf sensors to turn field condition data into daily maintenance instructions. Municipal venue owners use the same readings to defend contractor work and watering schedules during budget reviews. Established regions usually place sensors into golf-course management and stadium retrofit projects. High-growth regions use them closer to new venue construction and sports-infrastructure spending. The buying case becomes stronger when sensor data can change controller activity or trigger a work order. The USA Department of Energy stated in June 2026 that advanced irrigation controllers could achieve 38% water savings for soil moisture sensors and 15% savings for weather-based irrigation controllers. This makes non-agriculture smart irrigation controllers venues more valuable when they connect turf readings with measurable watering decisions across several field zones
| Metric | Value |
|---|---|
| 2025 Market Size | USD 780.3 million |
| 2026 Market Size | USD 860.7 million |
| 2036 Market Size | USD 2,294.0 million |
| Forecast CAGR (2026-2036) | 10.3% |
| Leading Sensor Type | Soil Moisture Sensors |
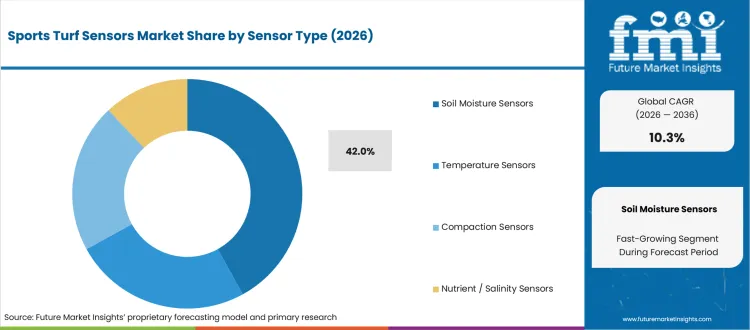
| Soil Moisture Sensors Share (2026) | 42.0% |
| Leading Application | Irrigation Optimization |
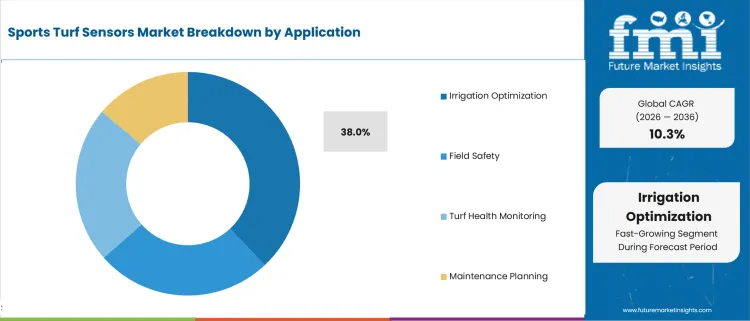
| Irrigation Optimization Share (2026) | 38.0% |
| Leading Venue Type | Golf Courses |
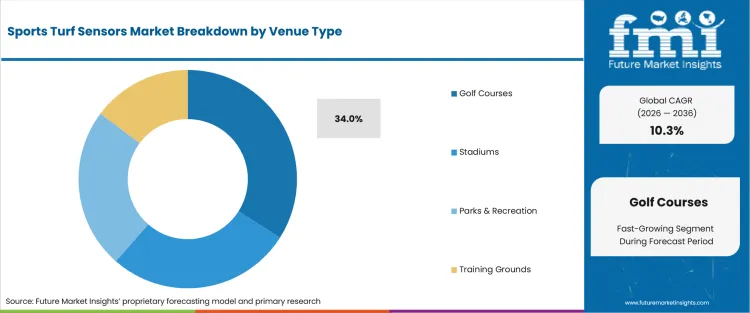
| Golf Courses Share (2026) | 34.0% |
| Fastest-growing Country | India |
| India CAGR by 2036 | 13.2% |
Summary of the Sports Turf Sensors Market
| Market Signal | Commercial Impact |
|---|---|
| Demand and Growth Drivers | Demand for sports turf sensors is increasing as sports facilities, golf courses, and stadium operators seek data-driven irrigation management, improved field quality, and efficient water conservation.
|
| Product and Segment View | Soil moisture sensors, irrigation optimization, and wireless connectivity continue to represent the strongest commercial opportunities across the sports turf sensor market.
|
| Geography and Growth Outlook | Asia continues to lead market growth through expanding sports infrastructure investment, premium venue development, and increasing adoption of smart turf management technologies.
|
| Competitive Landscape | Competition increasingly focuses on sensor accuracy, wireless connectivity, irrigation integration, data analytics, and field service capabilities.
|
| Analyst Perspective | Sports turf sensors are evolving from optional agronomy tools into essential field-management systems that improve irrigation efficiency, surface quality, and maintenance planning.
- Sudip saha, Principal Consultant at Future Market Insights |
How is the sports turf sensors market segmented?
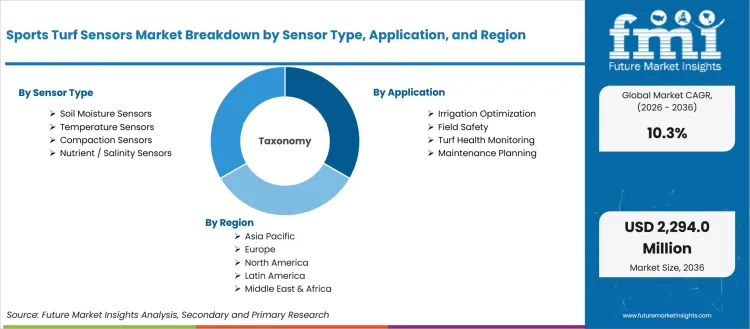
The Sports Turf Sensors industry is segmented by sensor type, application, venue type, connectivity, sales channel, and region.
The sports turf sensors market is segmented by sensor type, application, venue type, connectivity, sales channel, and region. Sensor type covers soil moisture sensors, temperature sensors, compaction sensors, and nutrient or salinity sensors. Application includes irrigation optimization, turf health monitoring, field safety, and maintenance planning. Venue type spans stadiums, golf courses, training grounds, and parks or recreation fields. Connectivity includes wireless or IoT, wired systems, and cloud-linked gateways. Sales channel covers direct OEM, turf contractors, and distributors. Regional coverage extends across North America, Latin America, Europe, East Asia, South Asia and Pacific, and the Middle East and Africa.
Why are soil moisture sensors important within the sensor type category?
Turf managers need root-zone visibility before surface symptoms appear. A dry profile under a green or goal mouth can develop before a surface looks stressed. Manual inspection is still useful, but repeated readings make staff decisions easier to defend. Soil moisture sensors are essential in this category by turning hidden water balance into a measurable maintenance variable for daily irrigation and playability control.
- In 2026, Soil Moisture Sensors are anticipated to hold 42.0% of sensor type demand driven by the need to identify water imbalance before turf stress is visible. USGA Green Section guidance from August 2024 explains that moisture meters help superintendents compare readings across greens. That evidence supports defensible watering decisions.
- The superintendent value is clearer daily control over watering decisions and surface consistency across important field zones. Teams using soil moisture readings can compare greens, goal mouths and training areas. This makes the sensor useful for staff handovers and contractor conversations that depend on evidence rather than visual opinion alone.
What supports demand for irrigation optimization?
Watering decisions carry more cost and playability risk than many other turf tasks. A sensor only creates value if readings influence pump schedules and sprinkler zones. Irrigation optimization therefore becomes the application layer that converts measurements into action. Venues using recirculating irrigation pumps also need feedback that separates necessary watering from excess cycling. That makes integration more important than a standalone probe.
- Irrigation optimization is set to represent 38.0% share in 2026, supported by buyer need to connect sensor readings to watering action. EPA materials state that soil moisture-based controllers can override scheduled watering. This evidence supports the segment by showing how readings move from measurement into direct irrigation control and staff action.
- Fewer isolated readings and stronger control over pump and sprinkler decisions is primary driver for the segment growth. Turf managers benefit from digital pump controllers that can make water delivery more responsive to field condition. That operating link helps suppliers sell sensor packages as workflow tools for pump timing, field-zone adjustment and daily maintenance records.
How do golf courses shape venue type demand?
Golf courses manage surface quality by using daily thresholds instead of occasional visual checks. Greens and tees carry different moisture needs across the same property. This makes repeated measurement useful for superintendent planning and tournament preparation. The category also overlaps with golf course engineering by connecting drainage design and irrigation response to measurement routines. That link gives sensor data a planning role beyond daily watering.
- Golf Courses is projected to account for 34.0% of venue type demand in 2026, owing to daily green-speed expectations and moisture consistency needs. USGA guidance on remote sensing shows how mapped turf information can guide irrigation decisions. This supports golf-course demand by showing why superintendents rely on repeatable agronomic thresholds. It also supports repeat sales to course operators.
- Course operators protect revenue from member play and tournaments that depend on consistent playing surfaces. Sensor data supports staff decisions before surface complaints affect playing quality. The business case gains weight once readings support golf tourism venues that need dependable greens during peak visitor periods and scheduled events.
How do buyers evaluate Wireless / IoT connectivity?
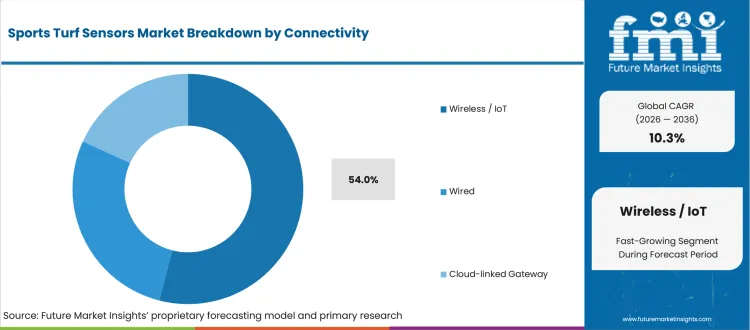
Distributed turf areas create a practical problem for wired measurement systems. Stadiums and golf courses need readings from several zones. Cabling can disrupt turf and slow projects. Wireless systems solve part of that issue by moving readings from buried devices to dashboards. This makes connectivity a buying factor rather than an afterthought in sensor selection and project planning. It also improves field coverage for multi-zone venues.
- Wireless / IoT is predicted to hold 54.0% in 2026, driven by demand for distributed readings and lower installation disruption. Soil Scout states that buried wireless sensors can measure moisture and salinity from below the playing surface. That supports wireless adoption in venues needing multi-zone visibility and cleaner maintenance records.
- The buyer value is faster visibility across zones that do not behave the same way during the season. Wireless readings help staff compare shaded areas, high-traffic corridors and field edges. This supports earlier maintenance action and gives managers a clearer record before field wear becomes visible to players or visitors.
How are turf contractors positioned within the sales channel category?
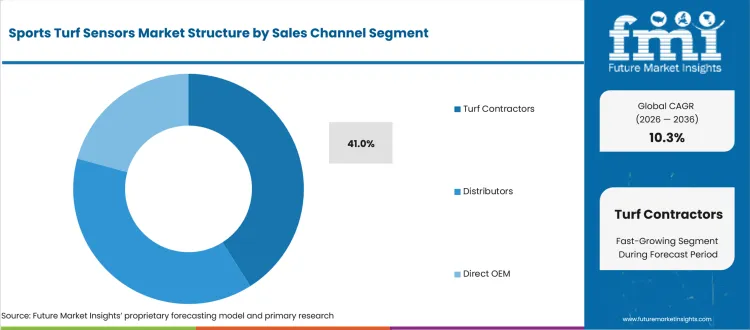
Sensor performance depends on placement quality and interpretation of field readings. A poorly placed probe can mislead a venue even if the device is accurate. Many operators therefore rely on contractors that understand turf profiles and irrigation layouts. This makes the sales channel important for first installation, calibration support and post-installation confidence. It also protects the credibility of sensor-led decisions.
- Turf Contractors is anticipated to account for 41.0% of sales channel demand in 2026, attributable to installation accuracy and retrofit project control. Sport England facility cost guidance from Q3 2024 treats sports facilities as planned capital projects. That supports contractor involvement during field upgrades, specification work and sensor placement decisions.
- Contractor-led sales reduce risk for buyers that need one route from survey to installation and service. This route gains importance during projects that combine sensors and synthetic turf cooling. The channel value improves once contractors translate readings into practical watering or maintenance changes. That support helps buyers avoid poorly located probes.
What are the drivers, restraints, and opportunities in the sports turf sensors market?
Near-term purchases are being shaped by the water measurement requirement and service-led expansion route outlined below.
- Driver: Water-control spending is driven by venues that need measurable root-zone evidence before water budgets and playability risks rise.
- Restraint: Calibration and placement uncertainty restrain adoption due to the risk that inaccurate readings can weaken trust in sensor-led maintenance decisions.
- Opportunity: Service-led monitoring gains traction from contractors that can combine installation, data review and seasonal turf recommendations.
Venue investment becomes easier to justify in cases where turf sensors are tied to measurable irrigation control. EPA said in March 2026 that WaterSense labeled irrigation controllers can save an average home up to 15,000 gallons of water each year. UF/IFAS stated in December 2025 that soil moisture sensor systems can reduce lawn water use by bypassing scheduled irrigation events. This is expected to drive demand for systems that connect field readings with controller actions. Buyers see stronger value as sensors prevent unnecessary watering and protect turf quality during daily maintenance.
Accuracy concerns slow purchase decisions at venues that lack agronomy staff or a clear owner for sensor data. The issue is not only the device. It is the question of whether one probe can represent a field zone after soil texture and installation depth change. Campbell Scientific's 2026 CS650 brochure lists a sensing volume of 7,800 cm3. That specificity shows why placement support is important. Vendors that train crews and verify probe locations can convert skepticism into paid service work for every mapped zone.
Service-led monitoring is the clearest expansion route for companies that can stay involved after installation. Many venues want seasonal interpretation rather than another dashboard. Soil Scout says its wireless soil moisture sensor can deliver up to 20 years of battery-powered performance. That figure supports a longer service model for sports turf by allowing buried sensors to remain in place across several seasons. Startups and contractors can build monitoring plans around audits, calibration visits and irrigation recommendations. This creates an account model that grows after the first installation.
Which country CAGRs are profiled in the sports turf sensors market?
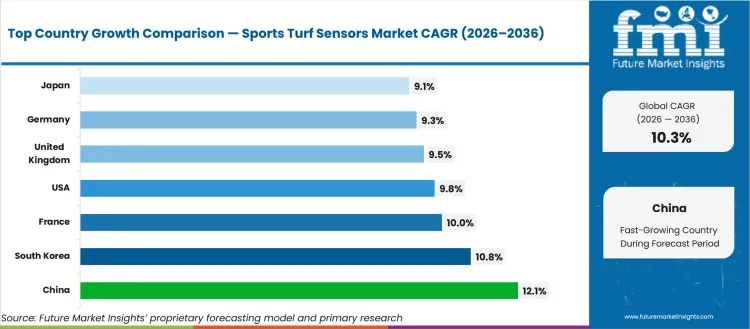
| Country | CAGR |
|---|---|
| United States | 9.8% |
| United Kingdom | 9.5% |
| Germany | 9.3% |
| France | 10.0% |
| Japan | 9.1% |
| China | 12.1% |
| South Korea | 10.8% |
| India | 13.2% |
How do country-level CAGRs compare in the sports turf sensors market?
Country profiles should be read around the operating pressure behind surface quality and field maintenance records. In established golf and stadium markets, demand is tied to water control and contractor service. Public agencies also need better evidence for facility planning. In high-growth markets, the same product sits closer to new sports infrastructure and venue modernization. China and India therefore show a stronger construction and retrofit signal. Japan and South Korea lean more toward high-spec venue operation. For buyers and investors, the practical question is how each country converts turf quality pressure into sensor purchasing and service demand. Suppliers should localize installation support before pushing dashboards.
- By 2036, the United States is projected to record 9.8% CAGR driven by golf estates and recreational fields that manage water risk at scale. EPA WaterSense reports that weather-based irrigation controllers can save nearly 7,600 gallons of water annually at an average home. Sports venues operate at a different scale, but the same water-control logic supports sensors that prove root-zone need before irrigation runs. The country therefore represents a service-led retrofit market in which golf contractors and irrigation specialists can influence adoption.
- The United Kingdom is expected to grow at 9.5% CAGR during the forecast period supported by public facility upgrades and planning-led pitch renewal. GOV.UK reported in January 2026 that the Multi-Sport Grassroots Facilities Programme is investing GBP 98 million in 2025/26. That funding context matters for sensors by showing why new and upgraded pitches need maintenance evidence after construction. The country represents a policy-supported retrofit market rather than a new-venue volume story for sensor suppliers. That favors vendors that can support councils and contractors.
- Over the assessment period, Germany is forecast to advance at 9.3% CAGR owing to renovation pressure across public and club sports facilities. DOSB states that the estimated cost of renovating sports facilities in Germany is about EUR 31 billion. This backlog makes sensors relevant once renovation teams need to improve water use and turf maintenance without rebuilding every field. Germany therefore represents a disciplined retrofit market centered on resource efficiency and life extension across existing assets. That favors suppliers that can document maintenance gains.
- France is anticipated to post 10.0% CAGR by 2036 reinforced by sports-ground investment after the Paris 2024 cycle. The French government reported that the 5,000 sports grounds plan is supported by EUR 300 million. That program gives municipalities a reason to specify measurable maintenance tools during upgrades. France compares with Germany on renovation logic, but its buyer trigger is more closely tied to Olympic legacy and public participation assets in community sport. That favors contractors able to train local facility teams.
- Japan is likely to expand at 9.1% CAGR by 2036 shaped by high-spec venue operation and training-center maintenance needs. Japan Sport Council materials for 2025-2026 reference facility management across Yoyogi National Stadium, AJINOMOTO NATIONAL TRAINING CENTER and AJINOMOTO FIELD NISHIGAOKA. That official facility scope supports demand for sensor records that help technical teams manage surfaces consistently. Japan represents a precision-maintenance market rather than a broad public-field expansion case for connected turf tools. That favors suppliers that support precise maintenance routines.
- China is estimated to rise at 12.1% CAGR between 2026 and 2036 supported by venue expansion and a larger managed-surface base. State Council data showed over 4.84 million sports venues across China in 2024. That scale is significant for sports turf sensors by showing how a small adoption rate can create meaningful retrofit volume. Urban facility programs also create demand for maintenance proof across public sites. China represents an infrastructure-scale market in which supplier education and service partners influence conversion.
- Demand in South Korea is projected to grow at 10.8% CAGR by 2036 propelled by premium sports operations and organized sports-industry spending. MCST reported in January 2026 that the sports industry included 131,764 businesses in 2024. That business base supports specialized suppliers and service providers that can package sensors with turf maintenance support. South Korea represents a compact high-spec market in which buyer expectations favor dependable readings and service response. That favors vendors combining sensors and local service support.
- India is expected to grow at 13.2% CAGR during the forecast period driven by public sports infrastructure and academy-led field upgrades. PIB reported in February 2025 that 1,041 Khelo India Centres had been established for athlete training and development. That network strengthens the case for sensors that help new facilities maintain playing quality after funding is approved. India represents a buildout market in which training centers and academies can set first-use reference cases. That favors supplier training before large-scale repeat purchasing.
Who are the notable companies in the sports turf sensors market?
The Toro Company, Rain Bird, Hunter Industries, Soil Scout, Campbell Scientific, METER Group, Spectrum Technologies, Pessl Instruments, Stevens Water Monitoring Systems, and Delta-T Devices are the notable companies shaping this market.
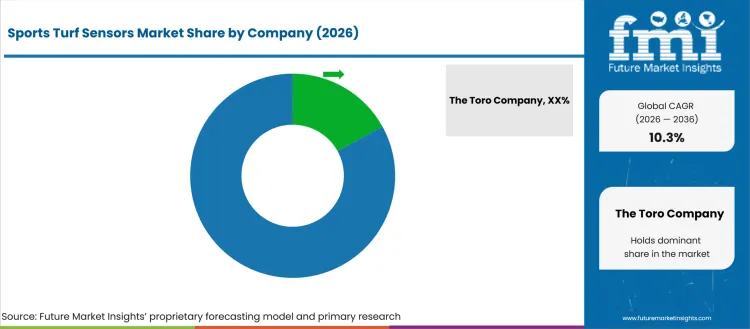
Supplier competition is shaped by the layer of turf management that the buyer wants to control first. Irrigation brands are better suited to projects centered on controllers and sprinkler performance. Sensor specialists are more relevant for projects that need higher confidence in root-zone readings. Environmental monitoring vendors gain relevance from data logging and wider field instrumentation. Buyers usually choose by asking whether the problem is irrigation action or soil measurement. Service support then shapes the final supplier choice. That makes contractor training and dashboard clarity as important as hardware depth. The final decision often depends on who owns field maintenance after installation.
- Irrigation equipment vendors are focusing on projects that begin around controller replacement and field watering standards. The Toro Company, Rain Bird and Hunter Industries are important due to product environments that already sit close to sprinkler schedules and central control systems.
- Sensor specialists focus on root-zone measurement and field readings that grounds teams can use before visible stress appears. Soil Scout, METER Group and Spectrum Technologies gain relevance from moisture and salinity measurement portfolios that fit golf courses and training grounds.
- Environmental monitoring vendors serve buyers that need data logging and broader field instrumentation. Campbell Scientific, Pessl Instruments and Stevens Water Monitoring Systems are suited to projects that connect turf readings with weather stations or long-term environmental records. Their role is relevant for buyers needing auditable readings over several seasons.
- Automation-adjacent suppliers become important once sensing data must trigger maintenance work rather than sit in isolated dashboards. Buyers considering golf course maintenance robots also need field data that can guide mowing patterns, moisture checks and work-order timing across the course.
Competitive Benchmarking: Sports Turf Sensors Market
| Company | Turf Sensor Portfolio Fit | Irrigation Workflow Fit | Service Capability | Geographic Footprint |
|---|---|---|---|---|
| The Toro Company | High | Strong | Strong | Global |
| Rain Bird | Medium | Strong | Strong | Global |
| Hunter Industries | Medium | Strong | Strong | Global |
| Soil Scout | High | Medium | Medium | Regional |
| Campbell Scientific | Strong | Medium | Strong | Global |
| METER Group | Strong | Medium | Strong | Global |
| Spectrum Technologies | High | Medium | Strong | Regional |
| Pessl Instruments | Medium | Medium | Strong | Global |
| Stevens Water Monitoring Systems | Medium | Medium | Strong | Global |
| Delta-T Devices | Medium | Medium | Medium | Regional |
Source: Future Market Insights competitive analysis, 2026. Ratings reflect relative portfolio relevance, workflow or project fit, service capability, and geographic reach.
Key Developments in the Sports Turf Sensors Market
- In February 2025, USGA introduced the USGA Moisture Meter using METER Group sensing technology and Deacon platform upload. The launch is important to sports turf sensors due to golf maintenance teams needing consistent moisture records. It supports the shift from spot checks toward repeatable course-management data.
- In February 2025, Toro and TerraRad announced soil-moisture mapping software that uses turfRad sensors on Toro equipment. The development matters by tying moisture measurements to mowing passes and Lynx Central Control. It points to a field workflow in which readings guide irrigation adjustments and course-level water planning.
- In November 2024, Pessl Instruments added METOS TSM for turf managers to measure root-zone moisture during surface movement. This supports mobile mapping instead of isolated spot checks and signals demand for tools that turn turf-condition variation into visible field maps and work instructions.
- In April 2026, Hunter Golf introduced Pilot Communication Modules for faster course connectivity. The development is significant due to connected irrigation systems needing reliable data exchange before sensor readings can influence controller decisions.
Key Players in the Sports Turf Sensors Market
Irrigation and Field Equipment Vendors
- The Toro Company
- Rain Bird
- Hunter Industries
Turf Sensing Specialists
- Soil Scout
- METER Group
- Spectrum Technologies
- Delta-T Devices
Environmental Monitoring Vendors
- Campbell Scientific
- Pessl Instruments
- Stevens Water Monitoring Systems
Sports Turf Sensors Market - Report Scope
| Coverage field | Report scope |
|---|---|
| Market breakdown | Sports Turf Sensors Market Breakdown By Sensor Type, Application, Venue Type, Connectivity, Sales Channel, and Region |
| Market Definition | Commercially sold sensors and connected devices that measure sports turf conditions for irrigation, turf health, safety and maintenance decisions |
| Regions Covered | North America, Latin America, Europe, East Asia, South Asia and Pacific, Middle East and Africa |
| Countries Covered | United States, United Kingdom, Germany, France, Japan, China, South Korea, India and 30+ countries |
| Key Companies Profiled | The Toro Company, Rain Bird, Hunter Industries, Soil Scout, Campbell Scientific, METER Group, Spectrum Technologies, Pessl Instruments, Stevens Water Monitoring Systems, Delta-T Devices |
| Forecast Period | 2026 to 2036 |
| Approach | Hybrid bottom-up and top-down methodology using venue counts, sensor adoption, irrigation retrofit intensity, contractor channels and country-level sports infrastructure signals |
Sports Turf Sensors Market - Research Methodology
| Method | Approach |
|---|---|
| Primary Research | FMI analysts reviewed inputs from golf superintendents, stadium grounds managers, turf contractors, irrigation integrators and sensor suppliers. Reviews focused on probe placement, maintenance workflow, dashboard use, service needs and buyer willingness to pay for repeatable field readings. |
| Desk Research | Desk research covered water-efficiency guidance, football turf standards, sports-facility datasets, official infrastructure programs, company product pages and recent supplier announcements. Product relevance was checked against turf moisture, temperature, salinity, compaction, irrigation and maintenance-planning use. |
| Market Sizing and Forecasting | The model combined sensor unit demand, average selling price, venue type mix, retrofit intensity, connectivity choice and contractor-led installation share. Country forecasts were adjusted for golf density, stadium upgrades, public sports funding, climate pressure and service-channel readiness. |
| Data Validation | Forecasts were checked against sports infrastructure evidence, irrigation controller demand, company product portfolios, and country-level venue data. Duplicate external statistics were tracked separately from market values so each public evidence figure supported only one section. |
Sports Turf Sensors Market by Segments
Sports Turf Sensors Market segmented by Sensor Type:
- Soil Moisture Sensors
- Temperature Sensors
- Compaction Sensors
- Nutrient / Salinity Sensors
Sports Turf Sensors Market segmented by Application:
- Irrigation Optimization
- Turf Health Monitoring
- Field Safety
- Maintenance Planning
Sports Turf Sensors Market segmented by Venue Type:
- Stadiums
- Golf Courses
- Training Grounds
- Parks & Recreation
Sports Turf Sensors Market segmented by Connectivity:
- Wireless / IoT
- Wired
- Cloud-linked Gateway
Sports Turf Sensors Market segmented by Sales Channel:
- Direct OEM
- Turf Contractors
- Distributors
Sports Turf Sensors Market by Region:
- North America
- United States
- Canada
- Mexico
- Latin America
- Brazil
- Chile
- Rest of Latin America
- Western Europe
- Germany
- UK
- Italy
- Spain
- France
- Nordic
- BENELUX
- Rest of Western Europe
- Eastern Europe
- Russia
- Poland
- Hungary
- Balkan & Baltic
- Rest of Eastern Europe
- East Asia
- China
- Japan
- South Korea
- South Asia and Pacific
- India
- ASEAN
- Australia & New Zealand
- Rest of South Asia and Pacific
- Middle East & Africa
- Kingdom of Saudi Arabia
- Other GCC Countries
- Turkiye
- South Africa
- Other African Union
- Rest of Middle East & Africa
Research Sources and Bibliography
- United States Environmental Protection Agency. (2026, March 5). WaterSense Labeled Controllers. USA EPA.
- United States Environmental Protection Agency. (2026, March 5). Soil Moisture-Based Irrigation Controllers. USA EPA.
- United States Environmental Protection Agency. (2026, March 5). Weather-Based Irrigation Controllers. USA EPA.
- United States Golf Association. (2024, August 2). Making Sense of Remote Sensing. United States Golf Association.
- United States Golf Association. (2025, February 3). Innovative Soil Moisture Meter Unveiled. United States Golf Association.
- Federation Internationale de Football Association. (2024, April 29). New edition of FIFA Test Manual for Football Turf released. FIFA.
- Sport England. (2026). Active Places Power. Sport England.
- Sport England. (2024, August). Facility cost guidance - Q3 2024. Sport England.
- Office for National Statistics. (2024, March 7). More adults are active in areas with a higher number of sports facilities. Office for National Statistics.
- Department for Culture, Media and Sport. (2026, January 27). Multi-Sport Grassroots Facilities Programme projects: 2025 to 2026. GOV.UK.
- German Olympic Sports Confederation. (2025). Sports facilities. DOSB.
- Government of France. (2024). A lasting legacy for the country. info.gouv.fr.
- Japan Sport Council. (2025). Japan Sport Council 2025-2026. Japan Sport Council.
- State Council of the People's Republic of China. (2025, March 19). China's per capita sports venue area reaches 3 sq m in 2024: official data.
- Ministry of Culture, Sports and Tourism of the Republic of Korea. (2026, January 12). Sports Industry Revenue Reaches Record High of KRW 84.7 Trillion in 2024. MCST.
- Press Information Bureau, Government of India. (2024, November 28). Implementation of Khelo India Scheme. Ministry of Youth Affairs and Sports.
- Press Information Bureau, Government of India. (2025, February 1). India's Growing Focus on Youth and Sports. Government of India.
- Campbell Scientific. (2026). CS650: 30 cm Soil Moisture and Temperature Sensor. Campbell Scientific.
- Spectrum Technologies. (2025). FieldScout TDR 350 Soil Moisture Meter. Spectrum Technologies.
- Pessl Instruments. (2024, November 7). Pessl Instruments adds METOS TSM to its portfolio and brings soil monitoring to a new level. METOS by Pessl Instruments.
- The Toro Company. (2025, February 5). Toro and TerraRad Partner to Lead Soil Moisture Software at GCSAA Show. Toro Newsroom.
- Hunter Industries. (2026, April 24). A Faster, Simpler Way to Keep Courses Connected. Hunter Industries.
This bibliography is provided for reader reference and uses primary government, standards-body, official trade body, and company sources.
This Report Answers
- What is the expected global value of the Sports Turf Sensors Market in 2026 and 2036?
- What CAGR is forecast for sports turf sensors during the 2026 to 2036 period?
- Which sensor type category is used to assess soil moisture sensor demand in 2026?
- Why do golf courses and stadiums buy sensors for turf management workflows?
- How do irrigation optimization and wireless connectivity shape buyer adoption?
- Which countries are compared in the Sports Turf Sensors Market forecast?
- Which companies compete across turf sensing, irrigation control and monitoring platforms?
- What capabilities are included within the sports turf sensors definition?
- How does FMI size and forecast sports turf sensor demand across segments and countries?
- What implementation and supplier-selection factors should venue executives assess?
Frequently Asked Questions
What is driving growth in the Sports Turf Sensors Market?
Growth is driven by water-control pressure, field-safety requirements and the need to turn turf readings into maintenance decisions.
Why should executives track the Sports Turf Sensors Market?
Executives should track this market because turf quality, water use, and field availability directly affect operating cost, event scheduling, asset lifespan, and public or commercial accountability for sports venues.
What business problem does the Sports Turf Sensors Market address?
It helps venue owners and grounds teams measure root‑zone conditions so irrigation and maintenance decisions are based on evidence rather than visual inspection, reducing turf failure, water waste, and recovery downtime.
What should procurement leaders evaluate before selecting suppliers?
Procurement leaders should evaluate sensor accuracy, calibration stability, placement guidance, integration with irrigation controllers, data visibility, installation support, and the supplier’s ability to translate readings into maintenance actions.
What can limit return on investment for buyers?
Return on investment can be limited when sensors are poorly placed, insufficiently calibrated, or disconnected from irrigation and maintenance workflows; buyers reduce this risk by pairing hardware with contractor support and clear operational ownership.
How can suppliers build executive confidence?
Suppliers build confidence by demonstrating measurable reductions in water use, faster turf recovery, reliable zone‑level readings, clear installation standards, and ongoing service support that ties data to field performance outcomes.
Preview the report firsthand - request a free sample
Get SampleGet the brochure for pricing and purchase details.
Get PDFTable of Content
- Key Takeaways
- Market Size and CAGR
- Top Growth Driver
- Fastest Growing Segment
- Leading Region
- Key Companies
- Emerging Opportunities
- Executive Summary
- Global Market Outlook
- Demand-side Trends
- Supply-side Trends
- Technology Roadmap Analysis
- Analysis and Recommendations
- Analyst Perspective (What is happening? Why now? What should investors know?)
- Key Questions Answered
- How large is the market?
- What is the CAGR?
- What are key trends?
- Which region dominates?
- Who are the leaders?
- Market Overview
- Market Coverage / Taxonomy
- Market Definition / Scope / Limitations
- Research Methodology
- Chapter Orientation
- Analytical Lens and Working Hypotheses
- Market Structure, Signals, and Trend Drivers
- Benchmarking and Cross-market Comparability
- Market Sizing, Forecasting, and Opportunity Mapping
- Research Design and Evidence Framework
- Desk Research Programme (Secondary Evidence)
- Expert Input and Fieldwork (Primary Evidence)
- Tooling, Models, and Reference Databases
- Data Engineering and Model Build
- Quality Assurance and Audit Trail
- Market Background
- Market Dynamics (Drivers, Restraints, Opportunity, Trends)
- Scenario Forecast (Optimistic, Likely, Conservative)
- Impact Analysis
- AI Impact
- Sustainability Impact
- Regulatory Impact
- Technology Impact
- Consumer / Buyer Analysis
- Purchase Drivers
- Adoption Barriers
- Buyer Journey
- Opportunity Map Analysis
- Product Life Cycle Analysis
- Supply Chain Analysis
- Investment Feasibility Matrix
- Value Chain Analysis
- PESTLE and Porter's Analysis
- Regulatory Landscape
- Regional Parent Market Outlook
- Production and Consumption Statistics
- Import and Export Statistics
- Global Market Analysis and Forecast, 2021 to 2036
- Historical Market Size Value (USD Million) & Volume (Unit) Analysis, 2021 to 2025
- Current and Future Market Size Value (USD Million) & Volume (Unit) Projections, 2026 to 2036
- Y-o-Y Growth Trend Analysis
- Absolute $ Opportunity Analysis
- Global Market Pricing Analysis, 2021 to 2036
- Global Market Analysis and Forecast, By Sensor Type, 2021 to 2036
- Introduction / Key Findings
- Historical Market Size Value (USD Million) & Volume (Unit) Analysis By Sensor Type, 2021 to 2025
- Current and Future Market Size Value (USD Million) & Volume (Unit) Analysis and Forecast By Sensor Type, 2026 to 2036
- Soil Moisture Sensors
- Temperature Sensors
- Compaction Sensors
- Nutrient / Salinity Sensors
- Soil Moisture Sensors
- Y-o-Y Growth Trend Analysis By Sensor Type, 2021 to 2025
- Absolute $ Opportunity Analysis By Sensor Type, 2026 to 2036
- Global Market Analysis and Forecast, By Application, 2021 to 2036
- Introduction / Key Findings
- Historical Market Size Value (USD Million) & Volume (Unit) Analysis By Application, 2021 to 2025
- Current and Future Market Size Value (USD Million) & Volume (Unit) Analysis and Forecast By Application, 2026 to 2036
- Irrigation Optimization
- Field Safety
- Turf Health Monitoring
- Maintenance Planning
- Irrigation Optimization
- Y-o-Y Growth Trend Analysis By Application, 2021 to 2025
- Absolute $ Opportunity Analysis By Application, 2026 to 2036
- Global Market Analysis and Forecast, By Venue Type, 2021 to 2036
- Introduction / Key Findings
- Historical Market Size Value (USD Million) & Volume (Unit) Analysis By Venue Type, 2021 to 2025
- Current and Future Market Size Value (USD Million) & Volume (Unit) Analysis and Forecast By Venue Type, 2026 to 2036
- Golf Courses
- Stadiums
- Parks & Recreation
- Training Grounds
- Golf Courses
- Y-o-Y Growth Trend Analysis By Venue Type, 2021 to 2025
- Absolute $ Opportunity Analysis By Venue Type, 2026 to 2036
- Global Market Analysis and Forecast, By Connectivity, 2021 to 2036
- Introduction / Key Findings
- Historical Market Size Value (USD Million) & Volume (Unit) Analysis By Connectivity, 2021 to 2025
- Current and Future Market Size Value (USD Million) & Volume (Unit) Analysis and Forecast By Connectivity, 2026 to 2036
- Wireless / IoT
- Wired
- Cloud-linked Gateway
- Wireless / IoT
- Y-o-Y Growth Trend Analysis By Connectivity, 2021 to 2025
- Absolute $ Opportunity Analysis By Connectivity, 2026 to 2036
- Global Market Analysis and Forecast, By Sales Channel, 2021 to 2036
- Introduction / Key Findings
- Historical Market Size Value (USD Million) & Volume (Unit) Analysis By Sales Channel, 2021 to 2025
- Current and Future Market Size Value (USD Million) & Volume (Unit) Analysis and Forecast By Sales Channel, 2026 to 2036
- Turf Contractors
- Distributors
- Direct OEM
- Turf Contractors
- Y-o-Y Growth Trend Analysis By Sales Channel, 2021 to 2025
- Absolute $ Opportunity Analysis By Sales Channel, 2026 to 2036
- Global Market Analysis and Forecast, By Region, 2021 to 2036
- Introduction
- Historical Market Size Value (USD Million) & Volume (Unit) Analysis By Region, 2021 to 2025
- Current Market Size Value (USD Million) & Volume (Unit) Analysis and Forecast By Region, 2026 to 2036
- North America
- Latin America
- Western Europe
- Eastern Europe
- East Asia
- South Asia and Pacific
- Middle East & Africa
- Market Attractiveness Analysis By Region
- North America Market Analysis and Forecast, By Country, 2021 to 2036
- Historical Market Size Value (USD Million) & Volume (Unit) Trend Analysis By Market Taxonomy, 2021 to 2025
- Market Size Value (USD Million) & Volume (Unit) Forecast By Market Taxonomy, 2026 to 2036
- By Country
- USA
- Canada
- Mexico
- By Sensor Type
- By Application
- By Venue Type
- By Connectivity
- By Sales Channel
- By Country
- Market Attractiveness Analysis
- By Country
- By Sensor Type
- By Application
- By Venue Type
- By Connectivity
- By Sales Channel
- Key Takeaways
- Latin America Market Analysis and Forecast, By Country
- Historical Market Size Value (USD Million) & Volume (Unit) Trend Analysis By Market Taxonomy, 2021 to 2025
- Market Size Value (USD Million) & Volume (Unit) Forecast By Market Taxonomy, 2026 to 2036
- By Country
- Brazil
- Chile
- Rest of Latin America
- By Sensor Type
- By Application
- By Venue Type
- By Connectivity
- By Sales Channel
- By Country
- Market Attractiveness Analysis
- By Country
- By Sensor Type
- By Application
- By Venue Type
- By Connectivity
- By Sales Channel
- Key Takeaways
- Western Europe Market Analysis and Forecast, By Country
- Historical Market Size Value (USD Million) & Volume (Unit) Trend Analysis By Market Taxonomy, 2021 to 2025
- Market Size Value (USD Million) & Volume (Unit) Forecast By Market Taxonomy, 2026 to 2036
- By Country
- Germany
- UK
- Italy
- Spain
- France
- Nordic
- BENELUX
- Rest of Western Europe
- By Sensor Type
- By Application
- By Venue Type
- By Connectivity
- By Sales Channel
- By Country
- Market Attractiveness Analysis
- By Country
- By Sensor Type
- By Application
- By Venue Type
- By Connectivity
- By Sales Channel
- Key Takeaways
- Eastern Europe Market Analysis and Forecast, By Country
- Historical Market Size Value (USD Million) & Volume (Unit) Trend Analysis By Market Taxonomy, 2021 to 2025
- Market Size Value (USD Million) & Volume (Unit) Forecast By Market Taxonomy, 2026 to 2036
- By Country
- Russia
- Poland
- Hungary
- Balkan & Baltic
- Rest of Eastern Europe
- By Sensor Type
- By Application
- By Venue Type
- By Connectivity
- By Sales Channel
- By Country
- Market Attractiveness Analysis
- By Country
- By Sensor Type
- By Application
- By Venue Type
- By Connectivity
- By Sales Channel
- Key Takeaways
- East Asia Market Analysis and Forecast, By Country
- Historical Market Size Value (USD Million) & Volume (Unit) Trend Analysis By Market Taxonomy, 2021 to 2025
- Market Size Value (USD Million) & Volume (Unit) Forecast By Market Taxonomy, 2026 to 2036
- By Country
- China
- Japan
- South Korea
- By Sensor Type
- By Application
- By Venue Type
- By Connectivity
- By Sales Channel
- By Country
- Market Attractiveness Analysis
- By Country
- By Sensor Type
- By Application
- By Venue Type
- By Connectivity
- By Sales Channel
- Key Takeaways
- South Asia and Pacific Market Analysis and Forecast, By Country
- Historical Market Size Value (USD Million) & Volume (Unit) Trend Analysis By Market Taxonomy, 2021 to 2025
- Market Size Value (USD Million) & Volume (Unit) Forecast By Market Taxonomy, 2026 to 2036
- By Country
- India
- ASEAN
- Australia & New Zealand
- Rest of South Asia and Pacific
- By Sensor Type
- By Application
- By Venue Type
- By Connectivity
- By Sales Channel
- By Country
- Market Attractiveness Analysis
- By Country
- By Sensor Type
- By Application
- By Venue Type
- By Connectivity
- By Sales Channel
- Key Takeaways
- Middle East & Africa Market Analysis and Forecast, By Country
- Historical Market Size Value (USD Million) & Volume (Unit) Trend Analysis By Market Taxonomy, 2021 to 2025
- Market Size Value (USD Million) & Volume (Unit) Forecast By Market Taxonomy, 2026 to 2036
- By Country
- Kingdom of Saudi Arabia
- Other GCC Countries
- Türkiye
- South Africa
- Other African Union
- Rest of Middle East & Africa
- By Sensor Type
- By Application
- By Venue Type
- By Connectivity
- By Sales Channel
- By Country
- Market Attractiveness Analysis
- By Country
- By Sensor Type
- By Application
- By Venue Type
- By Connectivity
- By Sales Channel
- Key Takeaways
- Key Countries Market Analysis
- USA
- Pricing Analysis
- Market Share Analysis, 2025
- By Sensor Type
- By Application
- By Venue Type
- By Connectivity
- By Sales Channel
- Canada
- Pricing Analysis
- Market Share Analysis, 2025
- By Sensor Type
- By Application
- By Venue Type
- By Connectivity
- By Sales Channel
- Mexico
- Pricing Analysis
- Market Share Analysis, 2025
- By Sensor Type
- By Application
- By Venue Type
- By Connectivity
- By Sales Channel
- Brazil
- Pricing Analysis
- Market Share Analysis, 2025
- By Sensor Type
- By Application
- By Venue Type
- By Connectivity
- By Sales Channel
- Chile
- Pricing Analysis
- Market Share Analysis, 2025
- By Sensor Type
- By Application
- By Venue Type
- By Connectivity
- By Sales Channel
- Germany
- Pricing Analysis
- Market Share Analysis, 2025
- By Sensor Type
- By Application
- By Venue Type
- By Connectivity
- By Sales Channel
- UK
- Pricing Analysis
- Market Share Analysis, 2025
- By Sensor Type
- By Application
- By Venue Type
- By Connectivity
- By Sales Channel
- Italy
- Pricing Analysis
- Market Share Analysis, 2025
- By Sensor Type
- By Application
- By Venue Type
- By Connectivity
- By Sales Channel
- Spain
- Pricing Analysis
- Market Share Analysis, 2025
- By Sensor Type
- By Application
- By Venue Type
- By Connectivity
- By Sales Channel
- France
- Pricing Analysis
- Market Share Analysis, 2025
- By Sensor Type
- By Application
- By Venue Type
- By Connectivity
- By Sales Channel
- India
- Pricing Analysis
- Market Share Analysis, 2025
- By Sensor Type
- By Application
- By Venue Type
- By Connectivity
- By Sales Channel
- ASEAN
- Pricing Analysis
- Market Share Analysis, 2025
- By Sensor Type
- By Application
- By Venue Type
- By Connectivity
- By Sales Channel
- Australia & New Zealand
- Pricing Analysis
- Market Share Analysis, 2025
- By Sensor Type
- By Application
- By Venue Type
- By Connectivity
- By Sales Channel
- China
- Pricing Analysis
- Market Share Analysis, 2025
- By Sensor Type
- By Application
- By Venue Type
- By Connectivity
- By Sales Channel
- Japan
- Pricing Analysis
- Market Share Analysis, 2025
- By Sensor Type
- By Application
- By Venue Type
- By Connectivity
- By Sales Channel
- South Korea
- Pricing Analysis
- Market Share Analysis, 2025
- By Sensor Type
- By Application
- By Venue Type
- By Connectivity
- By Sales Channel
- Russia
- Pricing Analysis
- Market Share Analysis, 2025
- By Sensor Type
- By Application
- By Venue Type
- By Connectivity
- By Sales Channel
- Poland
- Pricing Analysis
- Market Share Analysis, 2025
- By Sensor Type
- By Application
- By Venue Type
- By Connectivity
- By Sales Channel
- Hungary
- Pricing Analysis
- Market Share Analysis, 2025
- By Sensor Type
- By Application
- By Venue Type
- By Connectivity
- By Sales Channel
- Kingdom of Saudi Arabia
- Pricing Analysis
- Market Share Analysis, 2025
- By Sensor Type
- By Application
- By Venue Type
- By Connectivity
- By Sales Channel
- Türkiye
- Pricing Analysis
- Market Share Analysis, 2025
- By Sensor Type
- By Application
- By Venue Type
- By Connectivity
- By Sales Channel
- South Africa
- Pricing Analysis
- Market Share Analysis, 2025
- By Sensor Type
- By Application
- By Venue Type
- By Connectivity
- By Sales Channel
- USA
- Market Structure Analysis
- Competition Dashboard
- Competition Benchmarking
- Market Share Analysis of Top Players
- By Regional
- By Sensor Type
- By Application
- By Venue Type
- By Connectivity
- By Sales Channel
- Emerging Startups
- Innovation Benchmarking
- Competition Analysis
- Competition Deep Dive
- The Toro Company
- Overview
- Product Portfolio
- Profitability by Market Segments (Product/Region/Sales Channel)
- Sales Footprint
- Strategy Overview
- Marketing Strategy
- Product Strategy
- Channel Strategy
- Rain Bird
- Hunter Industries
- Soil Scout
- Spectrum Technologies
- The Toro Company
- Case Studies
- Success Stories
- Recent Developments
- Competition Deep Dive
- Assumptions & Acronyms Used


