Submerged Chain Conveyor Market Forecast and Outlook (2025-2035)

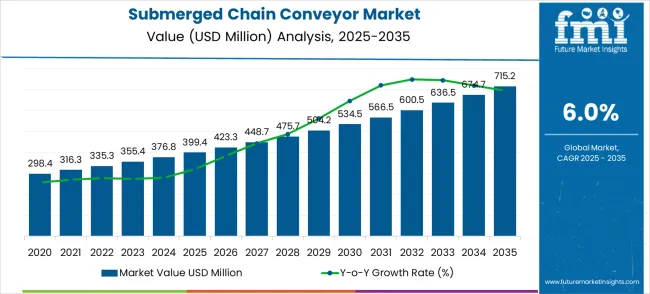
The submerged chain conveyor market is valued at USD 399.4 million in 2025 and is set to reach USD 715.2 million by 2035, with a CAGR of 6%. In the first five years (2021–2025), the market grows from USD 298.4 million to USD 399.4 million. This initial phase sees steady annual increments from USD 316.3 million in 2022, USD 335.3 million in 2023, USD 355.4 million in 2024, to USD 376.8 million in 2025. This growth is primarily driven by the expanding demand for submerged chain conveyors in sectors such as cement, steel, and power plants, where efficient material handling, waste treatment, and conveying systems are crucial. The adoption of advanced conveyor technologies, including energy-efficient and low-maintenance designs, also supports this steady rise in the market.
Quick Stats for Submerged Chain Conveyor Market

  • Submerged Chain Conveyor Market Value (2025): USD 399.4 million
  • Submerged Chain Conveyor Market Forecast Value (2035): USD 715.2 million
  • Submerged Chain Conveyor Market Forecast CAGR: 6.0%
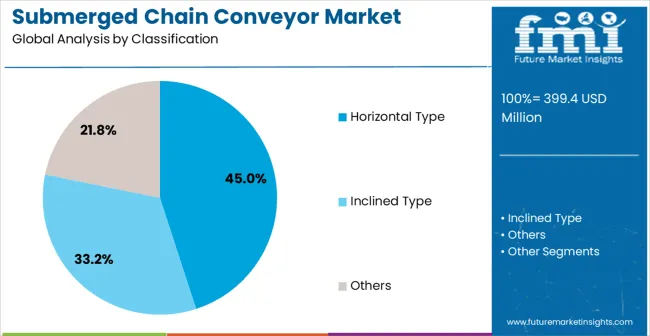
  • Leading Orientation in Submerged Chain Conveyor Market: Horizontal Type (45%)
  • Key Growth Regions in Submerged Chain Conveyor Market: Asia Pacific, North America, and Europe
  • Key Players in Submerged Chain Conveyor Market: Babcock & Wilcox Enterprises, Inc., Clyde Bergemann, FLSmidth, UCC Environmental, Magaldi Power, Bevcon Wayors

Submerged Chain Conveyor Market Market Value Analysis

From 2026 to 2030, the market strengthens significantly, increasing from USD 399.4 million in 2025 to USD 534.5 million by 2030. Intermediate values during this period include USD 423.3 million in 2026, USD 448.7 million in 2027, and USD 475.7 million in 2028. Growth is driven by the increasing integration of automation in manufacturing processes, the adoption of submerged chain conveyors in new infrastructure projects, and the need for more efficient material handling in industries facing rapid urbanization and industrialization. The push toward replacing outdated equipment with more efficient systems also contributes to market growth.

Submerged Chain Conveyor Market Key Takeaways

Metric Value
Estimated Value in (2025E) USD 399.4 million
Forecast Value in (2035F) USD 715.2 million
Forecast CAGR (2025 to 2035) 6%

The material handling equipment market is the largest parent market, accounting for approximately 30-35% of the market share. Submerged chain conveyors are widely used for the transport of materials in industries such as mining, cement, and waste-to-energy, making this market critical to the overall demand. The waste management and recycling market contributes around 20-25%, as submerged chain conveyors are often employed in waste incineration plants, where they efficiently handle the movement of ash and other by-products. The steel manufacturing market plays a significant role, with about 15-20% of the market share, as submerged chain conveyors are used in steel plants for moving hot and abrasive materials like slag and steel billets.

The mining and minerals processing market accounts for approximately 10-15%, as submerged chain conveyors are commonly used in mining operations to transport heavy loads of minerals, ores, and other materials. The power generation market, contributing about 10-15%, relies on submerged chain conveyors in coal-fired power plants and waste-to-energy facilities for handling ash and other waste materials.

Why is the Submerged Chain Conveyor Market Growing?

Market expansion is being supported by the increasing global demand for reliable power generation infrastructure and the corresponding need for robust material handling systems that can operate in high-temperature environments, ensure continuous ash removal, and maintain operational efficiency across various thermal power, waste incineration, and biomass processing applications. Modern power plant operators and industrial facility managers are increasingly focused on implementing conveying solutions that can handle abrasive materials, withstand extreme temperatures, and provide consistent performance in demanding operating conditions. Submerged chain conveyors' proven ability to deliver reliable material handling, operate in harsh environments, and support continuous plant operations makes them essential equipment for contemporary power generation and industrial processing facilities.

The growing focus on environmental compliance and operational efficiency is driving demand for submerged chain conveyors that can support effective waste handling, ensure reliable material transportation, and enable comprehensive ecological control. Power generation facilities' preference for material handling systems that combine durability with operational reliability and maintenance efficiency is creating opportunities for innovative submerged chain conveyor implementations. The rising influence of renewable energy integration and waste-to-energy technologies is also contributing to increased adoption of submerged chain conveyors that can provide reliable material handling without compromising operational efficiency or environmental performance.

Segmental Analysis

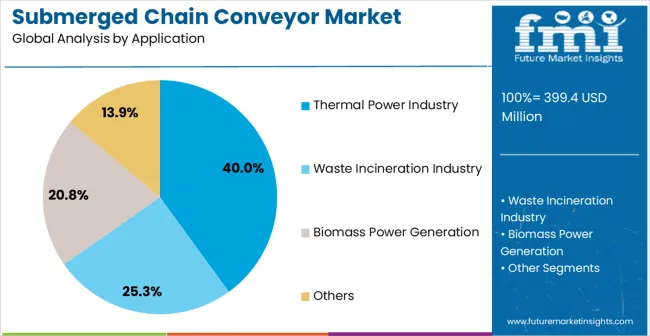
The market is segmented by orientation, application, and region. By orientation, the market is divided into horizontal type, inclined type, and others. Based on application, the market is categorized into the thermal power industry, the waste incineration industry, biomass power generation, and others. Regionally, the market is divided into Asia Pacific, North America, Europe, Latin America, and the Middle East & Africa.
By Orientation, the Horizontal Type Segment Accounts for 45% Market Share

Submerged Chain Conveyor Market Analysis By Classification

The horizontal type segment is projected to maintain its leading position in the submerged chain conveyor market in 2025, accounting for 45% of the total market share. This segment reaffirms its role as the preferred configuration for level material transportation and ash handling applications. Power plant operators and industrial facility managers increasingly utilize horizontal submerged chain conveyors for their straightforward installation requirements, reliable material flow characteristics, and versatility across various plant layouts and material handling scenarios. Horizontal conveyor technology’s proven effectiveness and operational simplicity directly address industrial needs for efficient material transportation and consistent performance in power generation and processing applications.
  • Known for easy installation and consistent operational performance across a range of plant configurations.
  • Provides high versatility for handling different types of materials in power generation facilities.
  • Continual adoption driven by improvements in material flow efficiency and low maintenance needs.

By Application, the Thermal Power Industry Accounts for 40% Market Share

Submerged Chain Conveyor Market Analysis By Application

The thermal power industry application segment is expected to represent 40% of submerged chain conveyor demand in 2025, making it the largest sector for specialized conveyor adoption. Coal-fired power plants, gas-fired facilities, and combined-cycle operations all rely on submerged chain conveyors for effective ash handling due to their high-temperature operation capabilities, reliable material handling performance, and the ability to ensure continuous ash removal while maintaining plant efficiency and environmental compliance. Submerged chain conveyors are considered essential in modern thermal power operations, offering both operational advantages and reliability benefits.

  • Essential for ash handling in high-temperature, demanding power plant environments.
  • Supports large-scale power generation and compliance with ecological standards in modern thermal power plants.
  • Key to continuous innovation in power generation technologies and material handling efficiency.

What are the Drivers, Restraints, and Key Trends of the Submerged Chain Conveyor Market?

The submerged chain conveyor market is advancing steadily due to increasing demand for reliable power generation infrastructure and growing adoption of specialized material handling technologies that provide enhanced operational efficiency and environmental compliance across diverse power generation and industrial processing applications. The market faces challenges, including high capital investment costs and installation complexity, maintenance requirements in harsh operating environments, and competition from alternative ash handling technologies and conveyor systems. Innovation in automation technologies and remote monitoring systems continues to influence product development and market expansion patterns.

Expansion of Advanced Automation Technologies and Remote Monitoring Systems

The growing adoption of intelligent automation and remote monitoring technologies is enabling power plant operators to achieve superior operational control, predictive maintenance capabilities, and comprehensive system monitoring for enhanced facility management. Advanced automation systems provide improved operational efficiency while allowing more proactive maintenance scheduling and consistent performance monitoring across various conveyor installations and operating conditions. Manufacturers are increasingly recognizing the competitive advantages of automation integration for operational differentiation and facility optimization.

Integration of Environmental Compliance and Energy Solutions

Modern submerged chain conveyor manufacturers are incorporating environmental compliance features and energy-efficient technologies to enhance operational performance, reduce environmental impact, and support comprehensive facility environmental management through optimized material handling and emission control systems. These technologies improve ecological performance while enabling new applications, including waste-to-energy integration and circular economy implementation. Advanced environmental integration also allows facilities to meet broader environmental compliance objectives beyond traditional material handling approaches.
Analysis of the Submerged Chain Conveyor Market by Key Countries

Submerged Chain Conveyor Market Cagr Analysis By Country

Country CAGR (2025-2035)
China 8.1%
India 7.5%
Germany 6.9%
Brazil 6.3%
USA 5.7%
UK 5.1%
Japan 4.5%

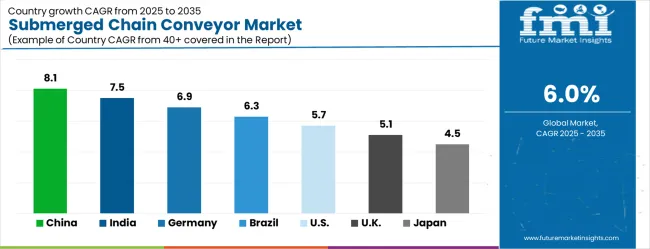
The submerged chain conveyor market is experiencing solid growth globally, with China leading at an 8.1% CAGR through 2035, driven by the expanding power generation infrastructure, growing industrial capacity, and significant investment in coal-fired power plants and waste-to-energy facilities development. India follows at 7.5%, supported by rapid power sector growth, increasing industrial development, and growing adoption of advanced ash handling systems in thermal power generation. Germany shows growth at 6.9%, emphasizing advanced engineering and precision conveyor technology development. Brazil records 6.3%, focusing on power infrastructure expansion and industrial modernization initiatives. The USA demonstrates 5.7% growth, supported by established power generation infrastructure and focus on facility modernization. The UK exhibits 5.1% growth, emphasizing power sector efficiency and environmental compliance technologies. Japan shows 4.5% growth, supported by advanced power generation technologies and precision material handling systems.

The report covers an in-depth analysis of 40+ countries with top-performing countries highlighted below.

In-depth Analysis of Submerged Chain Conveyor Market in India

India is projected to grow at a CAGR of 7.5% from 2025 to 2035 in the submerged chain conveyor market. The expanding industrial sectors, particularly in steel, cement, and power generation, are driving this demand. As India focuses on modernizing its manufacturing infrastructure, the need for efficient material handling systems like submerged chain conveyors is increasing. The government push to improve industrial capabilities and infrastructure is expected to further propel market growth. With the increasing energy demand and expansion in thermal and power generation plants, the requirement for advanced, energy-efficient conveyor systems is becoming more critical. As automation becomes a greater focus in Indian industries, submerged chain conveyors will play an essential role in improving operational efficiency.

  • Growing demand from steel, cement, and power generation sectors
  • Government initiatives to improve industrial infrastructure
  • Increased focus on automation and energy-efficient solutions

Demand Forecast for Submerged Chain Conveyor Market in China

The submerged chain conveyor market in China is set to grow at a CAGR of 8.1% from 2025 to 2035. The country’s position as a global manufacturing hub, especially in industries like steel and cement, is driving demand for efficient material handling systems. As China modernizes its industrial infrastructure and emphasizes automation, the need for advanced conveyor systems is increasing. The growing energy production, particularly in coal-fired power plants, also contributes to the rising demand for submerged chain conveyors in the power sector. With significant investments in smart factories and environmentally-friendly technologies, China is positioning itself as a leader in adopting efficient conveyor solutions. This focus on advanced technologies in industrial settings is expected to foster market growth for submerged chain conveyors.

  • Strong demand from China’s manufacturing and power generation sectors
  • Modernization of industrial infrastructure driving adoption of advanced conveyors
  • Increasing investments in smart factories and energy-efficient solutions

Growth Prospects for Submerged Chain Conveyor Market in Germany

Demand for submerged chain conveyor in Germany is growing at a CAGR of 6.9% from 2025 to 2035. As a global leader in industrial manufacturing, The demand for efficient material handling systems is being driven by its strong automotive, steel, cement, and power generation sectors. The continued focus on high-quality production standards and technological advancements has led to the increasing adoption of automated systems in manufacturing facilities. The focus on smart factories and Industry initiatives is also contributing to the market growth, as submerged chain conveyors are integral to improving operational efficiency and reducing downtime in industries. The growing industrial base, along with the country’s commitment to automation and energy savings, is expected to drive significant demand for submerged chain conveyors.

  • Rising demand in steel, cement, and power generation industries
  • Adoption of Industry 4.0 and automation technologies
  • Focus on energy efficiency and operational optimization in manufacturing

focusSubmerged Chain Conveyor Market Expansion in Brazil

Brazil is experiencing steady growth in the submerged chain conveyor market, with an expected CAGR of 6.3% from 2025 to 2035. Brazil’s industrial sectors, particularly mining, steel production, and cement, are driving the demand for reliable conveyor systems. As the country continues to expand its industrial base and enhance manufacturing capabilities, there is a growing need for efficient and durable material handling systems. Brazil’s mining sector, one of the largest in the world, significantly contributes to the growth of submerged chain conveyors. The country’s push towards modernization of infrastructure and investment in power generation plants will also help drive market expansion.
  • Demand driven by Brazil’s mining and manufacturing sectors
  • Growing infrastructure investments supporting industrial growth
  • Increased focus on improving power generation capabilities

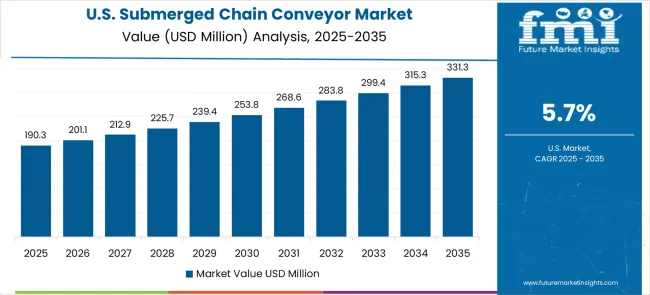
Future Outlook of Submerged Chain Conveyor Market in the United States

Submerged Chain Conveyor Market Country Value Analysis

The submerged chain conveyor market in the United States is expected to grow at a CAGR of 5.7% from 2025 to 2035. The USA is witnessing steady demand from sectors like steel, cement, and power generation, where efficient material handling is critical. As the country focuses on improving its industrial capabilities and investing in infrastructure, submerged chain conveyors are becoming integral to manufacturing and power plants. The USA industrial sector’s focus on automation and operational efficiency further drives the need for advanced conveyor systems. The increasing demand for energy-efficient and durable systems in thermal power plants and cement industries is expected to support the market’s expansion.

  • Steady demand from the steel, cement, and power sectors
  • Focus on automation and energy-efficient systems in industrial applications
  • Increased investments in infrastructure modernization and smart factory technologies

Submerged Chain Conveyor Market Adoption Trends in the United Kingdom

The United Kingdom’s submerged chain conveyor market is projected to grow at a CAGR of 5.1% from 2025 to 2035. The UK’s focus on improving industrial efficiency and adopting automation technologies is driving demand for high-performance material handling systems. As industries such as steel, cement, and waste management expand, the need for submerged chain conveyors to support these operations is becoming more prominent. The UK’s growing focus on environmental standards and energy efficiency is pushing for the adoption of more energy-saving conveyor systems. The continued push towards Industry 4.0 and digital transformation in manufacturing processes is expected to further enhance the market’s growth.
  • Expanding demand from steel, cement, and waste management industries
  • Increasing adoption of automation and digital technologies in manufacturing
  • Focus on energy-efficient and green systems in industrial settings

Sales Analysis of Submerged Chain Conveyor Market in Japan

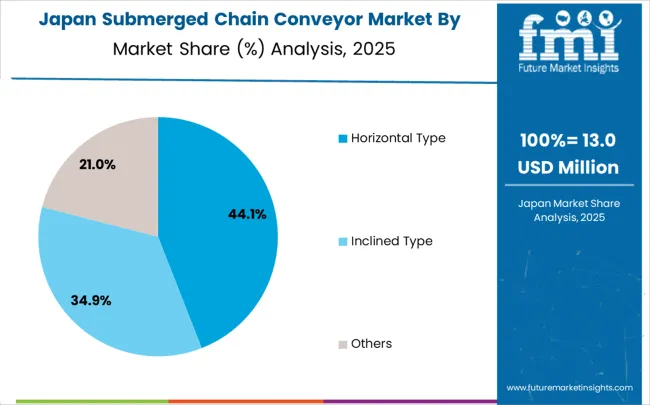
Submerged Chain Conveyor Market Japan Market Share Analysis By Classification

The submerged chain conveyor market in Japan is expected to expand at a CAGR of 4.5% from 2025 to 2035. The country’s heavy industries, including steel and cement production, are key drivers of this demand. Japan’s strong manufacturing base and focus on technological innovation are leading to greater automation and the need for high-performance material handling systems. As the country seeks to improve its industrial efficiency and invest in energy-efficient solutions, submerged chain conveyors are becoming an essential part of industrial infrastructure. The increasing focus on environmental responsible practices and reducing energy consumption is also expected to boost the demand for advanced conveyor systems.
  • Growth driven by heavy industries like steel, cement, and manufacturing
  • Technological innovations in automation and industrial efficiency
  • Rising demand for energy-efficient and conveyor systems

Europe Market Split by Countries

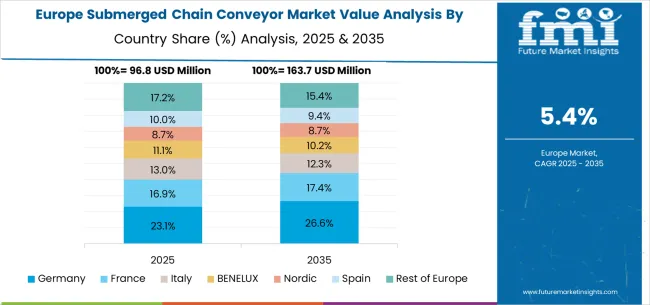
Submerged Chain Conveyor Market Europe Country Market Share Analysis, 2025 & 2035

The submerged chain conveyor market in Europe is projected to grow from USD 148.3 million in 2025 to USD 252.8 million by 2035, registering a CAGR of 5.5% over the forecast period. Germany is expected to maintain its leadership position with a 27.0% market share in 2025, moderating slightly to 26.8% by 2035, supported by its strong power generation sector, advanced material handling technologies, and comprehensive industrial infrastructure serving major European markets.

The United Kingdom follows with 20.0% in 2025, projected to reach 19.8% by 2035, driven by established power sector efficiency focus, comprehensive environmental compliance framework, and advanced facility modernization programs. France holds 18.5% in 2025, rising to 18.7% by 2035, supported by power generation leadership and growing adoption of advanced material handling technologies. Italy commands 14.0% in 2025, projected to reach 14.1% by 2035, while Spain accounts for 9.0% in 2025, expected to reach 9.1% by 2035. The Netherlands maintains a 4.0% share in 2025, growing to 4.1% by 2035. The Rest of Europe region, including Nordic countries, Eastern Europe, and other markets, is anticipated to maintain its position, holding its collective share at 7.5% by 2035, attributed to increasing power infrastructure modernization and growing advanced material handling adoption across emerging energy markets implementing modern conveyor standards.
Competitive Landscape of the Submerged Chain Conveyor Market

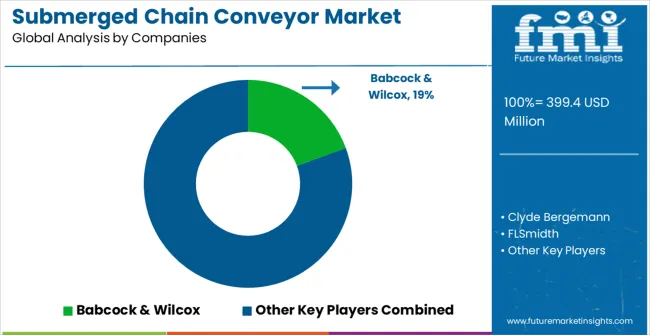
Submerged Chain Conveyor Market Analysis By Company

The submerged chain conveyor market is characterized by competition among established power generation equipment manufacturers, specialized material handling companies, and integrated industrial solution providers. Companies are investing in advanced conveyor technology research, engineering excellence, durability enhancement, and comprehensive product portfolios to deliver reliable, efficient, and durable submerged chain conveyor solutions. Innovation in automation technologies, environmental compliance features, and advanced chain designs is central to strengthening market position and competitive advantage.

Babcock & Wilcox Enterprises, Inc. leads the market with comprehensive power generation solutions, offering advanced submerged chain conveyors with a focus on operational reliability and high-temperature performance across diverse power generation applications. Clyde Bergemann provides specialized power plant equipment with an focus on ash handling systems and material transportation solutions. FLSmidth delivers innovative industrial equipment with a focus on the cement and power industries, with comprehensive material handling capabilities. UCC Environmental specializes in environmental solutions with focus on waste handling and material processing systems. Magaldi Power focuses on specialized conveyor technologies with focus on high-temperature applications and industrial processing. Bevcon Wayors offers comprehensive material handling solutions with a focus on reliability and operational efficiency.

Submerged Chain Conveyor Market - Stakeholder Contribution Framework

Submerged chain conveyors represent a specialized heavy-duty material handling segment within power generation and industrial processing, projected to grow from USD 399.4 million in 2025 to USD 715.2 million by 2035 at a 6.0% CAGR. These robust conveyor systems-primarily horizontal configurations for ash handling-operate in high-temperature environments to transport abrasive materials in thermal power plants, waste incineration facilities, and biomass power generation applications. Market expansion is driven by increasing power generation capacity, growing demand for reliable ash handling systems, expanding waste-to-energy infrastructure, and rising focus on environmental compliance and operational efficiency in challenging industrial environments.

How Power Generation Authorities Could Enhance Infrastructure Standards and Environmental Compliance?

  • Technical Performance Standards: Establish comprehensive specifications for submerged chain conveyor systems including temperature resistance, material handling capacity, durability requirements, and environmental performance standards that ensure reliable operation in power generation facilities.
  • Environmental Compliance Integration: Develop regulatory frameworks linking ash handling system performance to environmental permits, emission control requirements, and waste management protocols that incentivize investment in advanced conveyor technologies for improved environmental outcomes.
  • Power Plant Efficiency Incentives: Create performance-based incentives for power generation facilities that implement advanced material handling systems demonstrating improved operational efficiency, reduced downtime, and enhanced environmental compliance through modern conveyor technology.
  • Safety and Operational Standards: Implement mandatory safety protocols, maintenance requirements, and operational procedures for high-temperature material handling systems that protect worker safety while ensuring reliable power plant operations.
  • Technology Development Support: Provide funding and regulatory support for research and development of next-generation conveyor technologies that improve efficiency, reduce environmental impact, and enhance operational reliability in power generation applications.

How Industrial Engineering Organizations Could Advance Technology Standards and Best Practices?

  • Design and Installation Standards: Develop comprehensive technical guidelines for submerged chain conveyor design, installation procedures, and operational parameters that ensure optimal performance in high-temperature, abrasive material handling applications across different industrial environments.
  • Maintenance and Reliability Protocols: Establish standardized maintenance procedures, inspection schedules, and reliability monitoring systems that maximize conveyor uptime, extend equipment life, and prevent costly operational disruptions in critical industrial processes.
  • Material Handling Optimization: Create application-specific guidelines for conveyor selection, sizing, and configuration that optimize material flow, minimize energy consumption, and ensure reliable performance across diverse industrial processing requirements.
  • Professional Certification Programs: Develop specialized training and certification programs for engineers, technicians, and operators covering conveyor system design, installation, maintenance, and troubleshooting in challenging industrial environments.
  • Performance Benchmarking Systems: Implement industry-wide metrics for conveyor system efficiency, reliability, and environmental performance that enable comparative analysis and drive continuous improvement across industrial facilities.

How Conveyor System Manufacturers Could Drive Innovation and Market Leadership?

  • Advanced Materials and Design: Invest in research and development of heat-resistant materials, improved chain designs, and enhanced cooling systems that enable superior performance in extreme temperature environments while extending equipment lifecycles.
  • Automation and Smart Systems: Develop intelligent conveyor systems with integrated sensors, predictive maintenance capabilities, and automated control systems that optimize performance, reduce maintenance costs, and improve operational reliability.
  • Modular and Scalable Solutions: Engineer flexible conveyor platforms that can be customized for specific applications, easily expanded or modified, and integrated with existing plant infrastructure while maintaining standardized components and interfaces.
  • Environmental Performance Enhancement: Create conveyor systems with improved dust control, reduced emissions, and energy-efficient operation that help facilities meet stringent environmental regulations while maintaining operational effectiveness.
  • Comprehensive Service Support: Establish global service networks providing installation supervision, maintenance programs, spare parts availability, and technical support that ensure optimal conveyor performance throughout operational lifecycles.

How Power Plant Operators Could Optimize Material Handling and Operational Efficiency?

  • Strategic System Planning: Conduct comprehensive assessments of material handling requirements, plant layout constraints, and operational needs to select optimal conveyor configurations that maximize efficiency while minimizing capital and operating costs.
  • Preventive Maintenance Excellence: Implement rigorous maintenance programs including condition monitoring, predictive maintenance techniques, and systematic component replacement that prevent unexpected failures and extend equipment life.
  • Operational Optimization: Utilize advanced control systems, performance monitoring, and data analytics to optimize conveyor operation, reduce energy consumption, and improve overall plant efficiency while maintaining reliable material handling.
  • Environmental Compliance Management: Integrate conveyor performance monitoring with environmental management systems to ensure consistent compliance with emission standards, waste handling regulations, and environmental permits.
  • Technology Modernization: Develop systematic upgrade programs that incorporate new conveyor technologies, automation systems, and performance enhancements while maintaining operational continuity and cost-effectiveness.

How Equipment Integration Partners Could Enable Comprehensive Plant Solutions?

  • System Integration Expertise: Provide comprehensive integration services connecting submerged chain conveyors with plant control systems, material handling equipment, and process monitoring platforms that optimize overall plant performance.
  • Digital Technology Implementation: Develop and implement advanced monitoring systems, predictive analytics platforms, and automation solutions that enhance conveyor performance while providing valuable operational insights and maintenance optimization.
  • Custom Engineering Solutions: Offer specialized engineering services for complex installations, retrofit projects, and performance upgrades that address unique plant requirements while maintaining operational reliability and safety.
  • Performance Optimization Services: Provide ongoing optimization support including system tuning, efficiency improvements, and technology upgrades that maximize conveyor performance and support long-term operational excellence.
  • Training and Knowledge Transfer: Deliver comprehensive training programs for plant personnel covering system operation, maintenance procedures, troubleshooting techniques, and performance optimization specific to integrated conveyor systems.

How Investors and Financial Enablers Could Support Market Development and Infrastructure Growth?

  • Power Infrastructure Investment: Finance development and construction of modern power generation facilities incorporating advanced material handling systems that drive demand for high-performance submerged chain conveyors.
  • Technology Innovation Funding: Support research and development of breakthrough conveyor technologies including advanced materials, intelligent control systems, and environmental performance enhancements that address current market limitations.
  • Manufacturing Capacity Expansion: Provide capital for conveyor manufacturers to expand production capabilities, upgrade manufacturing processes, and develop global service networks that meet growing market demand.
  • Renewable Energy Integration: Finance waste-to-energy facilities, biomass power plants, and other renewable energy projects that require specialized material handling systems and drive market diversification.
  • Emerging Market Development: Support power infrastructure development in emerging economies through financing programs, technology transfer initiatives, and local manufacturing partnerships that expand global market access for advanced conveyor technologies.

Babcock & Wilcox Enterprises, Inc.

  • Clyde Bergemann
  • FLSmidth
  • UCC Environmental
  • Magaldi Power
  • Bevcon Wayors
  • Macawber Beekay
  • Alstom Power / GE (verify correct name)
  • Bootec Materials Handling Equipment
  • Advanced Conveyor Technology
  • SMD Fördertechnik GmbH
  • Loibl Förderanlagen GmbH
  • CICSA
  • RUD India
  • SPIG S.p.A.
  • Saxlund International

Scope of the Report

Items Values
Quantitative Units (2025) USD 399.4 Million
Orientation Horizontal Type, Inclined Type, Others
Application Thermal Power Industry, Waste Incineration Industry, Biomass Power Generation, Others
Regions Covered Asia Pacific, North America, Europe, Latin America, Middle East & Africa
Countries Covered China, India, Germany, Brazil, the United States, the United Kingdom, Japan, and 40+ countries
Key Companies Profiled Babcock & Wilcox Enterprises, Inc., Clyde Bergemann, FLSmidth, UCC Environmental, Magaldi Power, and Bevcon Wayors
Additional Attributes Dollar sales by orientation and application category, regional demand trends, competitive landscape, technological advancements in conveyor systems, automation development, environmental compliance innovation, and operational efficiency optimization

Submerged Chain Conveyor Market by Segments

Orientation:

  • Horizontal Type
  • Inclined Type
  • Others

Application:

  • Thermal Power Industry
  • Waste Incineration Industry
  • Biomass Power Generation
  • Others

Region:

Asia Pacific

  • China
  • India
  • Japan
  • South Korea
  • ASEAN
  • Australia & New Zealand
  • Rest of Asia Pacific

North America

  • United States
  • Canada
  • Mexico

Europe

  • Germany
  • United Kingdom
  • France
  • Italy
  • Spain
  • Nordic
  • BENELUX
  • Rest of Europe

Latin America

  • Brazil
  • Chile
  • Argentina
  • Rest of Latin America

Middle East & Africa

  • Kingdom of Saudi Arabia
  • Other GCC Countries
  • Turkey
  • South Africa
  • Other African Union
  • Rest of Middle East & Africa

Table of Content

  1. Executive Summary
    • Global Market Outlook
    • Demand to side Trends
    • Supply to side Trends
    • Technology Roadmap Analysis
    • Analysis and Recommendations
  2. Market Overview
    • Market Coverage / Taxonomy
    • Market Definition / Scope / Limitations
  3. Market Background
    • Market Dynamics
      • Drivers
      • Restraints
      • Opportunity
      • Trends
    • Scenario Forecast
      • Demand in Optimistic Scenario
      • Demand in Likely Scenario
      • Demand in Conservative Scenario
    • Opportunity Map Analysis
    • Product Life Cycle Analysis
    • Supply Chain Analysis
    • Investment Feasibility Matrix
    • Value Chain Analysis
    • PESTLE and Porter’s Analysis
    • Regulatory Landscape
    • Regional Parent Market Outlook
    • Production and Consumption Statistics
    • Import and Export Statistics
  4. Global Market Analysis 2020 to 2024 and Forecast, 2025 to 2035
    • Historical Market Size Value (USD Million) Analysis, 2020 to 2024
    • Current and Future Market Size Value (USD Million) Projections, 2025 to 2035
      • Y to o to Y Growth Trend Analysis
      • Absolute $ Opportunity Analysis
  5. Global Market Pricing Analysis 2020 to 2024 and Forecast 2025 to 2035
  6. Global Market Analysis 2020 to 2024 and Forecast 2025 to 2035, By Classification
    • Introduction / Key Findings
    • Historical Market Size Value (USD Million) Analysis By Classification , 2020 to 2024
    • Current and Future Market Size Value (USD Million) Analysis and Forecast By Classification , 2025 to 2035
      • Horizontal Type
      • Inclined Type
      • Others
    • Y to o to Y Growth Trend Analysis By Classification , 2020 to 2024
    • Absolute $ Opportunity Analysis By Classification , 2025 to 2035
  7. Global Market Analysis 2020 to 2024 and Forecast 2025 to 2035, By Application
    • Introduction / Key Findings
    • Historical Market Size Value (USD Million) Analysis By Application, 2020 to 2024
    • Current and Future Market Size Value (USD Million) Analysis and Forecast By Application, 2025 to 2035
      • Thermal Power Industry
      • Waste Incineration Industry
      • Biomass Power Generation
      • Others
    • Y to o to Y Growth Trend Analysis By Application, 2020 to 2024
    • Absolute $ Opportunity Analysis By Application, 2025 to 2035
  8. Global Market Analysis 2020 to 2024 and Forecast 2025 to 2035, By Region
    • Introduction
    • Historical Market Size Value (USD Million) Analysis By Region, 2020 to 2024
    • Current Market Size Value (USD Million) Analysis and Forecast By Region, 2025 to 2035
      • North America
      • Latin America
      • Western Europe
      • Eastern Europe
      • East Asia
      • South Asia and Pacific
      • Middle East & Africa
    • Market Attractiveness Analysis By Region
  9. North America Market Analysis 2020 to 2024 and Forecast 2025 to 2035, By Country
    • Historical Market Size Value (USD Million) Trend Analysis By Market Taxonomy, 2020 to 2024
    • Market Size Value (USD Million) Forecast By Market Taxonomy, 2025 to 2035
      • By Country
        • USA
        • Canada
        • Mexico
      • By Classification
      • By Application
    • Market Attractiveness Analysis
      • By Country
      • By Classification
      • By Application
    • Key Takeaways
  10. Latin America Market Analysis 2020 to 2024 and Forecast 2025 to 2035, By Country
    • Historical Market Size Value (USD Million) Trend Analysis By Market Taxonomy, 2020 to 2024
    • Market Size Value (USD Million) Forecast By Market Taxonomy, 2025 to 2035
      • By Country
        • Brazil
        • Chile
        • Rest of Latin America
      • By Classification
      • By Application
    • Market Attractiveness Analysis
      • By Country
      • By Classification
      • By Application
    • Key Takeaways
  11. Western Europe Market Analysis 2020 to 2024 and Forecast 2025 to 2035, By Country
    • Historical Market Size Value (USD Million) Trend Analysis By Market Taxonomy, 2020 to 2024
    • Market Size Value (USD Million) Forecast By Market Taxonomy, 2025 to 2035
      • By Country
        • Germany
        • UK
        • Italy
        • Spain
        • France
        • Nordic
        • BENELUX
        • Rest of Western Europe
      • By Classification
      • By Application
    • Market Attractiveness Analysis
      • By Country
      • By Classification
      • By Application
    • Key Takeaways
  12. Eastern Europe Market Analysis 2020 to 2024 and Forecast 2025 to 2035, By Country
    • Historical Market Size Value (USD Million) Trend Analysis By Market Taxonomy, 2020 to 2024
    • Market Size Value (USD Million) Forecast By Market Taxonomy, 2025 to 2035
      • By Country
        • Russia
        • Poland
        • Hungary
        • Balkan & Baltic
        • Rest of Eastern Europe
      • By Classification
      • By Application
    • Market Attractiveness Analysis
      • By Country
      • By Classification
      • By Application
    • Key Takeaways
  13. East Asia Market Analysis 2020 to 2024 and Forecast 2025 to 2035, By Country
    • Historical Market Size Value (USD Million) Trend Analysis By Market Taxonomy, 2020 to 2024
    • Market Size Value (USD Million) Forecast By Market Taxonomy, 2025 to 2035
      • By Country
        • China
        • Japan
        • South Korea
      • By Classification
      • By Application
    • Market Attractiveness Analysis
      • By Country
      • By Classification
      • By Application
    • Key Takeaways
  14. South Asia and Pacific Market Analysis 2020 to 2024 and Forecast 2025 to 2035, By Country
    • Historical Market Size Value (USD Million) Trend Analysis By Market Taxonomy, 2020 to 2024
    • Market Size Value (USD Million) Forecast By Market Taxonomy, 2025 to 2035
      • By Country
        • India
        • ASEAN
        • Australia & New Zealand
        • Rest of South Asia and Pacific
      • By Classification
      • By Application
    • Market Attractiveness Analysis
      • By Country
      • By Classification
      • By Application
    • Key Takeaways
  15. Middle East & Africa Market Analysis 2020 to 2024 and Forecast 2025 to 2035, By Country
    • Historical Market Size Value (USD Million) Trend Analysis By Market Taxonomy, 2020 to 2024
    • Market Size Value (USD Million) Forecast By Market Taxonomy, 2025 to 2035
      • By Country
        • Kingdom of Saudi Arabia
        • Other GCC Countries
        • Turkiye
        • South Africa
        • Other African Union
        • Rest of Middle East & Africa
      • By Classification
      • By Application
    • Market Attractiveness Analysis
      • By Country
      • By Classification
      • By Application
    • Key Takeaways
  16. Key Countries Market Analysis
    • USA
      • Pricing Analysis
      • Market Share Analysis, 2024
        • By Classification
        • By Application
    • Canada
      • Pricing Analysis
      • Market Share Analysis, 2024
        • By Classification
        • By Application
    • Mexico
      • Pricing Analysis
      • Market Share Analysis, 2024
        • By Classification
        • By Application
    • Brazil
      • Pricing Analysis
      • Market Share Analysis, 2024
        • By Classification
        • By Application
    • Chile
      • Pricing Analysis
      • Market Share Analysis, 2024
        • By Classification
        • By Application
    • Germany
      • Pricing Analysis
      • Market Share Analysis, 2024
        • By Classification
        • By Application
    • UK
      • Pricing Analysis
      • Market Share Analysis, 2024
        • By Classification
        • By Application
    • Italy
      • Pricing Analysis
      • Market Share Analysis, 2024
        • By Classification
        • By Application
    • Spain
      • Pricing Analysis
      • Market Share Analysis, 2024
        • By Classification
        • By Application
    • France
      • Pricing Analysis
      • Market Share Analysis, 2024
        • By Classification
        • By Application
    • India
      • Pricing Analysis
      • Market Share Analysis, 2024
        • By Classification
        • By Application
    • ASEAN
      • Pricing Analysis
      • Market Share Analysis, 2024
        • By Classification
        • By Application
    • Australia & New Zealand
      • Pricing Analysis
      • Market Share Analysis, 2024
        • By Classification
        • By Application
    • China
      • Pricing Analysis
      • Market Share Analysis, 2024
        • By Classification
        • By Application
    • Japan
      • Pricing Analysis
      • Market Share Analysis, 2024
        • By Classification
        • By Application
    • South Korea
      • Pricing Analysis
      • Market Share Analysis, 2024
        • By Classification
        • By Application
    • Russia
      • Pricing Analysis
      • Market Share Analysis, 2024
        • By Classification
        • By Application
    • Poland
      • Pricing Analysis
      • Market Share Analysis, 2024
        • By Classification
        • By Application
    • Hungary
      • Pricing Analysis
      • Market Share Analysis, 2024
        • By Classification
        • By Application
    • Kingdom of Saudi Arabia
      • Pricing Analysis
      • Market Share Analysis, 2024
        • By Classification
        • By Application
    • Turkiye
      • Pricing Analysis
      • Market Share Analysis, 2024
        • By Classification
        • By Application
    • South Africa
      • Pricing Analysis
      • Market Share Analysis, 2024
        • By Classification
        • By Application
  17. Market Structure Analysis
    • Competition Dashboard
    • Competition Benchmarking
    • Market Share Analysis of Top Players
      • By Regional
      • By Classification
      • By Application
  18. Competition Analysis
    • Competition Deep Dive
      • Babcock & Wilcox
        • Overview
        • Product Portfolio
        • Profitability by Market Segments (Product/Age /Sales Channel/Region)
        • Sales Footprint
        • Strategy Overview
          • Marketing Strategy
          • Product Strategy
          • Channel Strategy
      • Clyde Bergemann
      • FLSmidth
      • UCC Environmental
      • Magaldi Power
      • Bevcon Wayors
      • Macawber Beekay
  19. Assumptions & Acronyms Used
  20. Research Methodology

List of Tables

  • Table 1: Global Market Value (USD Million) Forecast by Region, 2020 to 2035
  • Table 2: Global Market Value (USD Million) Forecast by Classification , 2020 to 2035
  • Table 3: Global Market Value (USD Million) Forecast by Application, 2020 to 2035
  • Table 4: North America Market Value (USD Million) Forecast by Country, 2020 to 2035
  • Table 5: North America Market Value (USD Million) Forecast by Classification , 2020 to 2035
  • Table 6: North America Market Value (USD Million) Forecast by Application, 2020 to 2035
  • Table 7: Latin America Market Value (USD Million) Forecast by Country, 2020 to 2035
  • Table 8: Latin America Market Value (USD Million) Forecast by Classification , 2020 to 2035
  • Table 9: Latin America Market Value (USD Million) Forecast by Application, 2020 to 2035
  • Table 10: Western Europe Market Value (USD Million) Forecast by Country, 2020 to 2035
  • Table 11: Western Europe Market Value (USD Million) Forecast by Classification , 2020 to 2035
  • Table 12: Western Europe Market Value (USD Million) Forecast by Application, 2020 to 2035
  • Table 13: Eastern Europe Market Value (USD Million) Forecast by Country, 2020 to 2035
  • Table 14: Eastern Europe Market Value (USD Million) Forecast by Classification , 2020 to 2035
  • Table 15: Eastern Europe Market Value (USD Million) Forecast by Application, 2020 to 2035
  • Table 16: East Asia Market Value (USD Million) Forecast by Country, 2020 to 2035
  • Table 17: East Asia Market Value (USD Million) Forecast by Classification , 2020 to 2035
  • Table 18: East Asia Market Value (USD Million) Forecast by Application, 2020 to 2035
  • Table 19: South Asia and Pacific Market Value (USD Million) Forecast by Country, 2020 to 2035
  • Table 20: South Asia and Pacific Market Value (USD Million) Forecast by Classification , 2020 to 2035
  • Table 21: South Asia and Pacific Market Value (USD Million) Forecast by Application, 2020 to 2035
  • Table 22: Middle East & Africa Market Value (USD Million) Forecast by Country, 2020 to 2035
  • Table 23: Middle East & Africa Market Value (USD Million) Forecast by Classification , 2020 to 2035
  • Table 24: Middle East & Africa Market Value (USD Million) Forecast by Application, 2020 to 2035

List of Figures

  • Figure 1: Global Market Pricing Analysis
  • Figure 2: Global Market Value (USD Million) Forecast 2020-2035
  • Figure 3: Global Market Value Share and BPS Analysis by Classification , 2025 and 2035
  • Figure 4: Global Market Y to o to Y Growth Comparison by Classification , 2025-2035
  • Figure 5: Global Market Attractiveness Analysis by Classification
  • Figure 6: Global Market Value Share and BPS Analysis by Application, 2025 and 2035
  • Figure 7: Global Market Y to o to Y Growth Comparison by Application, 2025-2035
  • Figure 8: Global Market Attractiveness Analysis by Application
  • Figure 9: Global Market Value (USD Million) Share and BPS Analysis by Region, 2025 and 2035
  • Figure 10: Global Market Y to o to Y Growth Comparison by Region, 2025-2035
  • Figure 11: Global Market Attractiveness Analysis by Region
  • Figure 12: North America Market Incremental Dollar Opportunity, 2025-2035
  • Figure 13: Latin America Market Incremental Dollar Opportunity, 2025-2035
  • Figure 14: Western Europe Market Incremental Dollar Opportunity, 2025-2035
  • Figure 15: Eastern Europe Market Incremental Dollar Opportunity, 2025-2035
  • Figure 16: East Asia Market Incremental Dollar Opportunity, 2025-2035
  • Figure 17: South Asia and Pacific Market Incremental Dollar Opportunity, 2025-2035
  • Figure 18: Middle East & Africa Market Incremental Dollar Opportunity, 2025-2035
  • Figure 19: North America Market Value Share and BPS Analysis by Country, 2025 and 2035
  • Figure 20: North America Market Value Share and BPS Analysis by Classification , 2025 and 2035
  • Figure 21: North America Market Y to o to Y Growth Comparison by Classification , 2025-2035
  • Figure 22: North America Market Attractiveness Analysis by Classification
  • Figure 23: North America Market Value Share and BPS Analysis by Application, 2025 and 2035
  • Figure 24: North America Market Y to o to Y Growth Comparison by Application, 2025-2035
  • Figure 25: North America Market Attractiveness Analysis by Application
  • Figure 26: Latin America Market Value Share and BPS Analysis by Country, 2025 and 2035
  • Figure 27: Latin America Market Value Share and BPS Analysis by Classification , 2025 and 2035
  • Figure 28: Latin America Market Y to o to Y Growth Comparison by Classification , 2025-2035
  • Figure 29: Latin America Market Attractiveness Analysis by Classification
  • Figure 30: Latin America Market Value Share and BPS Analysis by Application, 2025 and 2035
  • Figure 31: Latin America Market Y to o to Y Growth Comparison by Application, 2025-2035
  • Figure 32: Latin America Market Attractiveness Analysis by Application
  • Figure 33: Western Europe Market Value Share and BPS Analysis by Country, 2025 and 2035
  • Figure 34: Western Europe Market Value Share and BPS Analysis by Classification , 2025 and 2035
  • Figure 35: Western Europe Market Y to o to Y Growth Comparison by Classification , 2025-2035
  • Figure 36: Western Europe Market Attractiveness Analysis by Classification
  • Figure 37: Western Europe Market Value Share and BPS Analysis by Application, 2025 and 2035
  • Figure 38: Western Europe Market Y to o to Y Growth Comparison by Application, 2025-2035
  • Figure 39: Western Europe Market Attractiveness Analysis by Application
  • Figure 40: Eastern Europe Market Value Share and BPS Analysis by Country, 2025 and 2035
  • Figure 41: Eastern Europe Market Value Share and BPS Analysis by Classification , 2025 and 2035
  • Figure 42: Eastern Europe Market Y to o to Y Growth Comparison by Classification , 2025-2035
  • Figure 43: Eastern Europe Market Attractiveness Analysis by Classification
  • Figure 44: Eastern Europe Market Value Share and BPS Analysis by Application, 2025 and 2035
  • Figure 45: Eastern Europe Market Y to o to Y Growth Comparison by Application, 2025-2035
  • Figure 46: Eastern Europe Market Attractiveness Analysis by Application
  • Figure 47: East Asia Market Value Share and BPS Analysis by Country, 2025 and 2035
  • Figure 48: East Asia Market Value Share and BPS Analysis by Classification , 2025 and 2035
  • Figure 49: East Asia Market Y to o to Y Growth Comparison by Classification , 2025-2035
  • Figure 50: East Asia Market Attractiveness Analysis by Classification
  • Figure 51: East Asia Market Value Share and BPS Analysis by Application, 2025 and 2035
  • Figure 52: East Asia Market Y to o to Y Growth Comparison by Application, 2025-2035
  • Figure 53: East Asia Market Attractiveness Analysis by Application
  • Figure 54: South Asia and Pacific Market Value Share and BPS Analysis by Country, 2025 and 2035
  • Figure 55: South Asia and Pacific Market Value Share and BPS Analysis by Classification , 2025 and 2035
  • Figure 56: South Asia and Pacific Market Y to o to Y Growth Comparison by Classification , 2025-2035
  • Figure 57: South Asia and Pacific Market Attractiveness Analysis by Classification
  • Figure 58: South Asia and Pacific Market Value Share and BPS Analysis by Application, 2025 and 2035
  • Figure 59: South Asia and Pacific Market Y to o to Y Growth Comparison by Application, 2025-2035
  • Figure 60: South Asia and Pacific Market Attractiveness Analysis by Application
  • Figure 61: Middle East & Africa Market Value Share and BPS Analysis by Country, 2025 and 2035
  • Figure 62: Middle East & Africa Market Value Share and BPS Analysis by Classification , 2025 and 2035
  • Figure 63: Middle East & Africa Market Y to o to Y Growth Comparison by Classification , 2025-2035
  • Figure 64: Middle East & Africa Market Attractiveness Analysis by Classification
  • Figure 65: Middle East & Africa Market Value Share and BPS Analysis by Application, 2025 and 2035
  • Figure 66: Middle East & Africa Market Y to o to Y Growth Comparison by Application, 2025-2035
  • Figure 67: Middle East & Africa Market Attractiveness Analysis by Application
  • Figure 68: Global Market - Tier Structure Analysis
  • Figure 69: Global Market - Company Share Analysis

Frequently Asked Questions

How big is the submerged chain conveyor market in 2025?

The global submerged chain conveyor market is estimated to be valued at USD 399.4 million in 2025.

What will be the size of submerged chain conveyor market in 2035?

The market size for the submerged chain conveyor market is projected to reach USD 715.2 million by 2035.

How much will be the submerged chain conveyor market growth between 2025 and 2035?

The submerged chain conveyor market is expected to grow at a 6.0% CAGR between 2025 and 2035.

What are the key product types in the submerged chain conveyor market?

The key product types in submerged chain conveyor market are horizontal type, inclined type and others.

Which application segment to contribute significant share in the submerged chain conveyor market in 2025?

In terms of application, thermal power industry segment to command 40.0% share in the submerged chain conveyor market in 2025.

Explore Similar Insights

Future Market Insights

Submerged Chain Conveyor Market

Chat With MaRIA

Chat With

MaRIA

Hi There, I am MaRIA, Your Market Research Intelligence Assistant. How may I help you?