Submerged Drag Chain Conveyor Market Forecast and Outlook (2025-2035)

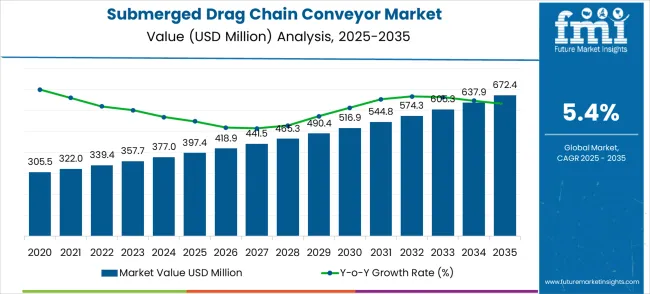
The submerged drag chain conveyor market is valued at USD 397.4 million in 2025 and is forecasted to reach USD 672.4 million by 2035, growing at a CAGR of 5.4%. The market growth curve initially follows a steady and incremental pattern, with gradual annual increases from USD 305.5 million in 2021 to USD 397.4 million in 2025. Values progress through USD 322.0 million in 2022, USD 339.4 million in 2023, USD 357.7 million in 2024, and USD 377.0 million in 2025, reflecting moderate and consistent adoption of drag chain conveyors in industries like cement, power, and mining.
Quick Stats for Submerged Drag Chain Conveyor Market

  • Submerged Drag Chain Conveyor Market Value (2025): USD 397.4 million
  • Submerged Drag Chain Conveyor Market Forecast Value (2035): USD 672.4 million
  • Submerged Drag Chain Conveyor Market Forecast CAGR: 5.4%
  • Leading Orientation in Submerged Drag Chain Conveyor Market: Horizontal Type
  • Key Growth Regions in Submerged Drag Chain Conveyor Market: Asia Pacific, North America, and Europe
  • Key Players in Submerged Drag Chain Conveyor Market: Babcock & Wilcox Enterprises, Inc., Clyde Bergemann, FLSmidth, UCC Environmental, Magaldi Power, Bevcon Wayors

Submerged Drag Chain Conveyor Market Market Value Analysis

From 2026 to 2030, the market curve starts to accelerate, moving from USD 397.4 million in 2025 to USD 490.4 million by 2030. This growth phase is marked by slightly steeper annual increments, with intermediate values passing through USD 418.9 million in 2026, USD 441.5 million in 2027, and USD 465.3 million in 2028. The market curve shows signs of expansion as industries increasingly adopt automation, improving material handling processes and promoting the growth of submerged drag chain conveyors. The latter half of the curve, from 2031 to 2035, continues with an upward slope, reaching USD 672.4 million, driven by technological innovations, rising industrial output, and an increased need for reliable, efficient conveyor systems.

Submerged Drag Chain Conveyor Market Key Takeaways

Metric Value
Estimated Value in (2025E) USD 397.4 million
Forecast Value in (2035F) USD 672.4 million
Forecast CAGR (2025 to 2035) 5.4%

The material handling equipment market is the largest contributor, accounting for approximately 35-40% of the market share. Submerged drag chain conveyors are used for the efficient transportation of bulk materials in industries such as cement, steel, and waste-to-energy, making this parent market essential for driving demand. The waste management and recycling market plays a significant role, contributing around 20-25%, as these conveyors are widely employed in handling ash, slag, and other by-products in waste incineration plants and recycling facilities. The steel manufacturing market accounts for about 15-20%, with submerged drag chain conveyors being used to transport hot and abrasive materials like slag in steel plants, ensuring smooth material flow during production.

The mining and minerals processing market contributes around 10-12%, as these conveyors are utilized in mining operations to transport minerals, ores, and other heavy materials efficiently. The power generation market accounts for approximately 10-12%, as submerged drag chain conveyors are crucial in coal-fired power plants and waste-to-energy facilities for transporting ash and other waste materials.

Why is the Submerged Drag Chain Conveyor Market Growing?

Market expansion is being supported by the increasing global demand for reliable power generation infrastructure and the corresponding need for robust material handling systems that can operate in high-temperature environments, ensure continuous material transportation, and maintain operational efficiency across various thermal power, waste incineration, and biomass processing applications. Modern power plant operators and industrial facility managers are increasingly focused on implementing conveying solutions that can handle abrasive materials, withstand extreme temperatures, and provide consistent performance in demanding operating conditions. Submerged drag chain conveyors' proven ability to deliver reliable material handling, operate in harsh environments, and support continuous plant operations makes them essential equipment for contemporary power generation and industrial processing facilities.

The growing focus on environmental compliance and operational efficiency is driving demand for submerged drag chain conveyors that can support effective material handling, ensure reliable transportation, and enable comprehensive ecological control. Power generation facilities' preference for material handling systems that combine durability with operational reliability and maintenance efficiency is creating opportunities for innovative submerged drag chain conveyor implementations. The rising influence of renewable energy integration and waste-to-energy technologies is also contributing to increased adoption of submerged drag chain conveyors that can provide reliable material handling without compromising operational efficiency or environmental performance.

Segmental Analysis

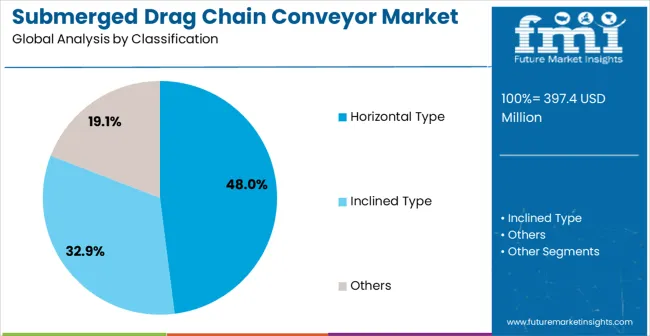
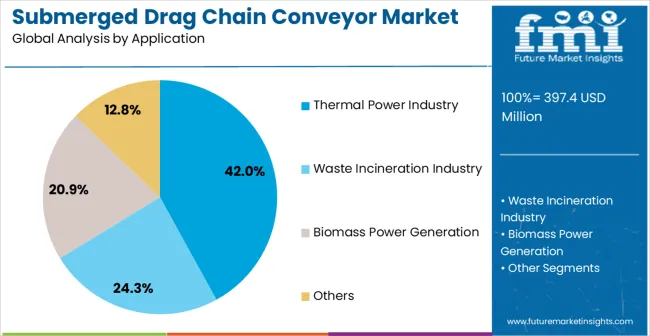
The market is segmented by orientation, application, and region. By orientation, the market is divided into horizontal type, inclined type, and others. Based on application, the market is categorized into the thermal power industry, the waste incineration industry, biomass power generation, and others. Regionally, the market is divided into Asia Pacific, North America, Europe, Latin America, and the Middle East & Africa.
By Orientation, the Horizontal Type Segment Leads the Market with 48% Share

Submerged Drag Chain Conveyor Market Analysis By Classification

The horizontal type segment is projected to maintain its leading position in the submerged drag chain conveyor market in 2025, capturing 48% of the total market share. This position is reinforced by its role as the preferred configuration for level material transportation and handling in power plants and industrial facilities. Horizontal submerged drag chain conveyors are favored for their easy installation, reliable material flow, and adaptability to different plant layouts. Their proven effectiveness and operational simplicity address the industrial need for efficient material transportation, ensuring consistent performance across diverse power generation and processing applications. As plant operators and maintenance teams continue to invest in these systems, horizontal conveyors remain a cornerstone in material handling strategies.
  • Widely used in coal and gas-fired power plants for efficient material handling at various operational levels.
  • Known for minimal maintenance requirements, reducing operational downtime in large-scale facilities.
  • Highly adaptable for different industrial applications, making it a versatile choice across various manufacturing sectors.

By Application, the Thermal Power Industry Segment Dominates Market Demand with 42% Share

Submerged Drag Chain Conveyor Market Analysis By Application

The thermal power industry application segment is expected to represent 42% of the submerged drag chain conveyor market share in 2025. The demand for these conveyors in thermal power plants is driven by their ability to withstand high-temperature environments while maintaining reliable material handling capabilities. Thermal power plants, including coal-fired, gas-fired, and combined-cycle facilities, rely on submerged drag chain conveyors for continuous and efficient material transport. These conveyors not only support plant efficiency but also contribute to meeting environmental compliance standards. As power generation becomes more efficient, and with the increasing focus on regulatory compliance, the thermal power industry will remain a significant driver of market demand for these systems.

  • Essential for continuous ash handling in thermal power plants, ensuring operational efficiency and compliance with environmental regulations.
  • Designed to handle high-temperature and abrasive materials, crucial for maintaining plant operations.
  • Increasing investments in advanced technologies to support the growing demand for efficient power generation.

What are the Drivers, Restraints, and Key Trends of the Submerged Drag Chain Conveyor Market?

The submerged drag chain conveyor market is advancing steadily due to increasing demand for reliable power generation infrastructure and growing adoption of specialized material handling technologies that provide enhanced operational efficiency and environmental compliance across diverse power generation and industrial processing applications. The market faces challenges, including high capital investment costs and installation complexity, maintenance requirements in harsh operating environments, and competition from alternative material handling technologies and conveyor systems. Innovation in automation technologies and remote monitoring systems continues to influence product development and market expansion patterns.

Expansion of Advanced Automation Technologies and Remote Monitoring Systems

The growing adoption of intelligent automation and remote monitoring technologies is enabling power plant operators to achieve superior operational control, predictive maintenance capabilities, and comprehensive system monitoring for enhanced facility management. Advanced automation systems provide improved operational efficiency while allowing more proactive maintenance scheduling and consistent performance monitoring across various conveyor installations and operating conditions. Manufacturers are increasingly recognizing the competitive advantages of automation integration for operational differentiation and facility optimization.

Integration of Environmental Compliance and Energy Solutions

Modern submerged drag chain conveyor manufacturers are incorporating environmental compliance features and energy integration to enhance operational performance, reduce environmental impact, and support comprehensive facility environmental management through optimized material handling and emission control systems. These technologies improve ecological performance while enabling new applications, including waste-to-energy integration and circular economy implementation. Advanced environmental integration also allows facilities to support comprehensive environmental compliance beyond traditional material handling approaches.
Analysis of the Submerged Drag Chain Conveyor Market by Key Countries

Submerged Drag Chain Conveyor Market Cagr Analysis By Country

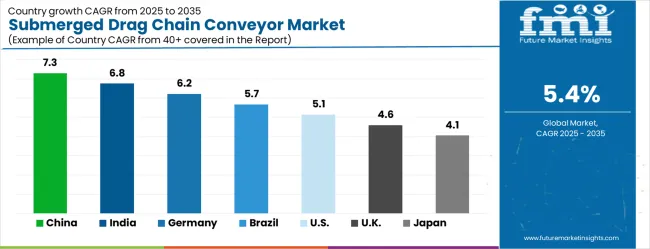
Country CAGR (2025-2035)
China 7.3%
India 6.8%
Germany 6.2%
Brazil 5.7%
USA 5.1%
UK 4.6%
Japan 4.1%

The submerged drag chain conveyor market is experiencing solid growth globally, with China leading at a 7.3% CAGR through 2035, driven by the expanding power generation infrastructure, growing industrial capacity, and significant investment in thermal power plants and waste-to-energy facilities development. India follows at 6.8%, supported by rapid power sector growth, increasing industrial development, and growing adoption of advanced material handling systems in thermal power generation. Germany shows growth at 6.2%, emphasizing advanced engineering and precision conveyor technology development. Brazil records 5.7%, focusing on power infrastructure expansion and industrial modernization initiatives. The USA demonstrates 5.1% growth, supported by established power generation infrastructure and focus on facility modernization. The UK exhibits 4.6% growth, emphasizing power sector efficiency and environmental compliance technologies. Japan shows 4.1% growth, supported by advanced power generation technologies and precision material handling systems.

The report covers an in-depth analysis of 40+ countries withtop-performing countries highlighted below.

In-depth Analysis of Submerged Drag Chain Conveyor Market in China

The submerged drag chain conveyor market in China is expected to grow at a CAGR of 7.3% from 2025 to 2035. The country’s industrial sectors, including steel, mining, and power generation, are the primary drivers of this demand. As China continues to invest in modernizing its industrial infrastructure, the need for efficient material handling systems like submerged drag chain conveyors is rising. Additionally, the growth of China’s manufacturing base and its focus on improving production efficiency is boosting demand. The demand for these conveyors is also linked to China’s expanding power generation capacity, particularly in coal-fired plants, where material handling systems are essential. China’s commitment to developing smart factories and incorporating automation in production processes will further support the market for advanced conveyor solutions.

  • Increasing demand from steel, mining, and power sectors
  • Growing focus on industrial automation and production efficiency
  • Expansion of coal-fired power plants fueling demand

Sales Analysis of Submerged Drag Chain Conveyor Market in India

India is witnessing steady growth in the submerged drag chain conveyor market, with a projected CAGR of 6.8% from 2025 to 2035. The country’s rapidly expanding industrial base, especially in the steel, cement, and energy sectors, is driving demand for efficient conveyor systems. As India focuses on improving manufacturing infrastructure and increasing its energy production capacity, the need for material handling systems, such as submerged drag chain conveyors, is becoming more prominent. India’s increasing adoption of automation and smart technologies in industrial operations is contributing to the market growth. The growing number of power generation projects and large-scale manufacturing plants across the country is expected to significantly enhance demand.

  • Expansion of the steel, cement, and power generation sectors
  • Adoption of automation and smart technologies in manufacturing
  • Growing infrastructure projects and power plant construction

Growth Analysis of Submerged Drag Chain Conveyor Market in Germany

The submerged drag chain conveyor market in Germany is anticipated to grow at a CAGR of 6.2% from 2025 to 2035. The country’s strong industrial base, particularly in automotive, steel, and cement production, is fueling the demand for advanced material handling systems. Germany’s commitment to maintaining its manufacturing leadership through technological innovation is supporting the need for efficient conveyors that improve production flow and reduce downtime. Germany’s energy sector, particularly in power plants, continues to grow, creating a significant demand for material handling systems in industrial plants. The country is also focusing on incorporating Industry 4.0 solutions, making submerged drag chain conveyors an essential component of the modernization of manufacturing operations.

  • Demand driven by steel, automotive, and cement industries
  • Focus on technological innovation and automation in manufacturing>
  • Growing energy sector and power plant construction

Opportunity Analysis of Submerged Drag Chain Conveyor Market in Brazil

The submerged drag chain conveyor market in Brazil is expected to grow at a CAGR of 5.7% from 2025 to 2035. As one of the largest industrial economies in South America, Brazil is heavily investing in infrastructure, especially in steel, mining, and power generation. The growth of Brazil’s mining industry, coupled with the demand for efficient material handling systems in its cement and steel sectors, is driving the market. The increasing number of power generation projects, particularly in renewable and thermal power, further boosts the demand for reliable and efficient conveyor systems. Brazil’s push to modernize its industrial capabilities through automation is also contributing to the demand for submerged drag chain conveyors.
  • Expansion of the steel, cement, and mining industries
  • Growing infrastructure investments in energy and manufacturing
  • Focus on automation and modernization of industrial plants

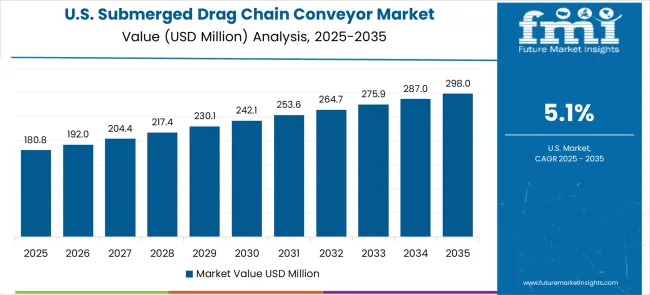
Demand Outlook for Submerged Drag Chain Conveyor Market in the United States

Submerged Drag Chain Conveyor Market Country Value Analysis

The United States is expected to grow at a CAGR of 5.1% in the submerged drag chain conveyor market from 2025 to 2035. The USA industrial sectors, including steel, cement, and power generation, remain key drivers of demand. With a focus on modernizing infrastructure and expanding energy production, the need for efficient material handling systems is increasing. The United States is also focusing on adopting advanced technologies such as smart sensors, automation, and real-time monitoring systems to improve operational efficiency in industrial settings. The shift toward cleaner energy sources, including nuclear and renewables, is also fueling demand for efficient conveyors in power generation plants.

  • Growth driven by steel, cement, and power generation sectors
  • Adoption of automation and real-time monitoring technologies
  • Demand from both traditional and renewable power generation plants

Submerged Drag Chain Conveyor Market Adoption Trends in the United Kingdom

The United Kingdom’s submerged drag chain conveyor market is projected to grow at a CAGR of 4.6% from 2025 to 2035. The UK’s focus on modernizing its manufacturing sector, particularly in steel production, cement, and automotive industries, is driving the demand for advanced material handling systems. As the country continues to invest in renewable energy and infrastructure projects, the need for efficient conveyors in power plants and large-scale manufacturing facilities is growing.The UK’s commitment to automating industrial operations and enhancing energy efficiency will boost the demand for submerged drag chain conveyors.
  • Demand driven by manufacturing sectors like steel, cement, and automotive
  • Focus on renewable energy and infrastructure projects
  • Increased focus on automation and energy-efficient systems

Submerged Drag Chain Conveyor Market Outlook in Japan

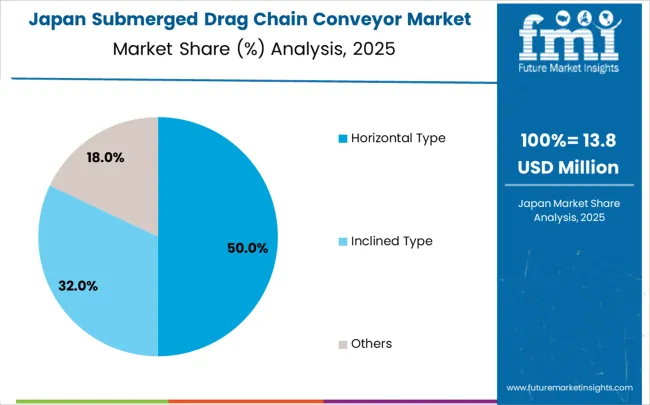
Submerged Drag Chain Conveyor Market Japan Market Share Analysis By Classification

The submerged drag chain conveyor market in Japan is expected to grow at a CAGR of 4.1% from 2025 to 2035. Japan’s industrial sectors, including automotive, steel, and power generation, continue to be major contributors to market growth. With the country’s focus on technological innovation, automation, and energy-efficient manufacturing systems, the demand for advanced material handling solutions is increasing. Japan’s focus on modernizing its power generation plants, particularly in the context of clean energy, further supports the market for submerged drag chain conveyors. The government’s infrastructure investments in both industrial and energy sectors will likely drive continued growth.
  • Demand from automotive, steel, and power generation industries
  • Focus on technological innovation and energy-efficient solutions
  • Increased infrastructure investments in industrial and energy sectors

Europe Market Split by Countries

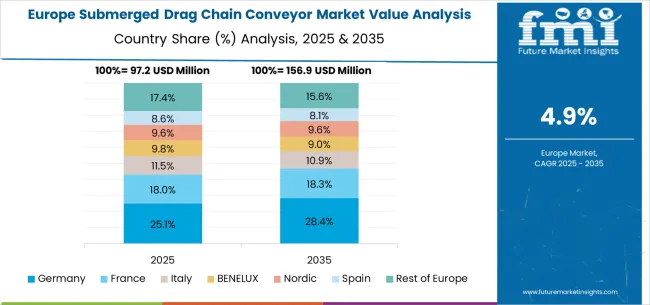
Submerged Drag Chain Conveyor Market Europe Country Market Share Analysis, 2025 & 2035

The submerged drag chain conveyor market in Europe is projected to grow from USD 141.9 million in 2025 to USD 229.4 million by 2035, registering a CAGR of 4.9% over the forecast period. Germany is expected to maintain its leadership position with a 27.5% market share in 2025, moderating slightly to 27.3% by 2035, supported by its strong power generation sector, advanced material handling technologies, and comprehensive industrial infrastructure serving major European markets.

The United Kingdom follows with 20.5% in 2025, projected to reach 20.3% by 2035, driven by established power sector efficiency focus, comprehensive environmental compliance framework, and advanced facility modernization programs. France holds 18.0% in 2025, rising to 18.2% by 2035, supported by power generation leadership and growing adoption of advanced material handling technologies. Italy commands 14.0% in 2025, projected to reach 14.1% by 2035, while Spain accounts for 9.0% in 2025, expected to reach 9.1% by 2035. The Netherlands maintains a 4.0% share in 2025, growing to 4.1% by 2035. The Rest of Europe region, including Nordic countries, Eastern Europe, and other markets, is anticipated to maintain its position, holding its collective share at 7.0% by 2035, attributed to increasing power infrastructure modernization and growing advanced material handling adoption across emerging energy markets implementing modern conveyor standards.
Competitive Landscape of the Submerged Drag Chain Conveyor Market

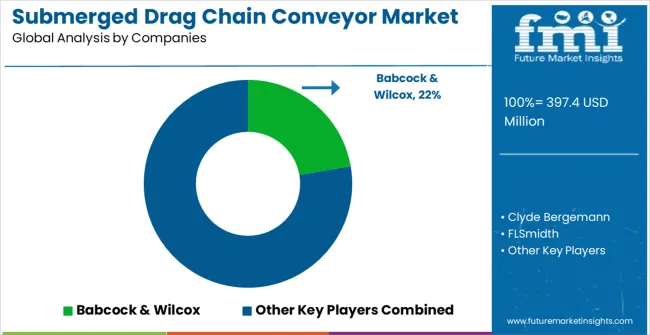
Submerged Drag Chain Conveyor Market Analysis By Company

The submerged drag chain conveyor market is characterized by competition among established power generation equipment manufacturers, specialized material handling companies, and integrated industrial solution providers. Companies are investing in advanced conveyor technology research, engineering excellence, durability enhancement, and comprehensive product portfolios to deliver reliable, efficient, and durable submerged drag chain conveyor solutions. Innovation in automation technologies, environmental compliance features, and advanced chain designs is central to strengthening market position and competitive advantage.

Babcock & Wilcox Enterprises, Inc. leads the market with comprehensive power generation solutions, offering advanced submerged drag chain conveyors with a focus on operational reliability and high-temperature performance across diverse power generation applications. Clyde Bergemann provides specialized power plant equipment with an focus on material handling systems and transportation solutions. FLSmidth delivers innovative industrial equipment with a focus on the cement and power industries, with comprehensive material handling capabilities. UCC Environmental specializes in environmental solutions with focus on waste handling and material processing systems. Magaldi Power focuses on specialized conveyor technologies with focus on high-temperature applications and industrial processing. Bevcon Wayors offers comprehensive material handling solutions with a focus on reliability and operational efficiency.

Submerged Drag Chain Conveyor Market - Stakeholder Contribution Framework

Submerged drag chain conveyors represent a specialized heavy-duty material handling segment within power generation and industrial processing, projected to grow from USD 397.4 million in 2025 to USD 672.4 million by 2035 at a 5.4% CAGR. These robust drag conveyor systems—primarily horizontal configurations for continuous material transport—operate submerged in cooling water to handle hot, abrasive materials like ash and clinker in thermal power plants, waste incineration facilities, and biomass power generation applications. Market expansion is driven by increasing power generation capacity, growing focus on reliable ash handling systems, expanding waste-to-energy infrastructure, and rising demand for environmental compliance solutions in high-temperature industrial environments.

How Energy Sector Regulators Could Strengthen Infrastructure Resilience and Environmental Standards?

  • Ash Handling System Standards: Establish comprehensive technical specifications for submerged drag chain conveyors, including material handling capacity, temperature resistance, environmental sealing requirements, and operational reliability standards that ensure consistent performance in power generation facilities.
  • Environmental Compliance Integration: Develop regulatory frameworks that link ash handling system efficiency to environmental permits, requiring advanced conveyor technologies that minimize dust emissions, prevent water contamination, and support overall plant ecological performance objectives.
  • Power Plant Reliability Requirements: Implement mandatory reliability standards for critical material handling systems, including backup capabilities, maintenance protocols, and performance monitoring that ensure continuous power generation operations and grid stability.
  • Waste-to-Energy Facility Standards: Create specialized guidelines for drag chain conveyors in waste incineration and biomass power facilities, addressing unique material characteristics, corrosion resistance, and environmental protection requirements specific to these applications.
  • Technology Development Incentives: Provide regulatory support and financial incentives for research and development of next-generation conveyor technologies that improve operational efficiency, reduce environmental impact, and enhance system reliability in power generation applications.

How Power Industry Associations Could Advance Technology Standards and Operational Excellence?

  • Material Handling Best Practices: Develop comprehensive technical guidelines for drag chain conveyor selection, installation, and operation that optimize material flow, minimize downtime, and ensure reliable performance across different power generation technologies and fuel types.
  • Maintenance and Reliability Protocols: Establish standardized maintenance procedures, inspection schedules, and condition monitoring systems specifically designed for submerged drag chain conveyors operating in harsh power plant environments with high temperatures and abrasive materials.
  • Performance Benchmarking Systems: Create industry-wide metrics for conveyor system efficiency, reliability, and environmental performance that enable comparative analysis, identify best practices, and drive continuous improvement across power generation facilities.
  • Professional Training and Certification: Develop specialized training programs for power plant operators, maintenance technicians, and engineers covering drag chain conveyor operation, troubleshooting, and optimization in high-temperature material handling applications.
  • Technology Innovation Partnerships: Facilitate collaboration between power plant operators, equipment manufacturers, and research institutions to advance conveyor technology development and address emerging challenges in power generation and environmental compliance.

How Conveyor System Manufacturers Could Drive Innovation and Competitive Advantage?

  • Advanced Materials Engineering: Invest in research and development of heat-resistant alloys, wear-resistant coatings, and corrosion-resistant materials that enable superior performance in extreme temperature and corrosive environments while extending equipment lifecycles.
  • Intelligent System Integration: Develop smart conveyor systems with integrated sensors, predictive maintenance capabilities, and automated control systems that optimize performance, reduce maintenance costs, and prevent unexpected failures in critical power plant operations.
  • Modular Design Solutions: Engineer flexible conveyor platforms with standardized components, modular configurations, and scalable designs that enable customization for specific applications while reducing manufacturing costs and simplifying maintenance procedures.
  • Environmental Performance Enhancement: Create conveyor systems with improved sealing technologies, dust control features, and water treatment integration that help power plants meet stringent environmental regulations while maintaining operational efficiency.
  • Global Service Excellence: Establish comprehensive service networks providing installation support, maintenance programs, spare parts availability, and technical expertise that ensure optimal conveyor performance throughout extended operational lifecycles in demanding power plant environments.

How Power Plant Operators Could Optimize Material Handling and Plant Efficiency?

  • Strategic System Integration: Conduct comprehensive assessments of material flow requirements, plant layout constraints, and operational needs to optimize drag chain conveyor integration with existing power plant infrastructure while maximizing efficiency and minimizing capital costs.
  • Advanced Maintenance Management: Implement condition-based maintenance programs utilizing vibration monitoring, thermal imaging, and wear analysis to optimize maintenance schedules, prevent unplanned outages, and extend conveyor system lifecycles.
  • Operational Performance Optimization: Utilize advanced control systems, real-time monitoring, and data analytics to optimize conveyor operation, reduce energy consumption, and improve overall plant efficiency while maintaining reliable material handling capabilities.
  • Environmental Compliance Excellence: Integrate conveyor performance monitoring with environmental management systems to ensure consistent compliance with emission standards, water quality regulations, and waste handling requirements while optimizing operational costs.
  • Technology Modernization Planning: Develop systematic upgrade strategies that incorporate new conveyor technologies, automation systems, and efficiency improvements while maintaining operational continuity and managing capital expenditures effectively.

How Industrial Engineering Consultants Could Enable System Optimization?

  • Comprehensive System Design: Provide specialized engineering services for drag chain conveyor system design, integration planning, and performance optimization that address unique plant requirements, material characteristics, and operational constraints.
  • Performance Analysis and Optimization: Conduct detailed assessments of existing conveyor systems, identify improvement opportunities, and develop optimization strategies that enhance efficiency, reduce costs, and improve reliability in power plant operations.
  • Technology Integration Services: Offer expertise in integrating drag chain conveyors with plant control systems, environmental monitoring equipment, and automation platforms that optimize overall plant performance and operational efficiency.
  • Regulatory Compliance Support: Provide specialized knowledge of environmental regulations, safety standards, and industry requirements to ensure conveyor system designs and modifications meet all applicable regulatory requirements and performance standards.
  • Lifecycle Cost Analysis: Develop comprehensive economic models that evaluate the total cost of ownership, including capital costs, operating expenses, maintenance requirements, and environmental compliance costs to support informed decision-making.

How Investors and Financial Enablers Could Support Market Growth and Infrastructure Development?

  • Power Infrastructure Financing: Provide capital for new power plant construction, facility upgrades, and infrastructure modernization projects that drive demand for advanced material handling systems and support market expansion globally.
  • Technology Development Investment: Finance research and development of breakthrough conveyor technologies, including advanced materials, intelligent control systems, and environmental performance enhancements that address current market limitations and emerging requirements.
  • Manufacturing Capability Expansion: Support conveyor manufacturers in expanding production capacity, developing global service networks, and establishing regional manufacturing facilities that meet growing demand while reducing costs and delivery times.
  • Energy Project Financing: Fund waste-to-energy facilities, biomass power plants, and renewable energy projects that require specialized material handling systems and contribute to market diversification and growth
  • Emerging Market Development: Provide financing and technical assistance for power infrastructure development in emerging economies, creating new markets for advanced conveyor technologies while supporting global energy access and economic development initiatives.

Key Players in the Submerged Drag Chain Conveyor Market

  • Babcock & Wilcox Enterprises, Inc.
  • Clyde Bergemann
  • FLSmidth
  • UCC Environmental
  • Magaldi Power
  • Bevcon Wayors
  • Macawber Beekay
  • Alstom Power (GE)
  • Bootec Materials Handling Equipment
  • Advanced Conveyor Technology
  • SMD Fördertechnik GmbH
  • Loibl Förderanlagen GmbH
  • CICSA
  • RUD India

Scope of the Report

Items Values
Quantitative Units (2025) USD 397.4 million
Orientation Horizontal Type, Inclined Type, Others
Application Thermal Power Industry, Waste Incineration Industry, Biomass Power Generation, Others
Regions Covered Asia Pacific, North America, Europe, Latin America, Middle East & Africa
Countries Covered China, India, Germany, Brazil, the United States, the United Kingdom, Japan, and 40+ countries
Key Companies Profiled Babcock & Wilcox Enterprises, Inc., Clyde Bergemann, FLSmidth, UCC Environmental, Magaldi Power, and Bevcon Wayors
Additional Attributes Dollar sales by orientation and application category, regional demand trends, competitive landscape, technological advancements in conveyor systems, automation development, environmental compliance innovation, and operational efficiency optimization

Submerged Drag Chain Conveyor Market by Segments

Orientation:

  • Horizontal Type
  • Inclined Type
  • Others

Application:

  • Thermal Power Industry
  • Waste Incineration Industry
  • Biomass Power Generation
  • Others

Region:

Asia Pacific

  • China
  • India
  • Japan
  • South Korea
  • ASEAN
  • Australia & New Zealand
  • Rest of Asia Pacific

North America

  • United States
  • Canada
  • Mexico

Europe

  • Germany
  • United Kingdom
  • France
  • Italy
  • Spain
  • Nordic
  • BENELUX
  • Rest of Europe

Latin America

  • Brazil
  • Chile
  • Argentina
  • Rest of Latin America

Middle East & Africa

  • Kingdom of Saudi Arabia
  • Other GCC Countries
  • Turkey
  • South Africa
  • Other African Union
  • Rest of Middle East & Africa

Table of Content

  1. Executive Summary
    • Global Market Outlook
    • Demand to side Trends
    • Supply to side Trends
    • Technology Roadmap Analysis
    • Analysis and Recommendations
  2. Market Overview
    • Market Coverage / Taxonomy
    • Market Definition / Scope / Limitations
  3. Market Background
    • Market Dynamics
      • Drivers
      • Restraints
      • Opportunity
      • Trends
    • Scenario Forecast
      • Demand in Optimistic Scenario
      • Demand in Likely Scenario
      • Demand in Conservative Scenario
    • Opportunity Map Analysis
    • Product Life Cycle Analysis
    • Supply Chain Analysis
    • Investment Feasibility Matrix
    • Value Chain Analysis
    • PESTLE and Porter’s Analysis
    • Regulatory Landscape
    • Regional Parent Market Outlook
    • Production and Consumption Statistics
    • Import and Export Statistics
  4. Global Market Analysis 2020 to 2024 and Forecast, 2025 to 2035
    • Historical Market Size Value (USD Million) Analysis, 2020 to 2024
    • Current and Future Market Size Value (USD Million) Projections, 2025 to 2035
      • Y to o to Y Growth Trend Analysis
      • Absolute $ Opportunity Analysis
  5. Global Market Pricing Analysis 2020 to 2024 and Forecast 2025 to 2035
  6. Global Market Analysis 2020 to 2024 and Forecast 2025 to 2035, By Classification
    • Introduction / Key Findings
    • Historical Market Size Value (USD Million) Analysis By Classification , 2020 to 2024
    • Current and Future Market Size Value (USD Million) Analysis and Forecast By Classification , 2025 to 2035
      • Horizontal Type
      • Inclined Type
      • Others
    • Y to o to Y Growth Trend Analysis By Classification , 2020 to 2024
    • Absolute $ Opportunity Analysis By Classification , 2025 to 2035
  7. Global Market Analysis 2020 to 2024 and Forecast 2025 to 2035, By Application
    • Introduction / Key Findings
    • Historical Market Size Value (USD Million) Analysis By Application, 2020 to 2024
    • Current and Future Market Size Value (USD Million) Analysis and Forecast By Application, 2025 to 2035
      • Thermal Power Industry
      • Waste Incineration Industry
      • Biomass Power Generation
      • Others
    • Y to o to Y Growth Trend Analysis By Application, 2020 to 2024
    • Absolute $ Opportunity Analysis By Application, 2025 to 2035
  8. Global Market Analysis 2020 to 2024 and Forecast 2025 to 2035, By Region
    • Introduction
    • Historical Market Size Value (USD Million) Analysis By Region, 2020 to 2024
    • Current Market Size Value (USD Million) Analysis and Forecast By Region, 2025 to 2035
      • North America
      • Latin America
      • Western Europe
      • Eastern Europe
      • East Asia
      • South Asia and Pacific
      • Middle East & Africa
    • Market Attractiveness Analysis By Region
  9. North America Market Analysis 2020 to 2024 and Forecast 2025 to 2035, By Country
    • Historical Market Size Value (USD Million) Trend Analysis By Market Taxonomy, 2020 to 2024
    • Market Size Value (USD Million) Forecast By Market Taxonomy, 2025 to 2035
      • By Country
        • USA
        • Canada
        • Mexico
      • By Classification
      • By Application
    • Market Attractiveness Analysis
      • By Country
      • By Classification
      • By Application
    • Key Takeaways
  10. Latin America Market Analysis 2020 to 2024 and Forecast 2025 to 2035, By Country
    • Historical Market Size Value (USD Million) Trend Analysis By Market Taxonomy, 2020 to 2024
    • Market Size Value (USD Million) Forecast By Market Taxonomy, 2025 to 2035
      • By Country
        • Brazil
        • Chile
        • Rest of Latin America
      • By Classification
      • By Application
    • Market Attractiveness Analysis
      • By Country
      • By Classification
      • By Application
    • Key Takeaways
  11. Western Europe Market Analysis 2020 to 2024 and Forecast 2025 to 2035, By Country
    • Historical Market Size Value (USD Million) Trend Analysis By Market Taxonomy, 2020 to 2024
    • Market Size Value (USD Million) Forecast By Market Taxonomy, 2025 to 2035
      • By Country
        • Germany
        • UK
        • Italy
        • Spain
        • France
        • Nordic
        • BENELUX
        • Rest of Western Europe
      • By Classification
      • By Application
    • Market Attractiveness Analysis
      • By Country
      • By Classification
      • By Application
    • Key Takeaways
  12. Eastern Europe Market Analysis 2020 to 2024 and Forecast 2025 to 2035, By Country
    • Historical Market Size Value (USD Million) Trend Analysis By Market Taxonomy, 2020 to 2024
    • Market Size Value (USD Million) Forecast By Market Taxonomy, 2025 to 2035
      • By Country
        • Russia
        • Poland
        • Hungary
        • Balkan & Baltic
        • Rest of Eastern Europe
      • By Classification
      • By Application
    • Market Attractiveness Analysis
      • By Country
      • By Classification
      • By Application
    • Key Takeaways
  13. East Asia Market Analysis 2020 to 2024 and Forecast 2025 to 2035, By Country
    • Historical Market Size Value (USD Million) Trend Analysis By Market Taxonomy, 2020 to 2024
    • Market Size Value (USD Million) Forecast By Market Taxonomy, 2025 to 2035
      • By Country
        • China
        • Japan
        • South Korea
      • By Classification
      • By Application
    • Market Attractiveness Analysis
      • By Country
      • By Classification
      • By Application
    • Key Takeaways
  14. South Asia and Pacific Market Analysis 2020 to 2024 and Forecast 2025 to 2035, By Country
    • Historical Market Size Value (USD Million) Trend Analysis By Market Taxonomy, 2020 to 2024
    • Market Size Value (USD Million) Forecast By Market Taxonomy, 2025 to 2035
      • By Country
        • India
        • ASEAN
        • Australia & New Zealand
        • Rest of South Asia and Pacific
      • By Classification
      • By Application
    • Market Attractiveness Analysis
      • By Country
      • By Classification
      • By Application
    • Key Takeaways
  15. Middle East & Africa Market Analysis 2020 to 2024 and Forecast 2025 to 2035, By Country
    • Historical Market Size Value (USD Million) Trend Analysis By Market Taxonomy, 2020 to 2024
    • Market Size Value (USD Million) Forecast By Market Taxonomy, 2025 to 2035
      • By Country
        • Kingdom of Saudi Arabia
        • Other GCC Countries
        • Turkiye
        • South Africa
        • Other African Union
        • Rest of Middle East & Africa
      • By Classification
      • By Application
    • Market Attractiveness Analysis
      • By Country
      • By Classification
      • By Application
    • Key Takeaways
  16. Key Countries Market Analysis
    • USA
      • Pricing Analysis
      • Market Share Analysis, 2024
        • By Classification
        • By Application
    • Canada
      • Pricing Analysis
      • Market Share Analysis, 2024
        • By Classification
        • By Application
    • Mexico
      • Pricing Analysis
      • Market Share Analysis, 2024
        • By Classification
        • By Application
    • Brazil
      • Pricing Analysis
      • Market Share Analysis, 2024
        • By Classification
        • By Application
    • Chile
      • Pricing Analysis
      • Market Share Analysis, 2024
        • By Classification
        • By Application
    • Germany
      • Pricing Analysis
      • Market Share Analysis, 2024
        • By Classification
        • By Application
    • UK
      • Pricing Analysis
      • Market Share Analysis, 2024
        • By Classification
        • By Application
    • Italy
      • Pricing Analysis
      • Market Share Analysis, 2024
        • By Classification
        • By Application
    • Spain
      • Pricing Analysis
      • Market Share Analysis, 2024
        • By Classification
        • By Application
    • France
      • Pricing Analysis
      • Market Share Analysis, 2024
        • By Classification
        • By Application
    • India
      • Pricing Analysis
      • Market Share Analysis, 2024
        • By Classification
        • By Application
    • ASEAN
      • Pricing Analysis
      • Market Share Analysis, 2024
        • By Classification
        • By Application
    • Australia & New Zealand
      • Pricing Analysis
      • Market Share Analysis, 2024
        • By Classification
        • By Application
    • China
      • Pricing Analysis
      • Market Share Analysis, 2024
        • By Classification
        • By Application
    • Japan
      • Pricing Analysis
      • Market Share Analysis, 2024
        • By Classification
        • By Application
    • South Korea
      • Pricing Analysis
      • Market Share Analysis, 2024
        • By Classification
        • By Application
    • Russia
      • Pricing Analysis
      • Market Share Analysis, 2024
        • By Classification
        • By Application
    • Poland
      • Pricing Analysis
      • Market Share Analysis, 2024
        • By Classification
        • By Application
    • Hungary
      • Pricing Analysis
      • Market Share Analysis, 2024
        • By Classification
        • By Application
    • Kingdom of Saudi Arabia
      • Pricing Analysis
      • Market Share Analysis, 2024
        • By Classification
        • By Application
    • Turkiye
      • Pricing Analysis
      • Market Share Analysis, 2024
        • By Classification
        • By Application
    • South Africa
      • Pricing Analysis
      • Market Share Analysis, 2024
        • By Classification
        • By Application
  17. Market Structure Analysis
    • Competition Dashboard
    • Competition Benchmarking
    • Market Share Analysis of Top Players
      • By Regional
      • By Classification
      • By Application
  18. Competition Analysis
    • Competition Deep Dive
      • Babcock & Wilcox
        • Overview
        • Product Portfolio
        • Profitability by Market Segments (Product/Age /Sales Channel/Region)
        • Sales Footprint
        • Strategy Overview
          • Marketing Strategy
          • Product Strategy
          • Channel Strategy
      • Clyde Bergemann
      • FLSmidth
      • UCC Environmental
      • Magaldi Power
      • Bevcon Wayors
      • Macawber Beekay
  19. Assumptions & Acronyms Used
  20. Research Methodology

List of Tables

  • Table 1: Global Market Value (USD Million) Forecast by Region, 2020 to 2035
  • Table 2: Global Market Value (USD Million) Forecast by Classification , 2020 to 2035
  • Table 3: Global Market Value (USD Million) Forecast by Application, 2020 to 2035
  • Table 4: North America Market Value (USD Million) Forecast by Country, 2020 to 2035
  • Table 5: North America Market Value (USD Million) Forecast by Classification , 2020 to 2035
  • Table 6: North America Market Value (USD Million) Forecast by Application, 2020 to 2035
  • Table 7: Latin America Market Value (USD Million) Forecast by Country, 2020 to 2035
  • Table 8: Latin America Market Value (USD Million) Forecast by Classification , 2020 to 2035
  • Table 9: Latin America Market Value (USD Million) Forecast by Application, 2020 to 2035
  • Table 10: Western Europe Market Value (USD Million) Forecast by Country, 2020 to 2035
  • Table 11: Western Europe Market Value (USD Million) Forecast by Classification , 2020 to 2035
  • Table 12: Western Europe Market Value (USD Million) Forecast by Application, 2020 to 2035
  • Table 13: Eastern Europe Market Value (USD Million) Forecast by Country, 2020 to 2035
  • Table 14: Eastern Europe Market Value (USD Million) Forecast by Classification , 2020 to 2035
  • Table 15: Eastern Europe Market Value (USD Million) Forecast by Application, 2020 to 2035
  • Table 16: East Asia Market Value (USD Million) Forecast by Country, 2020 to 2035
  • Table 17: East Asia Market Value (USD Million) Forecast by Classification , 2020 to 2035
  • Table 18: East Asia Market Value (USD Million) Forecast by Application, 2020 to 2035
  • Table 19: South Asia and Pacific Market Value (USD Million) Forecast by Country, 2020 to 2035
  • Table 20: South Asia and Pacific Market Value (USD Million) Forecast by Classification , 2020 to 2035
  • Table 21: South Asia and Pacific Market Value (USD Million) Forecast by Application, 2020 to 2035
  • Table 22: Middle East & Africa Market Value (USD Million) Forecast by Country, 2020 to 2035
  • Table 23: Middle East & Africa Market Value (USD Million) Forecast by Classification , 2020 to 2035
  • Table 24: Middle East & Africa Market Value (USD Million) Forecast by Application, 2020 to 2035

List of Figures

  • Figure 1: Global Market Pricing Analysis
  • Figure 2: Global Market Value (USD Million) Forecast 2020-2035
  • Figure 3: Global Market Value Share and BPS Analysis by Classification , 2025 and 2035
  • Figure 4: Global Market Y to o to Y Growth Comparison by Classification , 2025-2035
  • Figure 5: Global Market Attractiveness Analysis by Classification
  • Figure 6: Global Market Value Share and BPS Analysis by Application, 2025 and 2035
  • Figure 7: Global Market Y to o to Y Growth Comparison by Application, 2025-2035
  • Figure 8: Global Market Attractiveness Analysis by Application
  • Figure 9: Global Market Value (USD Million) Share and BPS Analysis by Region, 2025 and 2035
  • Figure 10: Global Market Y to o to Y Growth Comparison by Region, 2025-2035
  • Figure 11: Global Market Attractiveness Analysis by Region
  • Figure 12: North America Market Incremental Dollar Opportunity, 2025-2035
  • Figure 13: Latin America Market Incremental Dollar Opportunity, 2025-2035
  • Figure 14: Western Europe Market Incremental Dollar Opportunity, 2025-2035
  • Figure 15: Eastern Europe Market Incremental Dollar Opportunity, 2025-2035
  • Figure 16: East Asia Market Incremental Dollar Opportunity, 2025-2035
  • Figure 17: South Asia and Pacific Market Incremental Dollar Opportunity, 2025-2035
  • Figure 18: Middle East & Africa Market Incremental Dollar Opportunity, 2025-2035
  • Figure 19: North America Market Value Share and BPS Analysis by Country, 2025 and 2035
  • Figure 20: North America Market Value Share and BPS Analysis by Classification , 2025 and 2035
  • Figure 21: North America Market Y to o to Y Growth Comparison by Classification , 2025-2035
  • Figure 22: North America Market Attractiveness Analysis by Classification
  • Figure 23: North America Market Value Share and BPS Analysis by Application, 2025 and 2035
  • Figure 24: North America Market Y to o to Y Growth Comparison by Application, 2025-2035
  • Figure 25: North America Market Attractiveness Analysis by Application
  • Figure 26: Latin America Market Value Share and BPS Analysis by Country, 2025 and 2035
  • Figure 27: Latin America Market Value Share and BPS Analysis by Classification , 2025 and 2035
  • Figure 28: Latin America Market Y to o to Y Growth Comparison by Classification , 2025-2035
  • Figure 29: Latin America Market Attractiveness Analysis by Classification
  • Figure 30: Latin America Market Value Share and BPS Analysis by Application, 2025 and 2035
  • Figure 31: Latin America Market Y to o to Y Growth Comparison by Application, 2025-2035
  • Figure 32: Latin America Market Attractiveness Analysis by Application
  • Figure 33: Western Europe Market Value Share and BPS Analysis by Country, 2025 and 2035
  • Figure 34: Western Europe Market Value Share and BPS Analysis by Classification , 2025 and 2035
  • Figure 35: Western Europe Market Y to o to Y Growth Comparison by Classification , 2025-2035
  • Figure 36: Western Europe Market Attractiveness Analysis by Classification
  • Figure 37: Western Europe Market Value Share and BPS Analysis by Application, 2025 and 2035
  • Figure 38: Western Europe Market Y to o to Y Growth Comparison by Application, 2025-2035
  • Figure 39: Western Europe Market Attractiveness Analysis by Application
  • Figure 40: Eastern Europe Market Value Share and BPS Analysis by Country, 2025 and 2035
  • Figure 41: Eastern Europe Market Value Share and BPS Analysis by Classification , 2025 and 2035
  • Figure 42: Eastern Europe Market Y to o to Y Growth Comparison by Classification , 2025-2035
  • Figure 43: Eastern Europe Market Attractiveness Analysis by Classification
  • Figure 44: Eastern Europe Market Value Share and BPS Analysis by Application, 2025 and 2035
  • Figure 45: Eastern Europe Market Y to o to Y Growth Comparison by Application, 2025-2035
  • Figure 46: Eastern Europe Market Attractiveness Analysis by Application
  • Figure 47: East Asia Market Value Share and BPS Analysis by Country, 2025 and 2035
  • Figure 48: East Asia Market Value Share and BPS Analysis by Classification , 2025 and 2035
  • Figure 49: East Asia Market Y to o to Y Growth Comparison by Classification , 2025-2035
  • Figure 50: East Asia Market Attractiveness Analysis by Classification
  • Figure 51: East Asia Market Value Share and BPS Analysis by Application, 2025 and 2035
  • Figure 52: East Asia Market Y to o to Y Growth Comparison by Application, 2025-2035
  • Figure 53: East Asia Market Attractiveness Analysis by Application
  • Figure 54: South Asia and Pacific Market Value Share and BPS Analysis by Country, 2025 and 2035
  • Figure 55: South Asia and Pacific Market Value Share and BPS Analysis by Classification , 2025 and 2035
  • Figure 56: South Asia and Pacific Market Y to o to Y Growth Comparison by Classification , 2025-2035
  • Figure 57: South Asia and Pacific Market Attractiveness Analysis by Classification
  • Figure 58: South Asia and Pacific Market Value Share and BPS Analysis by Application, 2025 and 2035
  • Figure 59: South Asia and Pacific Market Y to o to Y Growth Comparison by Application, 2025-2035
  • Figure 60: South Asia and Pacific Market Attractiveness Analysis by Application
  • Figure 61: Middle East & Africa Market Value Share and BPS Analysis by Country, 2025 and 2035
  • Figure 62: Middle East & Africa Market Value Share and BPS Analysis by Classification , 2025 and 2035
  • Figure 63: Middle East & Africa Market Y to o to Y Growth Comparison by Classification , 2025-2035
  • Figure 64: Middle East & Africa Market Attractiveness Analysis by Classification
  • Figure 65: Middle East & Africa Market Value Share and BPS Analysis by Application, 2025 and 2035
  • Figure 66: Middle East & Africa Market Y to o to Y Growth Comparison by Application, 2025-2035
  • Figure 67: Middle East & Africa Market Attractiveness Analysis by Application
  • Figure 68: Global Market - Tier Structure Analysis
  • Figure 69: Global Market - Company Share Analysis

Frequently Asked Questions

How big is the submerged drag chain conveyor market in 2025?

The global submerged drag chain conveyor market is estimated to be valued at USD 397.4 million in 2025.

What will be the size of submerged drag chain conveyor market in 2035?

The market size for the submerged drag chain conveyor market is projected to reach USD 672.4 million by 2035.

How much will be the submerged drag chain conveyor market growth between 2025 and 2035?

The submerged drag chain conveyor market is expected to grow at a 5.4% CAGR between 2025 and 2035.

What are the key product types in the submerged drag chain conveyor market?

The key product types in submerged drag chain conveyor market are horizontal type, inclined type and others.

Which application segment to contribute significant share in the submerged drag chain conveyor market in 2025?

In terms of application, thermal power industry segment to command 42.0% share in the submerged drag chain conveyor market in 2025.

Explore Similar Insights

Future Market Insights

Submerged Drag Chain Conveyor Market

Chat With MaRIA

Chat With

MaRIA

Hi There, I am MaRIA, Your Market Research Intelligence Assistant. How may I help you?