Global Telehealth Therapy Services Market Size and Share Forecast Outlook 2025 to 2035

The Global Telehealth Therapy Services Market is expected to record a valuation of USD 8,824.3 million in 2025 and USD 18,541.2 million in 2035, with an increase of USD 9,716.9 million, which equals a growth of 2.1X over the decade. The overall expansion represents a CAGR of 7.7% and a doubling of market size.
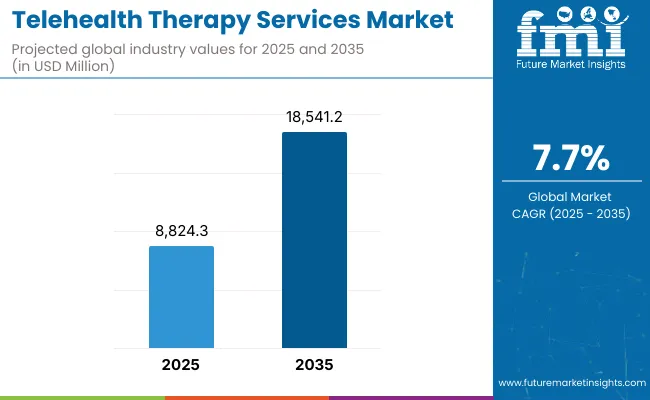
Quick Stats for Global Telehealth Therapy Services Market

  • Global Telehealth Therapy Services Market Value (2025): USD 8,824.3 million
  • Global Telehealth Therapy Services Market Forecast Value (2035): USD 18,541.2 million
  • Global Telehealth Therapy Services Market Forecast CAGR: 7.7%
  • Leading Segment in Global Telehealth Therapy Services Market in 2025: Cognitive Behavioral Therapy (35.7%)
  • Key Growth Regions in the Global Telehealth Therapy Services Market: India, China, Japan
  • Top Key Players in Global Telehealth Therapy Services Market: BetterHelp, Talkspace, Amwell, Teladoc Health, Doctor on Demand, Cerebral, ReGain, Wellnite, Pride Counseling, Thriveworks

Telehealth Therapy Services Market

Global Telehealth Therapy Services Market Key Takeaways

Metric Value
Market Estimated Value in (2025E) USD 8,824.3 million
Market Forecast Value in (2035F) USD 18,541.2 million
Forecast CAGR (2025 to 2035) 7.7 %

During the first five-year period from 2025 to 2030, the market increases from USD 8,824.3 million to USD 12,791.1 million, adding USD 3,966.8 million, which accounts for 40.8% of the total decade growth. This phase records steady adoption in cognitive behavioral therapy, video conferencing-based sessions, and residential end use, driven by rising mental health awareness and digital accessibility. Video conferencing dominates this period as it caters to over 23.8% of users requiring real-time therapist interaction.

The second half from 2030 to 2035 contributes USD 5,750.1 million, equal to 59.2% of total growth, as the market jumps from USD 12,791.1 million to USD 18,541.2 million. This acceleration is powered by widespread deployment of AI-driven teletherapy, multilingual counseling platforms, and hybrid commercial adoption across workplaces, schools, and healthcare institutions. Residential continues to hold majority share, but commercial adoption rises to reshape the demand mix by 2035.

From 2020 to 2024, the Global Telehealth Therapy Services Market grew from under USD 5,000 million to over USD 8,500 million, driven by pandemic-led adoption and digital transformation in mental health delivery. During this period, the competitive landscape was dominated by BetterHelp, Talkspace, and Amwell, which controlled a large share of digital therapy sessions. Competitive differentiation relied on network size, affordability, and therapist accessibility, while instant messaging and AI triage remained secondary features. Service-based subscription models began to gain momentum but represented less than 15% of total value.

Demand for telehealth therapy services will expand to USD 8,824.3 million in 2025, and the revenue mix will shift as commercial deployments gain traction alongside residential dominance. Traditional leaders face rising competition from AI-powered platforms and niche providers offering targeted services such as LGBTQ+ counseling, family therapy, and multilingual digital platforms. Market leaders are pivoting to hybrid models that combine video conferencing, instant messaging, and telephone-based sessions, while startups build competitive advantage around ecosystem integration, scalability, and recurring subscription revenues.

Why the Global Telehealth Therapy Services Market is growing?

Advances in digital therapy platforms have improved accessibility, allowing for more efficient delivery of services across diverse demographics. Video conferencing sessions, valued at USD 2,100.2 million in 2025, gained popularity due to their ability to replicate in-person therapy experiences and provide real-time engagement. The expansion of cognitive behavioral therapy (CBT) as a structured, evidence-based modality, with 35.7% share in 2025, strengthens its role as the dominant therapy type.

Expansion of residential end use, representing 65.3% share in 2025, continues to fuel growth as patients prefer flexible, at-home therapy options. Rapid adoption in India (13.8% CAGR), China (12.3% CAGR), and Japan (9.9% CAGR) underscores the rising demand in emerging and technologically advancing regions. Innovations in AI-driven therapy matching, multilingual session delivery, and integration with corporate wellness programs are expected to open new commercial adoption pathways. Segment growth is expected to be led by cognitive behavioral therapy, video conferencing as a medium, and residential end use, due to their adaptability and scalability.

Segmental Analysis

The market is segmented by therapy type, session medium, end use, and region. Therapy types include Cognitive Behavioral Therapy (CBT), Psychodynamic Therapy, and Person-Centered Therapy, representing the core categories of psychological treatment delivered through telehealth platforms. Session mediums cover video conferencing, instant messaging or chat, and telephone (audio-based therapy), highlighting the different modes of remote therapist-patient interaction.

Based on end use, the segmentation includes residential and commercial applications. Residential use reflects individual and family-based therapy sessions conducted at home, which dominate the market due to affordability and accessibility. Commercial adoption spans corporate wellness programs, schools, clinics, and institutional healthcare environments, where structured mental health programs are increasingly integrated into organizational frameworks.

Regionally, the scope spans North America, Europe, Asia-Pacific, Latin America, and the Middle East & Africa, with key country-level contributions from the USA, China, India, Japan, Germany, and the UK Emerging markets in Asia are expected to grow fastest, driven by increasing digital adoption, supportive government initiatives, and high unmet mental health needs.
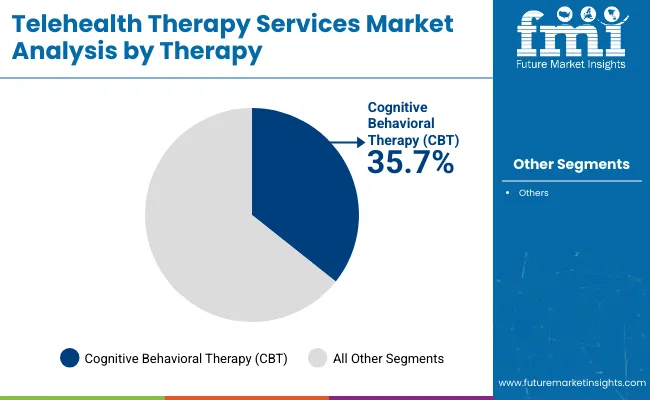
Insights into the Therapy Type Segment with CBT Leading in Market Share

Telehealth Therapy Services Market By Therapy

Therapy Type Segment Market Value Share, 2025
Cognitive Behavioral Therapy (CBT) 35.7%
Others 64.3%

The Cognitive Behavioral Therapy (CBT) segment is projected to contribute 35.7% of the Global Telehealth Therapy Services Market revenue in 2025, making it the leading therapy type. This dominance is driven by CBT’s structured, evidence-based approach and its effectiveness in treating depression, anxiety, and behavioral conditions. The adaptability of CBT to digital platforms enhances its accessibility, supporting strong adoption among patients seeking measurable outcomes.Growth in the CBT segment is also supported by the integration of AI-driven therapy modules and digital tools that allow guided self-help sessions under therapist supervision. As awareness of mental health expands globally, CBT is expected to remain the backbone of telehealth therapy services, providing consistent value across both residential and commercial users.
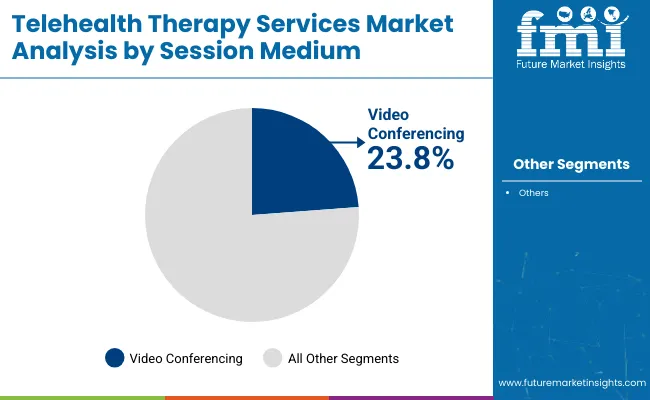
Insights into the Session Medium Segment with Video Conferencing Dominating the Demand

Telehealth Therapy Services Market By Session

Session Medium Segment Market Value Share, 2025
Video Conferencing 23.8%
Others 76.2%

The video conferencing segment is forecasted to hold 23.8% of the market share in 2025, emerging as the dominant session medium for telehealth therapy. This format is preferred due to its ability to replicate in-person counseling experiences, creating a higher level of trust and engagement between patients and therapists. Real-time interactions make it suitable for complex therapy sessions where visual and non-verbal cues are critical. The segment’s growth is further strengthened by the availability of secure, HIPAA-compliant platforms and high-speed internet penetration that enables seamless connectivity. As personalization and visual engagement become central to mental health treatment, video conferencing is expected to maintain its role as the most effective and widely adopted teletherapy medium.
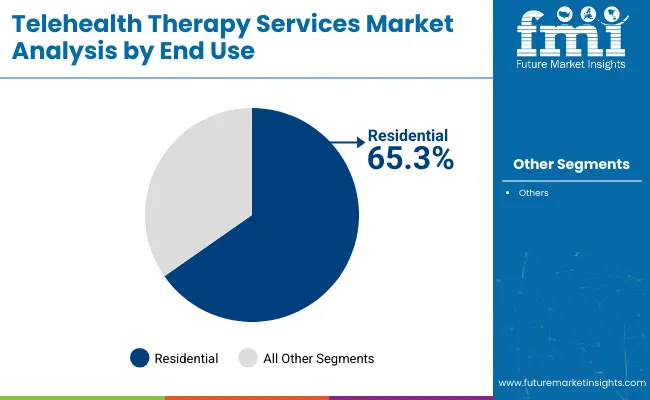
Insights into the End Use Segment with Residential Leading in Market Share

Telehealth Therapy Services Market By End Use

End Use Segment Market Value Share, 2025
Residential 65.3%
Others 34.7%

The residential segment is projected to account for 65.3% of the Global Telehealth Therapy Services Market revenue in 2025, establishing itself as the leading end use category. The dominance of residential usage is driven by increasing patient preference for at-home, flexible therapy sessions that eliminate travel barriers and reduce costs. The rise of subscription-based platforms like BetterHelp and Talkspace has accelerated adoption in this category.

The segment’s growth is also fueled by rising mental health awareness campaigns, post-pandemic digital health habits, and the convenience of on-demand therapy services. While residential remains dominant, the commercial segment covering corporate wellness programs, educational institutions, and healthcare facilitiesis expected to grow faster over the forecast period, driven by organizational investments in structured mental health support for employees and students.

What are the Drivers, Restraints, and Key Trends of the Global Telehealth Therapy Market?

Drivers

Rising Demand for Accessible and Affordable Mental Health Care

The demand for accessible and affordable mental health care is one of the strongest growth drivers for the global telehealth therapy services market. Rising incidences of depression, anxiety, post-traumatic stress disorder, and burnout are pushing patients toward solutions that are flexible and more cost-effective than traditional in-person counseling. According to WHO, one in every eight people globally suffers from a mental health disorder, yet access to therapy remains limited due to cost, stigma, and geographical barriers. Telehealth therapy bridges this gap by eliminating the need for physical infrastructure and enabling therapy delivery across remote and underserved populations.

In 2025, the residential end use already accounts for 65.3% of the market (USD 5,762.3 million), reflecting how patients are increasingly engaging in therapy sessions from the comfort of their homes. The cost-efficiency of subscription-based services, such as BetterHelp, Talkspace, and Cerebral, has further strengthened adoption among younger demographics who may not otherwise afford in-person sessions. Additionally, the convenience of scheduling, reduced waiting times, and the ability to switch therapists seamlessly all contribute to wider acceptance.

This accessibility-driven growth is particularly pronounced in emerging economies. Countries like India (13.8% CAGR) and China (12.3% CAGR) are seeing a surge in demand as smartphone penetration and digital payments open access to millions of first-time therapy seekers. Governments and NGOs are also supporting mental health awareness campaigns, reducing stigma, and creating favorable conditions for teletherapy platforms to grow. Over the decade, affordability and accessibility will remain central to expanding patient bases, positioning telehealth therapy services as a critical part of global mental healthcare ecosystems.

Integration of AI, Multilingual Platforms, and Personalized Digital Therapies

The second major driver is the integration of advanced technologies such as artificial intelligence (AI), natural language processing (NLP), and machine learning into therapy platforms. AI-driven therapy matching systems now analyze patient needs, demographics, and preferences to connect them with the most suitable therapist, reducing drop-out rates and improving outcomes. Additionally, AI chatbots and guided therapy modules provide immediate mental health support, acting as a supplement between live sessions and lowering overall therapy costs.

The market already reflects this technology-driven growth: in 2025, video conferencing accounts for 23.8% (USD 2,100.2 million) of revenues, showing the importance of digital-first interaction. Platforms like Amwell and Teladoc Health are embedding AI for personalized therapy programs, while niche players such as Pride Counseling focus on specialized user groups (e.g., LGBTQ+ therapy) supported by targeted digital experiences.

Multilingual and multicultural platforms are also opening new avenues. In Asia-Pacific, for instance, therapy platforms are providing content and live sessions in local languages, addressing previously underserved populations. This localization makes teletherapy more inclusive and culturally sensitive, a critical factor in patient trust and engagement. The personalization wave is also tied to analytics.

By tracking patient progress through digital dashboards, therapists can adjust treatment plans in real-time, ensuring higher success rates. The integration of wearable devices and mobile mental health apps with therapy platforms is also creating feedback loops, where daily mood or stress data can inform therapy. Over the next decade, these innovations will transform teletherapy from being just a replacement for in-person care into a personalized, data-driven mental health management system.

Restraints

Regulatory and Licensing Barriers Across Countries

Despite strong growth potential, one of the most significant restraints on the global telehealth therapy services market is the patchwork of regulatory frameworks across regions. Mental health therapy is governed by strict licensing, privacy, and professional accreditation laws that vary significantly between countries and even within countries like the USA, where state-level licensing restricts therapists from treating patients across state lines. This lack of harmonization creates barriers for platforms that want to scale globally.

Teletherapy services also face challenges around compliance with HIPAA (Health Insurance Portability and Accountability Act) in the USA and GDPR (General Data Protection Regulation) in Europe. These regulations ensure patient confidentiality but add operational complexity and costs for therapy providers. Smaller teletherapy startups often struggle to meet compliance requirements, limiting their ability to expand internationally.

In emerging markets, the regulatory frameworks are less developed, but this creates uncertainty rather than opportunity. Lack of clear telehealth standards makes it difficult for investors and providers to scale confidently. Moreover, governments often hesitate to authorize cross-border mental health services, citing risks around malpractice liability and patient safety. Without harmonized global or regional policies, teletherapy providers must navigate fragmented and restrictive legal systems, which slows innovation and limits patient access. Although regulatory reform is gradually underway in some regions, this restraint will remain a key challenge through the forecast period.

Digital Divide and Technology Limitations

The digital divide represents another major restraint on the adoption of telehealth therapy services. While urban and developed regions have access to high-speed internet and affordable smartphones, rural and low-income populations in emerging economies face challenges in accessing reliable digital infrastructure.

Even in high-growth markets such as India and China, large sections of the population remain offline or have unstable internet connectivity, limiting the scalability of video-based sessions. This limitation directly impacts the session medium segment. Although video conferencing leads with 23.8% share in 2025, instant messaging and audio-based therapy dominate the remainder of the market (76.2%) because they require less bandwidth. While these modes increase accessibility, they may compromise on therapy quality due to limited visual cues.

Furthermore, older age groups and digitally unskilled users often find it difficult to navigate therapy apps or platforms, creating an adoption barrier. The digital literacy gap, coupled with lack of access to devices in lower-income groups, could exclude vulnerable populations who need therapy the most. Unless governments and private providers invest in digital infrastructure, affordable internet access, and digital literacy programs, this divide will continue to hinder universal access to telehealth therapy services. While growth in urban centers remains strong, bridging the gap in rural and underserved areas is essential for the market to achieve its full potential.

Key Trends

Commercial Adoption of Teletherapy in Corporate Wellness and Institutions

A key trend shaping the telehealth therapy services market is the expansion from residential to commercial adoption. While residential usage dominates in 2025 with a 65.3% share, companies, schools, and universities are increasingly integrating teletherapy services into their wellness programs. Employers are recognizing the link between employee productivity, retention, and mental health, driving demand for large-scale subscription contracts with platforms such as Teladoc Health and Amwell. In educational institutions, digital therapy platforms are being introduced to address rising levels of anxiety and stress among students.

Schools and universities are offering counseling services through online platforms, making mental health support more accessible to younger populations. This trend is particularly visible in the 2030-2035 growth phase, where commercial adoption contributes a significant share of incremental revenues. By embedding teletherapy into workplace wellness packages and institutional support systems, providers gain steady, recurring revenue streams while broadening their user base. The commercialization of teletherapy is expected to rebalance the market’s revenue mix, creating a dual ecosystem of residential flexibility and institutional scale.

Shift Toward Hybrid and Niche Service Models

Another defining trend is the move away from one-size-fits-all therapy toward hybrid and niche-focused teletherapy models. Platforms are increasingly combining video conferencing, instant messaging, and audio sessions to offer flexibility for diverse user preferences. This hybrid delivery ensures that patients can switch between modes depending on their needs, improving satisfaction and retention. At the same time, niche teletherapy platforms are gaining traction. For instance, Pride Counseling specializes in LGBTQ+ therapy, while ReGain focuses on relationship and couples counseling. These platforms differentiate themselves by offering targeted expertise, curated therapist networks, and tailored user experiences.

The rise of specialized services also reflects the market’s maturity. As mainstream platforms like BetterHelp and Talkspace compete on scale, niche providers build loyalty through personalization. Hybrid service models, combined with AI-driven personalization and cultural adaptation, are expected to dominate by 2035.This trend signals a shift in competitive advantage from sheer network size to ecosystem strength, inclusivity, and service differentiation, reshaping the global telehealth therapy landscape.
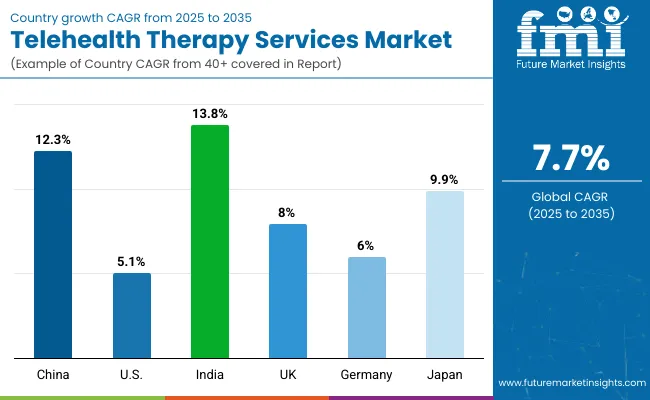
Analysis of Global Telehealth Therapy Services Market By Key Countries

Telehealth Therapy Services Market Country

Countries Estimated CAGR (2025 to 2035)
China 12.3%
USA 5.1%
India 13.8%
UK 8.0%
Germany 6.0%
Japan 9.9%

The global Telehealth Therapy Services Market shows a pronounced regional disparity in adoption speed, strongly influenced by digital infrastructure, smartphone penetration, healthcare spending, and regulatory frameworks. Asia-Pacific emerges as the fastest-growing region, anchored by India at 13.8% CAGR and China at 12.3% CAGR. India’s trajectory reflects sharp growth in residential therapy adoption, with rising awareness, government-backed mental health initiatives, and affordability driving uptake in both urban and semi-urban regions. China benefits from a strong digital ecosystem, smartphone integration, and city-level programs promoting mental wellness through online platforms. Both countries are leveraging AI-powered and multilingual therapy platforms, boosting accessibility across diverse demographics.

Europe maintains a steady growth profile, led by Germany (6.0% CAGR) and the UK (8.0% CAGR). The region’s expansion is supported by high government investment in mental health, digital health policies, and corporate adoption of employee well-being programs. UK’s faster growth is tied to early adoption of digital platforms in schools and workplaces, while Germany shows moderate but consistent expansion due to regulatory complexity.

Japan (9.9% CAGR) stands out with strong adoption of video conferencing-based therapy and integration of teletherapy services into corporate wellness structures. Cultural openness toward mental health interventions is gradually rising, supporting steady growth. North America shows mature expansion, with the USA growing at 5.1% CAGR. The market reflects high baseline adoption levels but slower growth compared to Asia, as digital therapy is already well-established. Expansion in the USA is more service-driven, with platforms adding value through AI integration, therapist network expansion, and hybrid delivery models rather than new user penetration.

Sales Outlook for Telehealth Therapy Services in the United States

Year USA Telehealth Therapy Services Market
2025 2046.2
2026 2182.5
2027 2327.9
2028 2482.9
2029 2648.3
2030 2824.7
2031 3012.9
2032 3213.5
2033 3427.6
2034 3655.8
2035 3899.3

The Telehealth Therapy Services Market in the United States is projected to grow at a CAGR of 5.1%, led by strong demand for residential therapy sessions and growing employer investments in corporate wellness programs. Platforms like BetterHelp, Talkspace, and Amwell dominate, focusing on affordability, network size, and personalized matching algorithms. While adoption growth is slower than in emerging markets, the USA remains the largest single-country market by value, driven by established digital infrastructure and insurance integration.

  • Cognitive Behavioral Therapy (CBT) accounts for 37.4% share (USD 765.3 million) in 2025.
  • Subscription-based therapy dominates consumer preferences for affordability and flexibility.
  • Corporate wellness packages are creating a secondary growth engine for commercial adoption.

Growth and Expansion Outlook for Telehealth Therapy Services in the United Kingdom

The Telehealth Therapy Services Market in the United Kingdom is expected to grow at a CAGR of 8.0%, supported by robust adoption across both residential and institutional segments. Post-pandemic normalization of teletherapy, combined with NHS-backed mental health initiatives and employer-driven adoption, is creating a strong market foundation. Corporate wellness adoption is rising, with employers subsidizing therapy sessions for workforce productivity. Universities and schools are embedding digital therapy into student support systems. Increased mental health awareness campaigns are driving uptake across younger demographics.

Growth and Expansion Outlook for Telehealth Therapy Services in India

India is witnessing rapid growth in the Telehealth Therapy Services Market, forecast to expand at a CAGR of 13.8%, the highest among all leading economies. Adoption is driven by cost-effective digital platforms, widespread smartphone penetration, and increased awareness in tier-2 and tier-3 cities. Subscription platforms are gaining traction due to low-cost entry models. Government initiatives to integrate telehealth into public mental health systems are accelerating growth. Educational institutions are partnering with teletherapy providers for student wellness programs.

Sales Outlook for Telehealth Therapy Services in China

Countries 2025 Share (%)
USA 23.2%
China 11.9%
Japan 6.9%
Germany 15.3%
UK 8.0%
India 4.8%
Countries 2035 Share (%)
USA 21.0%
China 13.0%
Japan 8.5%
Germany 13.6%
UK 7.4%
India 6.0%

The Telehealth Therapy Services Market in China is expected to grow at a CAGR of 12.3%, supported by the country’s digital-first approach and rapid platform adoption. Affordable, domestically developed teletherapy apps are enabling mass-market penetration, while government-led awareness campaigns encourage mental wellness adoption. Video conferencing dominates with 24.8% share (USD 259.4 million) in 2025. Localized platforms offering multilingual support fuel adoption across regions. Corporate and institutional teletherapy programs are expanding as employers prioritize workforce wellness.

The data highlights the shifting market shares of key countries between 2025 and 2035. The USA is projected to retain its leading position with a significant share of 23.2% in 2025, although this will slightly decline to 21.0% by 2035, reflecting a gradual redistribution of global market power. Germany also experiences a decline, moving from 15.3% in 2025 to 13.6% by 2035, signaling the impact of market saturation and stronger competition from emerging economies. Similarly, the UK shows a marginal decline from 8.0% to 7.4%, pointing to slower growth compared to peers.

On the other hand, emerging markets demonstrate steady upward momentum. China grows from 11.9% in 2025 to 13.0% in 2035, driven by rising industrial capacity and domestic consumption. Japan also strengthens its share from 6.9% to 8.5%, benefiting from innovation-driven demand expansion. India shows the most notable growth trajectory, increasing from 4.8% in 2025 to 6.0% in 2035, reflecting its growing role as a demand-driven and cost-competitive market. Together, these shifts illustrate a gradual rebalancing of market power, where developed markets remain dominant but growth momentum increasingly favors Asia.

Opportunity Analysis of United States Telehealth Therapy Services Market

Therapy Type Segment Market Value Share, 2025
Cognitive Behavioral Therapy (CBT) 3%
Others 34.7%

The United States Telehealth Therapy Services Market is valued at USD 2,046.24 million in 2025. CBT leads the therapy mix with 37.4% share (USD 765.29 million), reflecting strong clinical evidence, structured, outcome‑oriented protocols, and easy digitization into guided modules and therapist‑led video sessions. Widespread insurance coverage for virtual visits, mature platform ecosystems (BetterHelp, Talkspace, Amwell, Teladoc), and large therapist networks sustain high residential uptake and drive recurring subscription revenue. Commercial demand is expanding as employers embed teletherapy into benefits to address burnout and retention. While the USA remains the single largest market by value, growth is steadier than in Asia due to relative maturity. Product differentiation centers on therapist availability, AI‑assisted matching, care navigation, and tri‑modal delivery (video, chat, audio). Integration with EHRs and outcomes tracking supports payor partnerships and longer‑term contracts.

  • Market size for the USA in 2025: USD 2,046.24 million
  • Global market share (2025): 23.2%
  • Leading therapy type: CBT at 37.4% (USD 765.29 million)

Opportunity Analysis of China Telehealth Therapy Services Market

Session Medium Segment Market Value Share, 2025
Video Conferencing 24.8%
Others 75.2%

The China Telehealth Therapy Services Market is valued at ≈ USD 1,050.1 million in 2025 (11.9% of global value). Video conferencing commands 24.8% share (USD 259.37 million), supported by high‑speed mobile internet and user preference for real‑time counselor interaction. “Others” (chat and telephone) account for 75.2% (USD 786.48 million), enabling reach across bandwidth‑constrained areas and first‑time therapy users.

Rapid localization multilingual interfaces, culturally adapted CBT content and city‑level wellness initiatives are expanding access beyond Tier‑1 cities. Domestic platforms’ competitive pricing and super‑app integrations (payments, scheduling, messaging) lower friction and accelerate adoption. As mental‑health awareness programs scale and employers introduce wellbeing benefits, China’s growth outpaces mature markets, with rising conversion from text‑based support to scheduled video sessions over the forecast period.
  • Market size for China in 2025: ≈ USD 1,050.1 million
  • Global market share (2025): 11.9%
  • Leading session medium: Video Conferencing at 24.8% (USD 259.37 million)

Competitive Landscape of Global Telehealth Therapy Services Market

Telehealth Therapy Services Market By Comapny

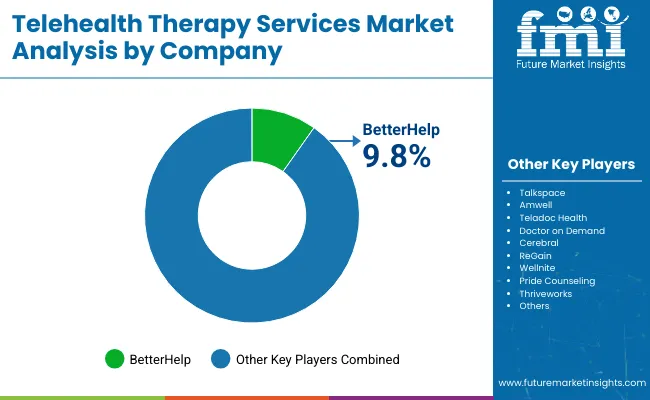
The Global Telehealth Therapy Services Market is moderately fragmented, with global leaders, mid-sized innovators, and niche specialists competing across diverse therapy delivery formats. BetterHelp holds a notable 9.8% share in 2025, emerging as the market leader through its extensive therapist base, affordable subscription models, and widespread digital reach. Other major players such as Talkspace, Amwell, Teladoc Health, Doctor on Demand, Cerebral, ReGain, Wellnite, Pride Counseling, and Thrive works hold strong positions, leveraging differentiated service models spanning individual, couples, group, and LGBTQ+ counseling. Their strategies increasingly emphasize AI-driven therapist matching, integration with employer wellness benefits, and partnerships with insurers and healthcare systems.

Growth is also supported by hybrid delivery models that combine live therapy sessions with asynchronous support via messaging, guided CBT programs, and wellness tracking apps. Mid-sized providers are gaining traction by focusing on personalization, niche demographics, and user-friendly mobile platforms, making them particularly relevant for younger and first-time therapy users. Competitive differentiation is shifting away from simple session delivery toward ecosystem-driven value propositions.

Leading companies are building integrated platforms that include clinical outcome tracking, digital triage tools, and subscription-based therapy packages, positioning themselves not only as therapy providers but as holistic mental-health ecosystems. This shift is expected to intensify competition, with players differentiating through scalability, therapist network quality, regional localization, and recurring revenue models.

Key Developments in Global Telehealth Therapy Services Market

  • In April 2025, Teladoc Health acquired virtual therapy provider Up Lift for USD 30 million in cash, with up to USD 15 million in performance-based earnouts. UpLift brings in-network health plan capabilities covering over 100 million lives and a provider network of ~1,500 mental health professionals.
  • In mid-2025, Teladoc launched Well bound, a comprehensive Employee Assistance Program combining BetterHelp’s therapy services with psychiatry, medication management, and work-life resources. The program aims to deliver integrated care to corporate and health plan clients starting January 2026

Scope of the Report

Item Value
Quantitative Units USD 8,824.3 Million
Therapy Type Cognitive Behavioral Therapy (CBT), Psychodynamic Therapy, Person-Centered Therapy
Session Medium Video Conferencing, Instant Messaging / Chat, Telephone (Audio)
End-use Residential, Commercial
Regions Covered North America, Europe, Asia-Pacific, Latin America, Middle East & Africa
Country Covered United States, Canada, Germany, France, United Kingdom, China, Japan, India, Brazil, South Africa
Key Companies Profiled BetterHelp, Talkspace, Amwell, Teladoc Health, Doctor on Demand, Cerebral, ReGain, Wellnite, Pride Counseling, Thriveworks
Additional Attributes Dollar sales by therapy type and session medium, adoption trends across residential and commercial end-use, and expanding insurance and employer-wellness partnerships are shaping the telehealth therapy services market. Rising demand for video-based and chat-based therapy sessions is fueling platform adoption, while AI-driven personalization and multilingual access are making services more inclusive and scalable.

Key Segments

By Therapy Type:

  • Cognitive Behavioral Therapy (CBT)
  • Psychodynamic Therapy
  • Person-Centered Therapy

By Session Medium:

  • Video Conferencing
  • Instant Messaging / Chat
  • Telephone (Audio)

By End Use:

  • Residential
  • Commercial

By Region:

  • North America
  • Latin America
  • Europe
  • East Asia
  • South Asia & Pacific
  • Middle East and Africa

Table of Content

  1. Executive Summary
    • Global Market Outlook
    • Demand-side Trends
    • Supply-side Trends
    • Technology Roadmap Analysis
    • Analysis and Recommendations
  2. Market Overview
    • Market Coverage / Taxonomy
    • Market Definition / Scope / Limitations
  3. Market Background
    • Market Dynamics
      • Drivers
      • Restraints
      • Opportunity
      • Trends
    • Scenario Forecast
      • Demand in Optimistic Scenario
      • Demand in Likely Scenario
      • Demand in Conservative Scenario
    • Opportunity Map Analysis
    • Product Life Cycle Analysis
    • Supply Chain Analysis
      • Supply Side Participants and their Roles
        • Producers
        • Mid-Level Participants (Traders/ Agents/ Brokers)
        • Wholesalers and Distributors
      • Value Added and Value Created at Node in the Supply Chain
      • List of Raw Material Suppliers
      • List of Existing and Potential Buyer’s
    • Investment Feasibility Matrix
    • Value Chain Analysis
      • Profit Margin Analysis
      • Wholesalers and Distributors
      • Retailers
    • PESTLE and Porter’s Analysis
    • Regulatory Landscape
      • By Key Regions
      • By Key Countries
    • Regional Parent Market Outlook
    • Production and Consumption Statistics
    • Import and Export Statistics
  4. Global Market Analysis 2020 to 2024 and Forecast, 2025 to 2035
    • Historical Market Size Value (USD Million) & Volume (Units) Analysis, 2020 to 2024
    • Current and Future Market Size Value (USD Million) & Volume (Units) Projections, 2025 to 2035
      • Y-o-Y Growth Trend Analysis
      • Absolute $ Opportunity Analysis
  5. Global Market Analysis 2020 to 2024 and Forecast 2025 to 2035, By Therapy Type
    • Introduction / Key Findings
    • Historical Market Size Value (USD Million) & Volume (Units) Analysis By Therapy Type, 2020 to 2024
    • Current and Future Market Size Value (USD Million) & Volume (Units) Analysis and Forecast By Therapy Type, 2025 to 2035
      • Cognitive Behavioral Therapy (CBT)
      • Psychodynamic Therapy
      • Person-Centered Therapy
    • Y-o-Y Growth Trend Analysis By Therapy Type, 2020 to 2024
    • Absolute $ Opportunity Analysis By Therapy Type, 2025 to 2035
  6. Global Market Analysis 2020 to 2024 and Forecast 2025 to 2035, By Session Medium
    • Introduction / Key Findings
    • Historical Market Size Value (USD Million) & Volume (Units) Analysis By Session Medium, 2020 to 2024
    • Current and Future Market Size Value (USD Million) & Volume (Units) Analysis and Forecast By Session Medium, 2025 to 2035
      • Video Conferencing
      • Instant Messaging / Chat
      • Telephone (Audio)
    • Y-o-Y Growth Trend Analysis By Session Medium, 2020 to 2024
    • Absolute $ Opportunity Analysis By Session Medium, 2025 to 2035
  7. Global Market Analysis 2020 to 2024 and Forecast 2025 to 2035, By End Use
    • Introduction / Key Findings
    • Historical Market Size Value (USD Million) & Volume (Units) Analysis By End Use, 2020 to 2024
    • Current and Future Market Size Value (USD Million) & Volume (Units) Analysis and Forecast By End Use, 2025 to 2035
      • Residential
      • Commercial
    • Y-o-Y Growth Trend Analysis By End Use, 2020 to 2024
    • Absolute $ Opportunity Analysis By End Use, 2025 to 2035
  8. Global Market Analysis 2020 to 2024 and Forecast 2025 to 2035, By Region
    • Introduction
    • Historical Market Size Value (USD Million) & Volume (Units) Analysis By Region, 2020 to 2024
    • Current Market Size Value (USD Million) & Volume (Units) Analysis and Forecast By Region, 2025 to 2035
      • North America
      • Latin America
      • Europe
      • East Asia
      • South Asia & Pacific
      • Middle East and Africa
    • Market Attractiveness Analysis By Region
  9. North America Market Analysis 2020 to 2024 and Forecast 2025 to 2035, By Country
    • Historical Market Size Value (USD Million) & Volume (Units) Trend Analysis By Market Taxonomy, 2020 to 2024
    • Market Size Value (USD Million) & Volume (Units) Forecast By Market Taxonomy, 2025 to 2035
      • By Country
        • USA
        • Canada
      • By Therapy Type
      • By Session Medium
      • By End Use
    • Market Attractiveness Analysis
      • By Country
      • By Therapy Type
      • By Session Medium
      • By End Use
    • Key Takeaways
  10. Latin America Market Analysis 2020 to 2024 and Forecast 2025 to 2035, By Country
    • Historical Market Size Value (USD Million) & Volume (Units) Trend Analysis By Market Taxonomy, 2020 to 2024
    • Market Size Value (USD Million) & Volume (Units) Forecast By Market Taxonomy, 2025 to 2035
      • By Country
        • Brazil
        • Mexico
        • Colombia
        • Rest of Latin America
      • By Therapy Type
      • By Session Medium
      • By End Use
    • Market Attractiveness Analysis
      • By Country
      • By Therapy Type
      • By Session Medium
      • By End Use
    • Key Takeaways
  11. Europe Market Analysis 2020 to 2024 and Forecast 2025 to 2035, By Country
    • Historical Market Size Value (USD Million) & Volume (Units) Trend Analysis By Market Taxonomy, 2020 to 2024
    • Market Size Value (USD Million) & Volume (Units) Forecast By Market Taxonomy, 2025 to 2035
      • By Country
        • Germany
        • UK
        • France
        • Italy
        • Spain
        • Belgium
        • Netherlands
        • Nordic
        • Switzerland
        • Russia
        • Poland
        • Rest of Europe
      • By Therapy Type
      • By Session Medium
      • By End Use
    • Market Attractiveness Analysis
      • By Country
      • By Therapy Type
      • By Session Medium
      • By End Use
    • Key Takeaways
  12. East Asia Market Analysis 2020 to 2024 and Forecast 2025 to 2035, By Country
    • Historical Market Size Value (USD Million) & Volume (Units) Trend Analysis By Market Taxonomy, 2020 to 2024
    • Market Size Value (USD Million) & Volume (Units) Forecast By Market Taxonomy, 2025 to 2035
      • By Country
        • China
        • Japan
        • South Korea
      • By Therapy Type
      • By Session Medium
      • By End Use
    • Market Attractiveness Analysis
      • By Country
      • By Therapy Type
      • By Session Medium
      • By End Use
    • Key Takeaways
  13. South Asia & Pacific Market Analysis 2020 to 2024 and Forecast 2025 to 2035, By Country
    • Historical Market Size Value (USD Million) & Volume (Units) Trend Analysis By Market Taxonomy, 2020 to 2024
    • Market Size Value (USD Million) & Volume (Units) Forecast By Market Taxonomy, 2025 to 2035
      • By Country
        • India
        • Thailand
        • Malaysia
        • Indonesia
        • Singapore
        • Vietnam
        • Australia
        • New Zealand
        • Rest of South Asia
      • By Therapy Type
      • By Session Medium
      • By End Use
    • Market Attractiveness Analysis
      • By Country
      • By Therapy Type
      • By Session Medium
      • By End Use
    • Key Takeaways
  14. Middle East and Africa Market Analysis 2020 to 2024 and Forecast 2025 to 2035, By Country
    • Historical Market Size Value (USD Million) & Volume (Units) Trend Analysis By Market Taxonomy, 2020 to 2024
    • Market Size Value (USD Million) & Volume (Units) Forecast By Market Taxonomy, 2025 to 2035
      • By Country
        • Turkey
        • UAE
        • Saudi Arabia
        • Israel
        • Other GCC Countries
        • North Africa
        • South Africa
      • By Therapy Type
      • By Session Medium
      • By End Use
    • Market Attractiveness Analysis
      • By Country
      • By Therapy Type
      • By Session Medium
      • By End Use
    • Key Takeaways
  15. Key Countries Market Analysis
    • USA
      • Pricing Analysis
      • Market Share Analysis, 2024
        • By Therapy Type
        • By Session Medium
        • By End Use
    • Canada
      • Pricing Analysis
      • Market Share Analysis, 2024
        • By Therapy Type
        • By Session Medium
        • By End Use
    • Brazil
      • Pricing Analysis
      • Market Share Analysis, 2024
        • By Therapy Type
        • By Session Medium
        • By End Use
    • Mexico
      • Pricing Analysis
      • Market Share Analysis, 2024
        • By Therapy Type
        • By Session Medium
        • By End Use
    • Colombia
      • Pricing Analysis
      • Market Share Analysis, 2024
        • By Therapy Type
        • By Session Medium
        • By End Use
    • Germany
      • Pricing Analysis
      • Market Share Analysis, 2024
        • By Therapy Type
        • By Session Medium
        • By End Use
    • UK
      • Pricing Analysis
      • Market Share Analysis, 2024
        • By Therapy Type
        • By Session Medium
        • By End Use
    • France
      • Pricing Analysis
      • Market Share Analysis, 2024
        • By Therapy Type
        • By Session Medium
        • By End Use
    • Italy
      • Pricing Analysis
      • Market Share Analysis, 2024
        • By Therapy Type
        • By Session Medium
        • By End Use
    • Spain
      • Pricing Analysis
      • Market Share Analysis, 2024
        • By Therapy Type
        • By Session Medium
        • By End Use
    • Belgium
      • Pricing Analysis
      • Market Share Analysis, 2024
        • By Therapy Type
        • By Session Medium
        • By End Use
    • Netherlands
      • Pricing Analysis
      • Market Share Analysis, 2024
        • By Therapy Type
        • By Session Medium
        • By End Use
    • Nordic
      • Pricing Analysis
      • Market Share Analysis, 2024
        • By Therapy Type
        • By Session Medium
        • By End Use
    • Switzerland
      • Pricing Analysis
      • Market Share Analysis, 2024
        • By Therapy Type
        • By Session Medium
        • By End Use
    • Russia
      • Pricing Analysis
      • Market Share Analysis, 2024
        • By Therapy Type
        • By Session Medium
        • By End Use
    • Poland
      • Pricing Analysis
      • Market Share Analysis, 2024
        • By Therapy Type
        • By Session Medium
        • By End Use
    • China
      • Pricing Analysis
      • Market Share Analysis, 2024
        • By Therapy Type
        • By Session Medium
        • By End Use
    • Japan
      • Pricing Analysis
      • Market Share Analysis, 2024
        • By Therapy Type
        • By Session Medium
        • By End Use
    • South Korea
      • Pricing Analysis
      • Market Share Analysis, 2024
        • By Therapy Type
        • By Session Medium
        • By End Use
    • India
      • Pricing Analysis
      • Market Share Analysis, 2024
        • By Therapy Type
        • By Session Medium
        • By End Use
    • Thailand
      • Pricing Analysis
      • Market Share Analysis, 2024
        • By Therapy Type
        • By Session Medium
        • By End Use
    • Indonesia
      • Pricing Analysis
      • Market Share Analysis, 2024
        • By Therapy Type
        • By Session Medium
        • By End Use
    • Australia
      • Pricing Analysis
      • Market Share Analysis, 2024
        • By Therapy Type
        • By Session Medium
        • By End Use
    • New Zealand
      • Pricing Analysis
      • Market Share Analysis, 2024
        • By Therapy Type
        • By Session Medium
        • By End Use
    • Turkey
      • Pricing Analysis
      • Market Share Analysis, 2024
        • By Therapy Type
        • By Session Medium
        • By End Use
    • UAE
      • Pricing Analysis
      • Market Share Analysis, 2024
        • By Therapy Type
        • By Session Medium
        • By End Use
    • Saudi Arabia
      • Pricing Analysis
      • Market Share Analysis, 2024
        • By Therapy Type
        • By Session Medium
        • By End Use
    • Israel
      • Pricing Analysis
      • Market Share Analysis, 2024
        • By Therapy Type
        • By Session Medium
        • By End Use
    • North Africa
      • Pricing Analysis
      • Market Share Analysis, 2024
        • By Therapy Type
        • By Session Medium
        • By End Use
    • South Africa
      • Pricing Analysis
      • Market Share Analysis, 2024
        • By Therapy Type
        • By Session Medium
        • By End Use
  16. Market Structure Analysis
    • Competition Dashboard
    • Competition Benchmarking
    • Market Share Analysis of Top Players
      • By Regional
      • By Therapy Type
      • By Session Medium
      • By End Use
  17. Competition Analysis
    • Competition Deep Dive
      • BetterHelp
        • Overview
        • Product Portfolio
        • Profitability by Market Segments (Product/Age /Sales Channel/Region)
        • Sales Footprint
        • Strategy Overview
          • Marketing Strategy
          • Product Strategy
          • Channel Strategy
      • Talkspace
        • Overview
        • Product Portfolio
        • Profitability by Market Segments (Product/Age /Sales Channel/Region)
        • Sales Footprint
        • Strategy Overview
          • Marketing Strategy
          • Product Strategy
          • Channel Strategy
      • Amwell
        • Overview
        • Product Portfolio
        • Profitability by Market Segments (Product/Age /Sales Channel/Region)
        • Sales Footprint
        • Strategy Overview
          • Marketing Strategy
          • Product Strategy
          • Channel Strategy
      • Teladoc Health
        • Overview
        • Product Portfolio
        • Profitability by Market Segments (Product/Age /Sales Channel/Region)
        • Sales Footprint
        • Strategy Overview
          • Marketing Strategy
          • Product Strategy
          • Channel Strategy
      • Doctor on Demand
        • Overview
        • Product Portfolio
        • Profitability by Market Segments (Product/Age /Sales Channel/Region)
        • Sales Footprint
        • Strategy Overview
          • Marketing Strategy
          • Product Strategy
          • Channel Strategy
      • Cerebral
        • Overview
        • Product Portfolio
        • Profitability by Market Segments (Product/Age /Sales Channel/Region)
        • Sales Footprint
        • Strategy Overview
          • Marketing Strategy
          • Product Strategy
          • Channel Strategy
      • ReGain
        • Overview
        • Product Portfolio
        • Profitability by Market Segments (Product/Age /Sales Channel/Region)
        • Sales Footprint
        • Strategy Overview
          • Marketing Strategy
          • Product Strategy
          • Channel Strategy
      • Wellnite
        • Overview
        • Product Portfolio
        • Profitability by Market Segments (Product/Age /Sales Channel/Region)
        • Sales Footprint
        • Strategy Overview
          • Marketing Strategy
          • Product Strategy
          • Channel Strategy
      • Pride Counseling
        • Overview
        • Product Portfolio
        • Profitability by Market Segments (Product/Age /Sales Channel/Region)
        • Sales Footprint
        • Strategy Overview
          • Marketing Strategy
          • Product Strategy
          • Channel Strategy
      • Thriveworks
        • Overview
        • Product Portfolio
        • Profitability by Market Segments (Product/Age /Sales Channel/Region)
        • Sales Footprint
        • Strategy Overview
          • Marketing Strategy
          • Product Strategy
          • Channel Strategy
  18. Assumptions & Acronyms Used
  19. Research Methodology

List of Tables

  • Table 1: Global Market Value (USD Million) Forecast by Region, 2020-2035
  • Table 2: Global Market Volume (Units) Forecast by Region, 2020-2035
  • Table 3: Global Market Value (USD Million) Forecast by Therapy Type, 2020-2035
  • Table 4: Global Market Volume (Units) Forecast by Therapy Type, 2020-2035
  • Table 5: Global Market Value (USD Million) Forecast by Session Medium, 2020-2035
  • Table 6: Global Market Volume (Units) Forecast by Session Medium, 2020-2035
  • Table 7: Global Market Value (USD Million) Forecast by End Use, 2020-2035
  • Table 8: Global Market Volume (Units) Forecast by End Use, 2020-2035
  • Table 9: North America Market Value (USD Million) Forecast by Country, 2020-2035
  • Table 10: North America Market Volume (Units) Forecast by Country, 2020-2035
  • Table 11: North America Market Value (USD Million) Forecast by Therapy Type, 2020-2035
  • Table 12: North America Market Volume (Units) Forecast by Therapy Type, 2020-2035
  • Table 13: North America Market Value (USD Million) Forecast by Session Medium, 2020-2035
  • Table 14: North America Market Volume (Units) Forecast by Session Medium, 2020-2035
  • Table 15: North America Market Value (USD Million) Forecast by End Use, 2020-2035
  • Table 16: North America Market Volume (Units) Forecast by End Use, 2020-2035
  • Table 17: Latin America Market Value (USD Million) Forecast by Country, 2020-2035
  • Table 18: Latin America Market Volume (Units) Forecast by Country, 2020-2035
  • Table 19: Latin America Market Value (USD Million) Forecast by Therapy Type, 2020-2035
  • Table 20: Latin America Market Volume (Units) Forecast by Therapy Type, 2020-2035
  • Table 21: Latin America Market Value (USD Million) Forecast by Session Medium, 2020-2035
  • Table 22: Latin America Market Volume (Units) Forecast by Session Medium, 2020-2035
  • Table 23: Latin America Market Value (USD Million) Forecast by End Use, 2020-2035
  • Table 24: Latin America Market Volume (Units) Forecast by End Use, 2020-2035
  • Table 25: Europe Market Value (USD Million) Forecast by Country, 2020-2035
  • Table 26: Europe Market Volume (Units) Forecast by Country, 2020-2035
  • Table 27: Europe Market Value (USD Million) Forecast by Therapy Type, 2020-2035
  • Table 28: Europe Market Volume (Units) Forecast by Therapy Type, 2020-2035
  • Table 29: Europe Market Value (USD Million) Forecast by Session Medium, 2020-2035
  • Table 30: Europe Market Volume (Units) Forecast by Session Medium, 2020-2035
  • Table 31: Europe Market Value (USD Million) Forecast by End Use, 2020-2035
  • Table 32: Europe Market Volume (Units) Forecast by End Use, 2020-2035
  • Table 33: East Asia Market Value (USD Million) Forecast by Country, 2020-2035
  • Table 34: East Asia Market Volume (Units) Forecast by Country, 2020-2035
  • Table 35: East Asia Market Value (USD Million) Forecast by Therapy Type, 2020-2035
  • Table 36: East Asia Market Volume (Units) Forecast by Therapy Type, 2020-2035
  • Table 37: East Asia Market Value (USD Million) Forecast by Session Medium, 2020-2035
  • Table 38: East Asia Market Volume (Units) Forecast by Session Medium, 2020-2035
  • Table 39: East Asia Market Value (USD Million) Forecast by End Use, 2020-2035
  • Table 40: East Asia Market Volume (Units) Forecast by End Use, 2020-2035
  • Table 41: South Asia & Pacific Market Value (USD Million) Forecast by Country, 2020-2035
  • Table 42: South Asia & Pacific Market Volume (Units) Forecast by Country, 2020-2035
  • Table 43: South Asia & Pacific Market Value (USD Million) Forecast by Therapy Type, 2020-2035
  • Table 44: South Asia & Pacific Market Volume (Units) Forecast by Therapy Type, 2020-2035
  • Table 45: South Asia & Pacific Market Value (USD Million) Forecast by Session Medium, 2020-2035
  • Table 46: South Asia & Pacific Market Volume (Units) Forecast by Session Medium, 2020-2035
  • Table 47: South Asia & Pacific Market Value (USD Million) Forecast by End Use, 2020-2035
  • Table 48: South Asia & Pacific Market Volume (Units) Forecast by End Use, 2020-2035
  • Table 49: Middle East and Africa Market Value (USD Million) Forecast by Country, 2020-2035
  • Table 50: Middle East and Africa Market Volume (Units) Forecast by Country, 2020-2035
  • Table 51: Middle East and Africa Market Value (USD Million) Forecast by Therapy Type, 2020-2035
  • Table 52: Middle East and Africa Market Volume (Units) Forecast by Therapy Type, 2020-2035
  • Table 53: Middle East and Africa Market Value (USD Million) Forecast by Session Medium, 2020-2035
  • Table 54: Middle East and Africa Market Volume (Units) Forecast by Session Medium, 2020-2035
  • Table 55: Middle East and Africa Market Value (USD Million) Forecast by End Use, 2020-2035
  • Table 56: Middle East and Africa Market Volume (Units) Forecast by End Use, 2020-2035

List of Figures

  • Figure 1: Global Market Value (USD Million) by Therapy Type, 2025-2035
  • Figure 2: Global Market Value (USD Million) by Session Medium, 2025-2035
  • Figure 3: Global Market Value (USD Million) by End Use, 2025-2035
  • Figure 4: Global Market Value (USD Million) by Region, 2025-2035
  • Figure 5: Global Market Value (USD Million) Analysis by Region, 2020-2035
  • Figure 6: Global Market Volume (Units) Analysis by Region, 2020-2035
  • Figure 7: Global Market Value Share (%) and BPS Analysis by Region, 2025-2035
  • Figure 8: Global Market Y-o-Y Growth (%) Projections by Region, 2025-2035
  • Figure 9: Global Market Value (USD Million) Analysis by Therapy Type, 2020-2035
  • Figure 10: Global Market Volume (Units) Analysis by Therapy Type, 2020-2035
  • Figure 11: Global Market Value Share (%) and BPS Analysis by Therapy Type, 2025-2035
  • Figure 12: Global Market Y-o-Y Growth (%) Projections by Therapy Type, 2025-2035
  • Figure 13: Global Market Value (USD Million) Analysis by Session Medium, 2020-2035
  • Figure 14: Global Market Volume (Units) Analysis by Session Medium, 2020-2035
  • Figure 15: Global Market Value Share (%) and BPS Analysis by Session Medium, 2025-2035
  • Figure 16: Global Market Y-o-Y Growth (%) Projections by Session Medium, 2025-2035
  • Figure 17: Global Market Value (USD Million) Analysis by End Use, 2020-2035
  • Figure 18: Global Market Volume (Units) Analysis by End Use, 2020-2035
  • Figure 19: Global Market Value Share (%) and BPS Analysis by End Use, 2025-2035
  • Figure 20: Global Market Y-o-Y Growth (%) Projections by End Use, 2025-2035
  • Figure 21: Global Market Attractiveness by Therapy Type, 2025-2035
  • Figure 22: Global Market Attractiveness by Session Medium, 2025-2035
  • Figure 23: Global Market Attractiveness by End Use, 2025-2035
  • Figure 24: Global Market Attractiveness by Region, 2025-2035
  • Figure 25: North America Market Value (USD Million) by Therapy Type, 2025-2035
  • Figure 26: North America Market Value (USD Million) by Session Medium, 2025-2035
  • Figure 27: North America Market Value (USD Million) by End Use, 2025-2035
  • Figure 28: North America Market Value (USD Million) by Country, 2025-2035
  • Figure 29: North America Market Value (USD Million) Analysis by Country, 2020-2035
  • Figure 30: North America Market Volume (Units) Analysis by Country, 2020-2035
  • Figure 31: North America Market Value Share (%) and BPS Analysis by Country, 2025-2035
  • Figure 32: North America Market Y-o-Y Growth (%) Projections by Country, 2025-2035
  • Figure 33: North America Market Value (USD Million) Analysis by Therapy Type, 2020-2035
  • Figure 34: North America Market Volume (Units) Analysis by Therapy Type, 2020-2035
  • Figure 35: North America Market Value Share (%) and BPS Analysis by Therapy Type, 2025-2035
  • Figure 36: North America Market Y-o-Y Growth (%) Projections by Therapy Type, 2025-2035
  • Figure 37: North America Market Value (USD Million) Analysis by Session Medium, 2020-2035
  • Figure 38: North America Market Volume (Units) Analysis by Session Medium, 2020-2035
  • Figure 39: North America Market Value Share (%) and BPS Analysis by Session Medium, 2025-2035
  • Figure 40: North America Market Y-o-Y Growth (%) Projections by Session Medium, 2025-2035
  • Figure 41: North America Market Value (USD Million) Analysis by End Use, 2020-2035
  • Figure 42: North America Market Volume (Units) Analysis by End Use, 2020-2035
  • Figure 43: North America Market Value Share (%) and BPS Analysis by End Use, 2025-2035
  • Figure 44: North America Market Y-o-Y Growth (%) Projections by End Use, 2025-2035
  • Figure 45: North America Market Attractiveness by Therapy Type, 2025-2035
  • Figure 46: North America Market Attractiveness by Session Medium, 2025-2035
  • Figure 47: North America Market Attractiveness by End Use, 2025-2035
  • Figure 48: North America Market Attractiveness by Country, 2025-2035
  • Figure 49: Latin America Market Value (USD Million) by Therapy Type, 2025-2035
  • Figure 50: Latin America Market Value (USD Million) by Session Medium, 2025-2035
  • Figure 51: Latin America Market Value (USD Million) by End Use, 2025-2035
  • Figure 52: Latin America Market Value (USD Million) by Country, 2025-2035
  • Figure 53: Latin America Market Value (USD Million) Analysis by Country, 2020-2035
  • Figure 54: Latin America Market Volume (Units) Analysis by Country, 2020-2035
  • Figure 55: Latin America Market Value Share (%) and BPS Analysis by Country, 2025-2035
  • Figure 56: Latin America Market Y-o-Y Growth (%) Projections by Country, 2025-2035
  • Figure 57: Latin America Market Value (USD Million) Analysis by Therapy Type, 2020-2035
  • Figure 58: Latin America Market Volume (Units) Analysis by Therapy Type, 2020-2035
  • Figure 59: Latin America Market Value Share (%) and BPS Analysis by Therapy Type, 2025-2035
  • Figure 60: Latin America Market Y-o-Y Growth (%) Projections by Therapy Type, 2025-2035
  • Figure 61: Latin America Market Value (USD Million) Analysis by Session Medium, 2020-2035
  • Figure 62: Latin America Market Volume (Units) Analysis by Session Medium, 2020-2035
  • Figure 63: Latin America Market Value Share (%) and BPS Analysis by Session Medium, 2025-2035
  • Figure 64: Latin America Market Y-o-Y Growth (%) Projections by Session Medium, 2025-2035
  • Figure 65: Latin America Market Value (USD Million) Analysis by End Use, 2020-2035
  • Figure 66: Latin America Market Volume (Units) Analysis by End Use, 2020-2035
  • Figure 67: Latin America Market Value Share (%) and BPS Analysis by End Use, 2025-2035
  • Figure 68: Latin America Market Y-o-Y Growth (%) Projections by End Use, 2025-2035
  • Figure 69: Latin America Market Attractiveness by Therapy Type, 2025-2035
  • Figure 70: Latin America Market Attractiveness by Session Medium, 2025-2035
  • Figure 71: Latin America Market Attractiveness by End Use, 2025-2035
  • Figure 72: Latin America Market Attractiveness by Country, 2025-2035
  • Figure 73: Europe Market Value (USD Million) by Therapy Type, 2025-2035
  • Figure 74: Europe Market Value (USD Million) by Session Medium, 2025-2035
  • Figure 75: Europe Market Value (USD Million) by End Use, 2025-2035
  • Figure 76: Europe Market Value (USD Million) by Country, 2025-2035
  • Figure 77: Europe Market Value (USD Million) Analysis by Country, 2020-2035
  • Figure 78: Europe Market Volume (Units) Analysis by Country, 2020-2035
  • Figure 79: Europe Market Value Share (%) and BPS Analysis by Country, 2025-2035
  • Figure 80: Europe Market Y-o-Y Growth (%) Projections by Country, 2025-2035
  • Figure 81: Europe Market Value (USD Million) Analysis by Therapy Type, 2020-2035
  • Figure 82: Europe Market Volume (Units) Analysis by Therapy Type, 2020-2035
  • Figure 83: Europe Market Value Share (%) and BPS Analysis by Therapy Type, 2025-2035
  • Figure 84: Europe Market Y-o-Y Growth (%) Projections by Therapy Type, 2025-2035
  • Figure 85: Europe Market Value (USD Million) Analysis by Session Medium, 2020-2035
  • Figure 86: Europe Market Volume (Units) Analysis by Session Medium, 2020-2035
  • Figure 87: Europe Market Value Share (%) and BPS Analysis by Session Medium, 2025-2035
  • Figure 88: Europe Market Y-o-Y Growth (%) Projections by Session Medium, 2025-2035
  • Figure 89: Europe Market Value (USD Million) Analysis by End Use, 2020-2035
  • Figure 90: Europe Market Volume (Units) Analysis by End Use, 2020-2035
  • Figure 91: Europe Market Value Share (%) and BPS Analysis by End Use, 2025-2035
  • Figure 92: Europe Market Y-o-Y Growth (%) Projections by End Use, 2025-2035
  • Figure 93: Europe Market Attractiveness by Therapy Type, 2025-2035
  • Figure 94: Europe Market Attractiveness by Session Medium, 2025-2035
  • Figure 95: Europe Market Attractiveness by End Use, 2025-2035
  • Figure 96: Europe Market Attractiveness by Country, 2025-2035
  • Figure 97: East Asia Market Value (USD Million) by Therapy Type, 2025-2035
  • Figure 98: East Asia Market Value (USD Million) by Session Medium, 2025-2035
  • Figure 99: East Asia Market Value (USD Million) by End Use, 2025-2035
  • Figure 100: East Asia Market Value (USD Million) by Country, 2025-2035
  • Figure 101: East Asia Market Value (USD Million) Analysis by Country, 2020-2035
  • Figure 102: East Asia Market Volume (Units) Analysis by Country, 2020-2035
  • Figure 103: East Asia Market Value Share (%) and BPS Analysis by Country, 2025-2035
  • Figure 104: East Asia Market Y-o-Y Growth (%) Projections by Country, 2025-2035
  • Figure 105: East Asia Market Value (USD Million) Analysis by Therapy Type, 2020-2035
  • Figure 106: East Asia Market Volume (Units) Analysis by Therapy Type, 2020-2035
  • Figure 107: East Asia Market Value Share (%) and BPS Analysis by Therapy Type, 2025-2035
  • Figure 108: East Asia Market Y-o-Y Growth (%) Projections by Therapy Type, 2025-2035
  • Figure 109: East Asia Market Value (USD Million) Analysis by Session Medium, 2020-2035
  • Figure 110: East Asia Market Volume (Units) Analysis by Session Medium, 2020-2035
  • Figure 111: East Asia Market Value Share (%) and BPS Analysis by Session Medium, 2025-2035
  • Figure 112: East Asia Market Y-o-Y Growth (%) Projections by Session Medium, 2025-2035
  • Figure 113: East Asia Market Value (USD Million) Analysis by End Use, 2020-2035
  • Figure 114: East Asia Market Volume (Units) Analysis by End Use, 2020-2035
  • Figure 115: East Asia Market Value Share (%) and BPS Analysis by End Use, 2025-2035
  • Figure 116: East Asia Market Y-o-Y Growth (%) Projections by End Use, 2025-2035
  • Figure 117: East Asia Market Attractiveness by Therapy Type, 2025-2035
  • Figure 118: East Asia Market Attractiveness by Session Medium, 2025-2035
  • Figure 119: East Asia Market Attractiveness by End Use, 2025-2035
  • Figure 120: East Asia Market Attractiveness by Country, 2025-2035
  • Figure 121: South Asia & Pacific Market Value (USD Million) by Therapy Type, 2025-2035
  • Figure 122: South Asia & Pacific Market Value (USD Million) by Session Medium, 2025-2035
  • Figure 123: South Asia & Pacific Market Value (USD Million) by End Use, 2025-2035
  • Figure 124: South Asia & Pacific Market Value (USD Million) by Country, 2025-2035
  • Figure 125: South Asia & Pacific Market Value (USD Million) Analysis by Country, 2020-2035
  • Figure 126: South Asia & Pacific Market Volume (Units) Analysis by Country, 2020-2035
  • Figure 127: South Asia & Pacific Market Value Share (%) and BPS Analysis by Country, 2025-2035
  • Figure 128: South Asia & Pacific Market Y-o-Y Growth (%) Projections by Country, 2025-2035
  • Figure 129: South Asia & Pacific Market Value (USD Million) Analysis by Therapy Type, 2020-2035
  • Figure 130: South Asia & Pacific Market Volume (Units) Analysis by Therapy Type, 2020-2035
  • Figure 131: South Asia & Pacific Market Value Share (%) and BPS Analysis by Therapy Type, 2025-2035
  • Figure 132: South Asia & Pacific Market Y-o-Y Growth (%) Projections by Therapy Type, 2025-2035
  • Figure 133: South Asia & Pacific Market Value (USD Million) Analysis by Session Medium, 2020-2035
  • Figure 134: South Asia & Pacific Market Volume (Units) Analysis by Session Medium, 2020-2035
  • Figure 135: South Asia & Pacific Market Value Share (%) and BPS Analysis by Session Medium, 2025-2035
  • Figure 136: South Asia & Pacific Market Y-o-Y Growth (%) Projections by Session Medium, 2025-2035
  • Figure 137: South Asia & Pacific Market Value (USD Million) Analysis by End Use, 2020-2035
  • Figure 138: South Asia & Pacific Market Volume (Units) Analysis by End Use, 2020-2035
  • Figure 139: South Asia & Pacific Market Value Share (%) and BPS Analysis by End Use, 2025-2035
  • Figure 140: South Asia & Pacific Market Y-o-Y Growth (%) Projections by End Use, 2025-2035
  • Figure 141: South Asia & Pacific Market Attractiveness by Therapy Type, 2025-2035
  • Figure 142: South Asia & Pacific Market Attractiveness by Session Medium, 2025-2035
  • Figure 143: South Asia & Pacific Market Attractiveness by End Use, 2025-2035
  • Figure 144: South Asia & Pacific Market Attractiveness by Country, 2025-2035
  • Figure 145: Middle East and Africa Market Value (USD Million) by Therapy Type, 2025-2035
  • Figure 146: Middle East and Africa Market Value (USD Million) by Session Medium, 2025-2035
  • Figure 147: Middle East and Africa Market Value (USD Million) by End Use, 2025-2035
  • Figure 148: Middle East and Africa Market Value (USD Million) by Country, 2025-2035
  • Figure 149: Middle East and Africa Market Value (USD Million) Analysis by Country, 2020-2035
  • Figure 150: Middle East and Africa Market Volume (Units) Analysis by Country, 2020-2035
  • Figure 151: Middle East and Africa Market Value Share (%) and BPS Analysis by Country, 2025-2035
  • Figure 152: Middle East and Africa Market Y-o-Y Growth (%) Projections by Country, 2025-2035
  • Figure 153: Middle East and Africa Market Value (USD Million) Analysis by Therapy Type, 2020-2035
  • Figure 154: Middle East and Africa Market Volume (Units) Analysis by Therapy Type, 2020-2035
  • Figure 155: Middle East and Africa Market Value Share (%) and BPS Analysis by Therapy Type, 2025-2035
  • Figure 156: Middle East and Africa Market Y-o-Y Growth (%) Projections by Therapy Type, 2025-2035
  • Figure 157: Middle East and Africa Market Value (USD Million) Analysis by Session Medium, 2020-2035
  • Figure 158: Middle East and Africa Market Volume (Units) Analysis by Session Medium, 2020-2035
  • Figure 159: Middle East and Africa Market Value Share (%) and BPS Analysis by Session Medium, 2025-2035
  • Figure 160: Middle East and Africa Market Y-o-Y Growth (%) Projections by Session Medium, 2025-2035
  • Figure 161: Middle East and Africa Market Value (USD Million) Analysis by End Use, 2020-2035
  • Figure 162: Middle East and Africa Market Volume (Units) Analysis by End Use, 2020-2035
  • Figure 163: Middle East and Africa Market Value Share (%) and BPS Analysis by End Use, 2025-2035
  • Figure 164: Middle East and Africa Market Y-o-Y Growth (%) Projections by End Use, 2025-2035
  • Figure 165: Middle East and Africa Market Attractiveness by Therapy Type, 2025-2035
  • Figure 166: Middle East and Africa Market Attractiveness by Session Medium, 2025-2035
  • Figure 167: Middle East and Africa Market Attractiveness by End Use, 2025-2035
  • Figure 168: Middle East and Africa Market Attractiveness by Country, 2025-2035

Frequently Asked Questions

How big is the Global Telehealth Therapy Services Market in 2025?

The global market is estimated at USD 8,824.3 million in 2025.

What will be the size of the Global Telehealth Therapy Services Market in 2035?

The market is projected to reach USD 18,541.2 million by 2035.

How much will be the Global Telehealth Therapy Services Market growth between 2025 and 2035?

The market is expected to grow at a 7.7% CAGR between 2025 and 2035.

What are the key product/service types in the Global Telehealth Therapy Services Market?

Key service categories include Therapy Type (CBT, Psychodynamic, Person-Centered), Session Medium (Video Conferencing, Instant Messaging/Chat, Telephone), and End Use (Residential, Commercial).

Which segment will contribute a significant share in 2025?

By session medium, Video Conferencing is set to command 23.8% share in 2025 (≈ USD 2,100.2 million). By therapy type, CBT leads with 35.7% (≈ USD 3,150.3 million); by end use, Residential holds 65.3% (≈ USD 5,762.3 million).

Explore Similar Insights

Future Market Insights

Telehealth Therapy Services Market