TerraCotta Clay for Detoxification Market Size and Share Forecast Outlook 2025 to 2035

The global TerraCotta Clay for Detoxification Market is expected to record a valuation of USD 1,122.1 million in 2025 and USD 3,301.3 million in 2035, with an increase of USD 2,179.2 million, which equals a growth of nearly 194% over the decade. The overall expansion represents a CAGR of 11.4% and a 2.9X increase in market size.
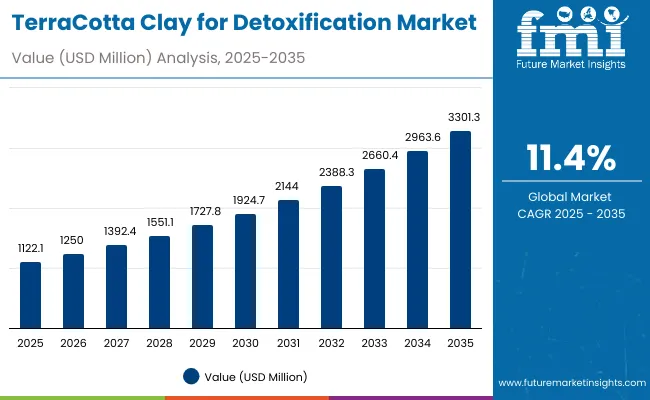
Quick Stats for Global TerraCotta Clay for Detoxification Market

  • TerraCotta Clay for Detoxification Market Value (2025): USD 1,122.1 million
  • TerraCotta Clay for Detoxification Market Forecast Value (2035): USD 3,301.3 million
  • TerraCotta Clay for Detoxification Market Forecast CAGR: 11.4%
  • Leading Segment in Global TerraCotta Clay for Detoxification Market in 2025: Terracotta-rich kaolinitic clays (46%)
  • Key Growth Regions in the Global TerraCotta Clay for Detoxification Market: East Asia, South Asia & Pacific, Europe
  • Top Key Players in Global TerraCotta Clay for Detoxification Market: L’Oréal Paris, The Body Shop, Kiehl’s, Innisfree, L’Oréal Garnier, L’Oréal La Roche-Posay, Shiseido, Freeman Beauty, Cattier, Himalaya

Terracotta Clay For Detoxification Market

Global TerraCotta Clay for Detoxification Market Key Takeaways

Metric Value
Global TerraCotta Clay for Detoxification Market Estimated Value in (2025E) USD 1,122.1 million
Global TerraCotta Clay for Detoxification Market Forecast Value in (2035F) USD 3,301.3 million
Forecast CAGR (2025 to 2035) 11.4%

During the first five-year period from 2025 to 2030, the market increases from USD 1,122.1 million to USD 1,924.7 million, adding USD 802.6 million, which accounts for 36.8% of the total decade growth. This phase records steady adoption across beauty masks, scrubs, and spa-based body wraps, driven by consumer preference for natural detoxifying and pore purifying functions. Wash-off masks dominate this period as they cater to over 49% of beauty and personal care applications requiring deep-cleaning and instant results, making them a staple in both retail and professional skincare routines.

The second half from 2030 to 2035 contributes USD 1,376.6 million, equal to 63.2% of total growth, as the market jumps from USD 1,924.7 million to USD 3,301.3 million. This acceleration is powered by the widespread adoption of clean-label, vegan-certified, and sensitive-skin-friendly formulations. Countries such as China and India, with CAGRs of 16.4% and 18.5% respectively, drive much of this expansion, positioning Asia-Pacific as the global growth hub. Beyond facial skincare, the body masks & wraps segment gains momentum in wellness spas and holistic detoxification therapies. Retail diversification across e-commerce and specialty beauty chains ensures recurring demand, while mineral-origin claims strengthen the brand positioning of leading companies.

From 2020 to 2024, the global TerraCotta Clay for Detoxification Market grew steadily as consumer adoption was primarily driven by hardware-like formulations of traditional clay masks and kaolin-rich blends. During this period, the competitive landscape was dominated by multinational skincare brands controlling nearly 70-75% of global revenue, with leaders such as L’Oréal, Shiseido, and Innisfree focusing on clay-based products marketed under detoxifying and oil-control claims. Competitive differentiation relied on natural authenticity, brand heritage, and mineral sourcing credibility, while newer clean-label formats had minimal traction, contributing less than 15% of the total market value.

Demand for TerraCotta Clay detox products expands to USD 1,122.1 million in 2025, and the revenue mix begins shifting as vegan, fragrance-free, and sensitive-skin claims gain wider appeal. Traditional multinational leaders face rising competition from regional and niche players, especially in Asia, where Cattier, Himalaya, and K-beauty-inspired brands capitalize on heritage positioning. Major incumbents are pivoting towards hybrid models, offering clay-based detoxification products with added botanicals, probiotics, and mineral supplements to retain relevance. Emerging entrants specializing in eco-certified sourcing, clean beauty positioning, and digital-first distribution are gaining share rapidly. The competitive advantage is moving away from brand legacy alone to sustainability, certification, and omnichannel retail strategy.

Why the Global TerraCotta Clay for Detoxification Market is growing?

Advances in clay sourcing and formulation technology have improved detoxification efficiency and skin compatibility, allowing for more effective pore purification and oil control across diverse skin types. Wash-off clay masks have gained popularity due to their instant results, mineral replenishment, and suitability for at-home spa routines. The rise of terracotta-rich kaolinitic clays has contributed to enhanced absorption, smoother texture, and broad application in both mass retail and specialty salons. Consumer industries such as cosmetics, wellness spas, and dermatological care are driving demand for clay detoxification products that can integrate seamlessly into existing skincare and wellness regimens.

Expansion of clean beauty, vegan-certified claims, and digital-first e-commerce strategies has fueled market growth. Innovations in formulation science (blending bentonite with montmorillonite, and iron-oxide clays with antioxidants) are expected to open new application areas. Segment growth is expected to be led by terracotta-rich kaolinitic clays, detoxifying & pore purifying functions, and wash-off masks due to their proven effectiveness and adaptability across both developed and emerging markets.

Segmental Analysis

The market is segmented by clay origin, function, product type, channel, claim, and geography. Clay origin includes terracotta-rich kaolinitic clays, illite/montmorillonite blends, red ochre (iron-oxide) clays, and bentonite-enriched clay systems, highlighting the diversity of raw material bases driving adoption. Function classification covers detoxifying & pore purifying, oil control & mattifying, soothing & redness reduction, and mineral remineralization, catering to specific consumer skincare needs. Based on product type, the segmentation includes wash-off masks, cleansers/scrubs, leave-on spot treatments, and body masks & wraps. Distribution channels encompass e-commerce, mass retail, pharmacies/drugstores, specialty beauty retail, and spas/salons. Claims focus on natural/mineral origin, fragrance-free/sensitive-skin, clean-label, and vegan attributes. Regionally, the scope spans North America, Latin America, Europe, East Asia, South Asia & Pacific, and Middle East & Africa, with China and India emerging as the fastest-growing markets.
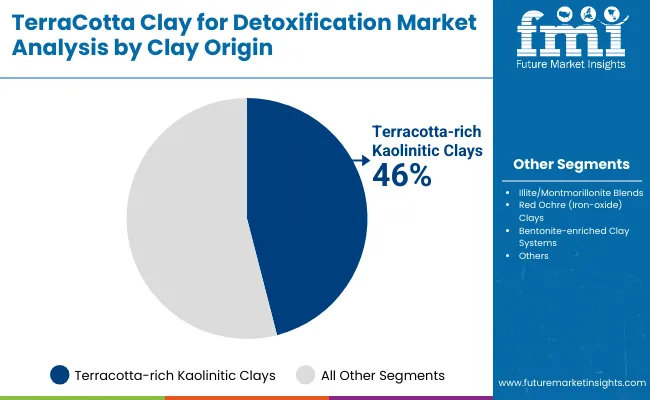
Insights into the Clay Origin Segment with Terracotta-rich Kaolinitic Clays Leading in Market Share

Terracotta Clay For Detoxification Market By Clay Origin

Clay Origin Value Share% 2025
Terracotta-rich kaolinitic clays 46%
Others 54.0%

The terracotta-rich kaolinitic clays segment is projected to contribute 46% of the global TerraCotta Clay for Detoxification Market revenue in 2025, maintaining its lead as the dominant clay origin category. This is driven by the widespread consumer demand for kaolin-based detoxifying masks and cleansers known for their gentle yet powerful ability to remove impurities, absorb excess oil, and purify pores without irritating the skin. Terracotta-rich formulations also appeal to consumers due to their heritage positioning and perception as mineral-rich, natural detoxifiers.

The segment’s growth is further supported by the expansion of clean-label beauty trends, where kaolin-rich terracotta clays are favored as safe, skin-friendly options that can be marketed under sensitive-skin claims. As brands continue to enhance clay formulations by blending terracotta-rich bases with antioxidants, botanicals, and functional additives, this segment is expected to retain its position as the backbone of detoxification-focused skincare products throughout the forecast period.
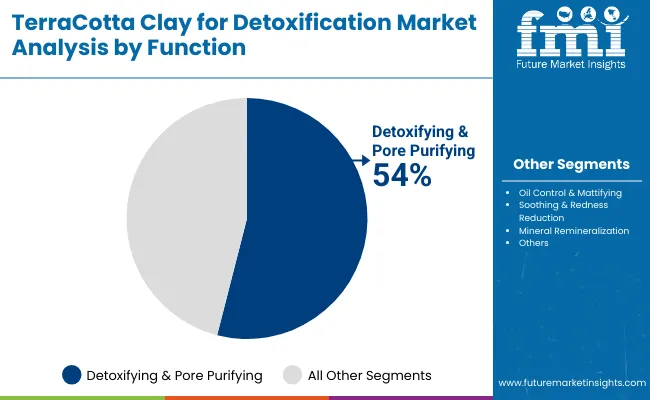
Insights into the Function Segment with Detoxifying & Pore Purifying Dominating the Demand

Terracotta Clay For Detoxification Market By Function

Function Value Share% 2025
Detoxifying & pore purifying 54%
Others 46.0%

The detoxifying & pore purifying function segment is forecasted to hold 54% of the market share in 2025, led by its strong consumer adoption across masks, scrubs, and spa-based treatments. These formulations are favored for their high efficacy in clearing clogged pores, removing toxins, and refreshing the skin, making them a universal solution for both oily and combination skin types.

Their versatility across daily skincare routines and premium spa therapies has facilitated widespread adoption globally. The segment’s growth is also reinforced by rising consumer awareness of urban pollution and environmental aggressors, which has heightened demand for deep detoxification solutions. As more consumers seek instant results with visible skin clarity, detoxifying and pore purifying claims are expected to continue their dominance in the global TerraCotta Clay for Detoxification Market.
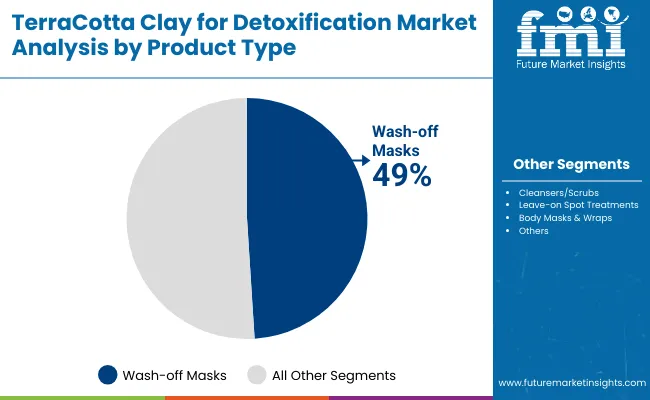
Insights into the Product Type Segment with Wash-off Masks Leading in Usage

Terracotta Clay For Detoxification Market By Product Type

Product Type Value Share% 2025
Wash-off masks 49%
Others 51.0%

The wash-off masks segment is projected to account for 49% of the global TerraCotta Clay for Detoxification Market revenue in 2025, establishing it as the leading product type. Wash-off clay masks are preferred for their instant detoxifying action, ease of use, and visible results after a single application, which makes them highly appealing to both young and mature consumer groups.

Their suitability for DIY home treatments, spa-inspired rituals, and mass retail distribution has made them a cornerstone of the clay detox market. Developments in formulation science—such as enhanced spreadability, faster drying times, and added botanical extracts have further improved the consumer experience. Given their strong combination of affordability, efficacy, and global accessibility, wash-off masks are expected to maintain their leading role in the global TerraCotta Clay for Detoxification Market.

What are the Drivers, Restraints, and Key Trends of the Global TerraCotta Clay for Detoxification Market?

Drivers

Rising Popularity of Mineral-Based Detoxification Products in Asia-Pacific

One of the strongest growth drivers is the cultural and consumer preference for clay and mineral-based skincare in Asia-Pacific, particularly in China and India. Both countries are registering some of the fastest CAGRs globally (China at 16.4%, India at 18.5%). Historically, clay masks and mud packs have deep roots in Ayurvedic, herbal, and Traditional Chinese Medicine practices. This cultural familiarity gives terracotta clay a natural trust advantage, allowing brands to position their products as both modern and heritage-driven. Combined with the rapid growth of e-commerce channels in Asia-Pacific, these products are penetrating younger demographics who seek affordable, effective detox solutions. Global brands are increasingly localizing terracotta clay products for Asian consumers, emphasizing detoxifying, pore-purifying, and mattifying functions, which aligns with regional skin concerns like oiliness and pollution exposure.

Expansion of Multi-Claim Formulations in Premium and Mass Retail

Another major driver is the shift from single-function clay masks to multi-claim detoxification products. Today’s consumers are not only looking for pore cleansing but also for redness reduction, oil control, and mineral replenishment in one product. This has led to the innovation of hybrid terracotta clay products—such as detoxifying masks infused with botanicals, hyaluronic acid, and probiotics. Premium skincare brands are leveraging this by promoting multi-layered benefits in specialty retail and spas, while mass-market players are pushing affordable versions in drugstores and online channels. This multi-claim appeal increases consumer loyalty and repeat purchases, especially as consumers seek value-driven yet multifunctional solutions. The result is higher shelf space allocation for clay detox products in both developed and emerging markets.

Restraints

Raw Material Quality Variability and Sourcing Challenges

Unlike synthetic skincare ingredients, terracotta clays and their blends (kaolinitic, illite/montmorillonite, red ochre, bentonite) vary significantly depending on their geological source and mineral composition. This leads to inconsistency in product performance such as texture, absorption capacity, and color uniformity. For global brands, ensuring consistent sourcing and quality across multiple countries remains a challenge. Moreover, environmental regulations in Europe and North America around clay mining, sustainability, and traceability are tightening, which increases costs for companies attempting to certify eco-friendly and clean-label clays. This could restrain smaller and mid-sized players that lack diversified supply chains.

Rising Competition from Synthetic and Alternative Detox Ingredients

Although clay detox products are gaining traction, they face competition from synthetic detoxification technologies and alternative natural ingredients like activated charcoal, volcanic ash, and enzyme-based exfoliants. Many of these alternatives are marketed as more lightweight, customizable, or suitable for sensitive skin, which can limit clay’s appeal among specific consumer groups. For example, fragrance-free or ultra-sensitive consumers in Western markets may prefer milder synthetic formulations that avoid the tightening effect of clays. This competitive overlap may restrain clay’s market share in certain premium skincare categories, especially if innovations in synthetic detox formulations outpace advancements in clay-based systems.

Key Trends

Surge in E-commerce and Digital-First Distribution Models

E-commerce has emerged as one of the most powerful trends shaping the global TerraCotta Clay for Detoxification Market. Brands are leveraging direct-to-consumer (D2C) platforms, influencer marketing, and subscription models to push clay detoxification products. In China, cross-border e-commerce platforms such as Tmall Global are enabling international clay-based brands to tap into young Gen Z and millennial buyers with instant access. In the USA and Europe, social media campaigns highlighting before-and-after detox mask results have created viral product demand. This trend not only lowers distribution costs but also enhances data-driven personalization, enabling companies to launch niche SKUs (vegan, fragrance-free, mineral origin) quickly into the market.

Integration of TerraCotta Clay into Body Care and Spa-Based Rituals

A second trend is the extension of terracotta clay detox products beyond facial skincare into body care, wellness rituals, and spa services. While facial masks dominate, clay body wraps and detox scrubs are rapidly gaining momentum in luxury spas and wellness resorts across Europe, North America, and the Middle East. These products emphasize whole-body detoxification, remineralization, and stress relief, aligning with the global wellness movement. Additionally, at-home consumers are adopting body-focused terracotta clay products marketed as part of holistic detox kits, which combine scrubs, wraps, and leave-on treatments. This diversification of application points enhances the premium positioning of clay products and creates new revenue streams beyond the traditional facial skincare category.
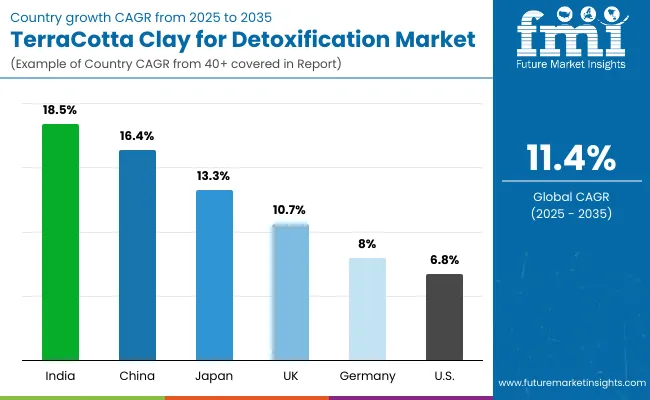
Analysis of Global TerraCotta Clay for Detoxification Market By Key Countries

Country Wise Terracotta Clay For Detoxification Market

Countries Estimated CAGR (2025 to 2035)
China 16.4%
USA 6.8%
India 18.5%
UK 10.7%
Germany 8.0%
Japan 13.3%

The global TerraCotta Clay for Detoxification Market shows strong geographical divergence, with India (18.5%) and China (16.4%) emerging as the fastest-growing markets between 2025 and 2035. Growth in these regions is underpinned by cultural familiarity with clay-based skincare rituals, high levels of urban pollution driving demand for detoxifying solutions, and the affordability of clay products that resonate with mass-market consumers. India in particular benefits from the integration of clay-based detox products into Ayurvedic and herbal beauty systems, while China’s rapid digital retail expansion enables premium and mass brands alike to penetrate younger demographics. Japan, with a CAGR of 13.3%, also stands out as a high-growth market where terracotta clay products align with J-beauty’s focus on minimalist, natural, and functional formulations, ensuring widespread adoption across both premium and everyday skincare categories.

In comparison, developed Western markets such as the USA (6.8%), Germany (8.0%), and the UK (10.7%) are projected to grow at steadier but more moderate rates. In these regions, clay detox products compete with a broader set of synthetic and alternative natural detox solutions, such as charcoal, enzyme-based exfoliants, and probiotic skincare. However, demand is reinforced by clean beauty trends, vegan positioning, and sensitive-skin product launches, particularly in the UK where natural and cruelty-free claims resonate strongly with consumers. Germany’s growth is supported by its well-developed pharmacy and drugstore distribution network, while the USA continues to account for a significant share of the global market due to mass retail adoption and strong brand portfolios from multinational leaders like L’Oréal and Freeman Beauty. This demonstrates that while growth momentum is highest in Asia, Western markets remain critical in maintaining global balance and scale for leading companies.
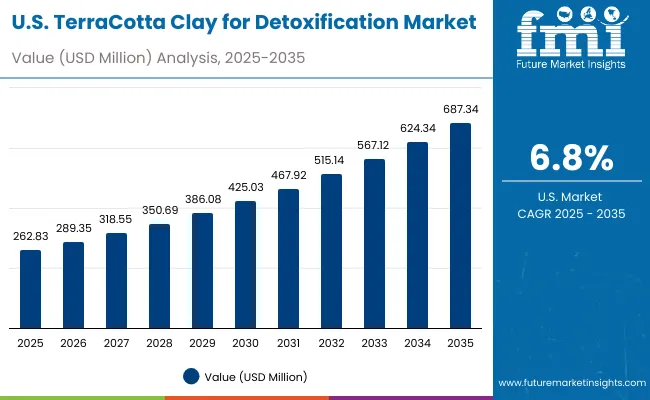
Sales Outlook for TerraCotta Clay for Detoxification in the United States

Usa Terracotta Clay For Detoxification Market

Year USA TerraCotta Clay for Detoxification Market (USD Million)
2025 262.83
2026 289.35
2027 318.55
2028 350.69
2029 386.08
2030 425.03
2031 467.92
2032 515.14
2033 567.12
2034 624.34
2035 687.34

The TerraCotta Clay for Detoxification Market in the United States is projected to grow at a CAGR of 6.8%, supported by rising demand for clean-label, mineral-origin skincare products. Mass retail and pharmacies remain the primary channels, with established players like L’Oréal Garnier, La Roche-Posay, and Freeman Beauty driving growth through affordable, accessible formats. The detoxifying & pore purifying function dominates as urban consumers increasingly seek solutions for environmental stressors and pollution exposure. Premium growth is also observed in sensitive-skin, fragrance-free claims, where dermatology-linked brands play a strong role.

  • Mass retail and drugstores are the largest outlets for clay detox masks and cleansers.
  • Premium adoption in fragrance-free and sensitive-skin categories is expanding.
  • Multinational brands leverage hybrid models, blending clay with botanicals and actives.

Growth and Expansion Outlook for TerraCotta Clay for Detoxification in the United Kingdom

The TerraCotta Clay for Detoxification Market in the United Kingdom is expected to grow at a CAGR of 10.7%, driven by high adoption in vegan, cruelty-free, and clean-label segments. UK consumers are increasingly drawn to brands like The Body Shop, Cattier, and L’Oréal Paris, which emphasize sustainability and eco-friendly sourcing. The market is supported by robust specialty retail channels and pharmacy chains, where terracotta clay detox products are marketed as affordable luxuries with natural positioning. Heritage-inspired and mineral-origin claims resonate strongly with consumers, while spas and salons integrate clay body wraps into wellness rituals.

  • Clean-label and vegan claims are particularly important in UK consumer choice.
  • Specialty beauty retail channels drive premium growth in detox masks and scrubs.
  • Spa and salon services incorporate clay-based body wraps and detox rituals.

Growth and Expansion Outlook for TerraCotta Clay for Detoxification in India

India is witnessing rapid growth in the TerraCotta Clay for Detoxification Market, which is forecast to expand at a CAGR of 18.5% through 2035, the highest globally. Growth is supported by the integration of clay into Ayurvedic and herbal beauty traditions, where local brands such as Himalaya dominate, alongside global players expanding in tier-2 and tier-3 cities. E-commerce penetration and rising awareness among middle-class consumers are accelerating adoption, particularly for oil-control and mattifying functions suited to Indian skin types and climates. Additionally, body wraps and spa-inspired clay rituals are gaining ground in urban wellness centers, reinforcing both premium and mass-market uptake.

  • Local and herbal brands are leveraging Ayurvedic heritage for clay-based detoxification.
  • E-commerce penetration in tier-2 cities is driving affordability and accessibility.
  • Oil-control and mattifying clay claims dominate due to regional climatic conditions.

Sales Outlook for TerraCotta Clay for Detoxification in China

The TerraCotta Clay for Detoxification Market in China is expected to grow at a CAGR of 16.4%, positioning it as one of the fastest-growing markets globally. Growth is led by young millennial and Gen Z consumers who favor K-beauty and C-beauty inspired clay masks for detoxifying and pore-purifying functions. Domestic and international brands alike are leveraging cross-border e-commerce platforms such as Tmall Global to rapidly distribute products. Municipal and urban pollution challenges are also driving consumer preference for deep detoxification masks and scrubs. Affordable SKUs from domestic brands complement premium imports, creating a broad consumption base.
  • E-commerce and cross-border platforms are the strongest growth channels.
  • Detoxifying and pore-purifying functions dominate among urban consumers.
  • Competitive domestic brands offer affordable SKUs, expanding adoption nationwide.

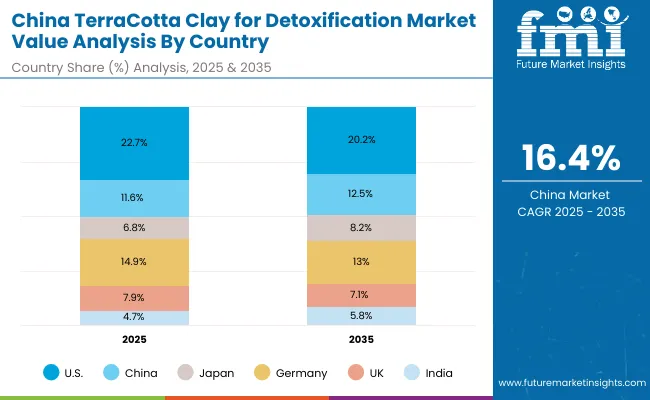
China Terracotta Clay For Detoxification Market By Country

Countries 2025 Share (%)
USA 22.7%
China 11.6%
Japan 6.8%
Germany 14.9%
UK 7.9%
India 4.7%
Countries 2035 Share (%)
USA 20.2%
China 12.5%
Japan 8.2%
Germany 13.0%
UK 7.1%
India 5.8%

Growth Outlook for TerraCotta Clay for Detoxification Market in the United States

Terracotta Clay For Detoxification Market By Clay Origin (2)

USA By Clay Origin Value Share% 2025
Terracotta-rich kaolinitic clays 46%
Others 54.0%

The TerraCotta Clay for Detoxification Market in the United States is projected at USD 262.8 million in 2025. Terracotta-rich kaolinitic clays contribute 46%, while other clay blends account for 54%, reflecting balanced consumer interest in both kaolin-based detoxification and bentonite-enriched or iron-oxide clay variants. The dominance of kaolinitic clays stems from their gentle exfoliating and detoxifying action, which suits USA consumers with sensitive or combination skin types.

Growth is supported by the integration of clay detox masks into dermatology-linked retail chains and the rising popularity of fragrance-free and sensitive-skin formulations. USA consumers are shifting toward products that not only detoxify but also deliver soothing, redness-reducing, and oil-control benefits. With mass retail and drugstore channels serving as the primary outlets, global leaders such as L’Oréal, Garnier, and La Roche-Posay are leveraging their scale to dominate. Over the decade, the USA market is expected to maintain its global leadership, though growth will be slower compared to Asia-Pacific.
  • Market in the USA holds a share of 22.7% in 2025 in the global market.
  • Terracotta-rich kaolinitic clays lead at 46% vs 54% for other blends.
  • Growth is supported by sensitive-skin claims and mass retail adoption.

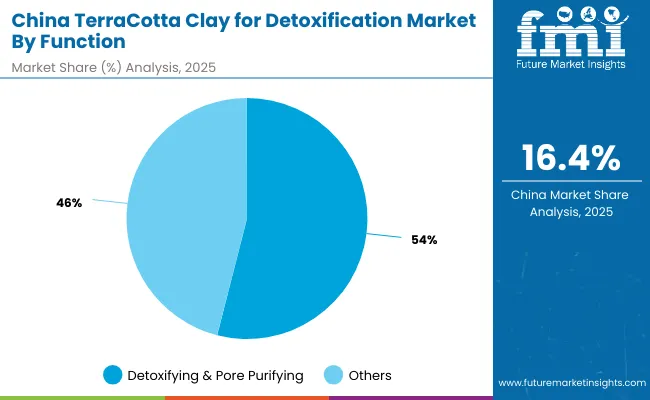
Opportunity Analysis of TerraCotta Clay for Detoxification Market in China

China Terracotta Clay For Detoxification Market By Function

China By Function Value Share% 2025
Detoxifying & pore purifying 54%
Others 46.0%

The TerraCotta Clay for Detoxification Market in China is valued at USD 130.3 million in 2025, with detoxifying & pore purifying products leading at 54%, followed by other functional claims at 46%. The dominance of detoxifying formulations is a direct outcome of China’s urban consumer base facing high pollution levels, where clay masks and scrubs are positioned as essential solutions for deep cleansing and maintaining skin clarity.

This advantage positions detoxifying clay products as the cornerstone of beauty and wellness routines in China. E-commerce platforms such as Tmall and JD.com amplify adoption by providing fast access to international brands like Innisfree, Shiseido, and L’Oréal Paris, while domestic brands offer competitive pricing to penetrate mass-market categories. Premium adoption is also reinforced by spa-inspired rituals and C-beauty product innovation, where hybrid clays infused with botanicals and vitamins appeal to millennial and Gen Z consumers. With a CAGR of 16.4%, China will be among the strongest global growth drivers, surpassing many developed economies in relative expansion.
  • Market size for China in 2025 is USD 130.3 million.
  • Global market share is approximately 11.6% in 2025, rising to 12.5% by 2035.
  • Detoxifying & pore purifying dominates at 54% due to pollution-driven demand.

Competitive Landscape of TerraCotta Clay for Detoxification Market

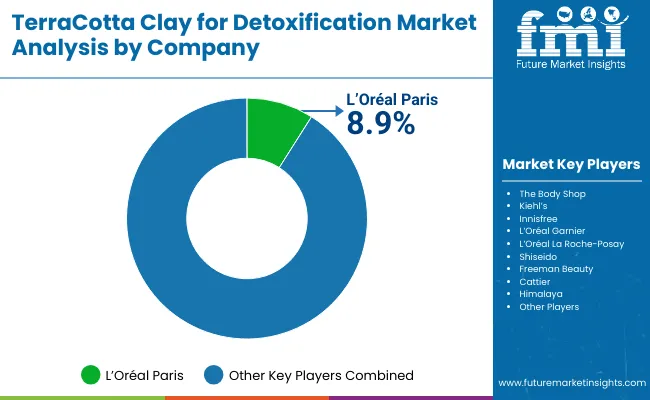
Terracotta Clay For Detoxification Market By Company

Company Global Value Share 2025
L’Oréal Paris 8.9%
Others 91.1%

The TerraCotta Clay for Detoxification Market is moderately fragmented, with multinational beauty conglomerates, mid-sized skincare innovators, and niche heritage brands competing across categories. Global leaders such as L’Oréal Paris, Garnier, La Roche-Posay, and Shiseido hold significant market share, driven by their diversified clay mask portfolios, strong retail distribution, and clean-label brand positioning. Their strategies emphasize sensitive-skin claims, vegan certifications, and hybrid formulations that combine clays with botanicals and active ingredients.

Mid-sized players such as The Body Shop, Kiehl’s, and Innisfree are accelerating adoption by leveraging natural and mineral-origin branding, coupled with sustainability and eco-friendly sourcing narratives. These companies appeal strongly to European and East Asian consumers seeking ethical, cruelty-free beauty products. Niche-focused specialists such as Freeman Beauty, Cattier, and Himalaya provide affordable, heritage-driven formulations, resonating in mass-market and Ayurvedic-inspired segments. Their strength lies in regional adaptability, clean beauty positioning, and affordability, rather than global dominance.

Competitive differentiation is increasingly shifting away from brand legacy and product claims alone toward distribution ecosystem strength, omnichannel marketing, and eco-certification credibility. Brands that can blend heritage, sustainability, and digital-first engagement are expected to gain stronger consumer loyalty over the decade.

Key Developments in Global TerraCotta Clay for Detoxification Market

  • On June 10, 2025, L’Oréal Groupe announced a new collaboration with NVIDIA to accelerate adoption of AI across beauty (including technologies like digital rendering of products), to expand creative possibilities. While this isn’t a terra cotta-clay specific launch, it signals their increasing investment in beauty-tech infrastructure which will likely benefit product innovation including clay and mineral-based lines.
  • Shiseido has been advancing its skin science / material science research in the past two years, focusing on sustainability, “environmental harmony / co-existing technology,” and exploring new materials in R&D. Though I did not find a specific new clay mask or terracotta clay line launch in the public domain, these R&D efforts suggest they are building capacity to innovate in mineral / natural-origin formulations.

Scope of the Report

Item Value
Quantitative Units USD 1,122.1 Million
Clay Origin Terracotta-rich kaolinitic clays, Illite /montmorillonite blends, Red ochre (iron-oxide) clays, and Bentonite-enriched clay systems
Function Detoxifying & pore purifying, Oil control & mattifying, Soothing & redness reduction, and Mineral remineralization
Product Type Wash-off masks, Cleansers/scrubs, Leave-on spot treatments, and Body masks & wraps
Channel E-commerce, Mass retail, Pharmacies/drugstores, Specialty beauty retail, and Spas/salons
Claim Natural/mineral origin, Fragrance-free/sensitive-skin, Clean-label, and Vegan
Regions Covered North America, Europe, Asia-Pacific, Latin America, Middle East & Africa
Country Covered United States, Canada, Germany, France, United Kingdom, China, Japan, India, Brazil, South Africa
Key Companies Profiled L’Oréal Paris, The Body Shop, Kiehl’s, Innisfree, L’Oréal Garnier, L’Oréal La Roche- Posay, Shiseido, Freeman Beauty, Cattier, Himalaya
Additional Attributes Dollar sales by clay origin, function, product type, channel, and claim; adoption trends in detoxifying & pore purifying masks; rising demand for wash-off and body clay products; sector-specific growth in e-commerce, specialty retail, and spas; vegan and fragrance-free product innovation; integration of clay-based detox products in holistic wellness routines; regional growth led by Asia-Pacific markets; and innovations in hybrid formulations blending terracotta clays with botanicals and minerals.

Key Segments

By Clay Origin:

  • Terracotta-rich kaolinitic clays
  • Illite/montmorillonite blends
  • Red ochre (iron-oxide) clays
  • Bentonite-enriched clay systems

By Function:

  • Detoxifying & pore purifying
  • Oil control & mattifying
  • Soothing & redness reduction
  • Mineral remineralization

By Product Type:

  • Wash-off masks
  • Cleansers/scrubs
  • Leave-on spot treatments
  • Body masks & wraps

By Channel:

  • E-commerce
  • Mass retail
  • Pharmacies/drugstores
  • Specialty beauty retail
  • Spas/salons

By Claim:

  • Natural/mineral origin
  • Fragrance-free/sensitive-skin
  • Clean-label
  • Vegan

By Region:

  • North America
  • Latin America
  • Europe
  • East Asia
  • South Asia & Pacific
  • Middle East and Africa

Table of Content

  1. Executive Summary
    • Global Market Outlook
    • Demand-side Trends
    • Supply-side Trends
    • Technology Roadmap Analysis
    • Analysis and Recommendations
  2. Market Overview
    • Market Coverage / Taxonomy
    • Market Definition / Scope / Limitations
  3. Market Background
    • Market Dynamics
      • Drivers
      • Restraints
      • Opportunity
      • Trends
    • Scenario Forecast
      • Demand in Optimistic Scenario
      • Demand in Likely Scenario
      • Demand in Conservative Scenario
    • Opportunity Map Analysis
    • Product Life Cycle Analysis
    • Supply Chain Analysis
    • Investment Feasibility Matrix
    • Value Chain Analysis
    • PESTLE and Porter’s Analysis
    • Regulatory Landscape
    • Regional Parent Market Outlook
    • Production and Consumption Statistics
    • Import and Export Statistics
  4. Global Analysis 2020 to 2024 and Forecast, 2025 to 2035
    • Historical Market Size Value (USD Million) Analysis, 2020 to 2024
    • Current and Future Market Size Value (USD Million) Projections, 2025 to 2035
      • Y-o-Y Growth Trend Analysis
      • Absolute $ Opportunity Analysis
  5. Global Pricing Analysis 2020 to 2024 and Forecast 2025 to 2035
  6. Global Analysis 2020 to 2024 and Forecast 2025 to 2035, By Clay Origin
    • Introduction / Key Findings
    • Historical Market Size Value (USD Million) Analysis By Clay Origin, 2020 to 2024
    • Current and Future Market Size Value (USD Million) Analysis and Forecast By Clay Origin, 2025 to 2035
      • Terracotta-rich kaolinitic clays
      • Illite/montmorillonite blends
      • Red ochre (iron-oxide) clays
      • Bentonite-enriched clay systems
    • Y-o-Y Growth Trend Analysis By Clay Origin, 2020 to 2024
    • Absolute $ Opportunity Analysis By Clay Origin, 2025 to 2035
  7. Global Analysis 2020 to 2024 and Forecast 2025 to 2035, By Function
    • Introduction / Key Findings
    • Historical Market Size Value (USD Million) Analysis By Function, 2020 to 2024
    • Current and Future Market Size Value (USD Million) Analysis and Forecast By Function, 2025 to 2035
      • Detoxifying & pore purifying
      • Oil control & mattifying
      • Soothing & redness reduction
      • Mineral remineralization
    • Y-o-Y Growth Trend Analysis By Function, 2020 to 2024
    • Absolute $ Opportunity Analysis By Function, 2025 to 2035
  8. Global Analysis 2020 to 2024 and Forecast 2025 to 2035, By Product Type
    • Introduction / Key Findings
    • Historical Market Size Value (USD Million) Analysis By Product Type, 2020 to 2024
    • Current and Future Market Size Value (USD Million) Analysis and Forecast By Product Type, 2025 to 2035
      • Wash-off masks
      • Cleansers/scrubs
      • Leave-on spot treatments
      • Body masks & wraps
    • Y-o-Y Growth Trend Analysis By Product Type, 2020 to 2024
    • Absolute $ Opportunity Analysis By Product Type, 2025 to 2035
  9. Global Analysis 2020 to 2024 and Forecast 2025 to 2035, By Channel
    • Introduction / Key Findings
    • Historical Market Size Value (USD Million) Analysis By Channel, 2020 to 2024
    • Current and Future Market Size Value (USD Million) Analysis and Forecast By Channel, 2025 to 2035
      • E-commerce
      • Mass retail
      • Pharmacies/drugstores
      • Specialty beauty retail
      • Spas/salons
    • Y-o-Y Growth Trend Analysis By Channel, 2020 to 2024
    • Absolute $ Opportunity Analysis By Channel, 2025 to 2035
  10. Global Analysis 2020 to 2024 and Forecast 2025 to 2035, By Claim
    • Introduction / Key Findings
    • Historical Market Size Value (USD Million) Analysis By Claim, 2020 to 2024
    • Current and Future Market Size Value (USD Million) Analysis and Forecast By Claim, 2025 to 2035
      • Natural/mineral origin
      • Fragrance-free/sensitive-skin
      • Clean-label
      • Vegan
    • Y-o-Y Growth Trend Analysis By Claim, 2020 to 2024
    • Absolute $ Opportunity Analysis By Claim, 2025 to 2035
  11. Global Analysis 2020 to 2024 and Forecast 2025 to 2035, By Region
    • Introduction
    • Historical Market Size Value (USD Million) Analysis By Region, 2020 to 2024
    • Current Market Size Value (USD Million) Analysis and Forecast By Region, 2025 to 2035
      • North America
      • Latin America
      • Europe
      • East Asia
      • South Asia & Pacific
      • Middle East and Africa
    • Market Attractiveness Analysis By Region
  12. North America Analysis 2020 to 2024 and Forecast 2025 to 2035, By Country
    • Historical Market Size Value (USD Million) Trend Analysis By Market Taxonomy, 2020 to 2024
    • Market Size Value (USD Million) Forecast By Market Taxonomy, 2025 to 2035
      • By Country
        • USA
        • Canada
      • By Clay Origin
      • By Function
      • By Product Type
      • By Channel
      • By Claim
    • Market Attractiveness Analysis
      • By Country
      • By Clay Origin
      • By Function
      • By Product Type
      • By Channel
      • By Claim
    • Key Takeaways
  13. Latin America Analysis 2020 to 2024 and Forecast 2025 to 2035, By Country
    • Historical Market Size Value (USD Million) Trend Analysis By Market Taxonomy, 2020 to 2024
    • Market Size Value (USD Million) Forecast By Market Taxonomy, 2025 to 2035
      • By Country
        • Brazil
        • Mexico
        • Colombia
        • Rest of Latin America
      • By Clay Origin
      • By Function
      • By Product Type
      • By Channel
      • By Claim
    • Market Attractiveness Analysis
      • By Country
      • By Clay Origin
      • By Function
      • By Product Type
      • By Channel
      • By Claim
    • Key Takeaways
  14. Europe Analysis 2020 to 2024 and Forecast 2025 to 2035, By Country
    • Historical Market Size Value (USD Million) Trend Analysis By Market Taxonomy, 2020 to 2024
    • Market Size Value (USD Million) Forecast By Market Taxonomy, 2025 to 2035
      • By Country
        • Germany
        • UK
        • France
        • Italy
        • Spain
        • Belgium
        • Netherlands
        • Nordic
        • Switzerland
        • Russia
        • Poland
        • Rest of Europe
      • By Clay Origin
      • By Function
      • By Product Type
      • By Channel
      • By Claim
    • Market Attractiveness Analysis
      • By Country
      • By Clay Origin
      • By Function
      • By Product Type
      • By Channel
      • By Claim
    • Key Takeaways
  15. East Asia Analysis 2020 to 2024 and Forecast 2025 to 2035, By Country
    • Historical Market Size Value (USD Million) Trend Analysis By Market Taxonomy, 2020 to 2024
    • Market Size Value (USD Million) Forecast By Market Taxonomy, 2025 to 2035
      • By Country
        • China
        • Japan
        • South Korea
      • By Clay Origin
      • By Function
      • By Product Type
      • By Channel
      • By Claim
    • Market Attractiveness Analysis
      • By Country
      • By Clay Origin
      • By Function
      • By Product Type
      • By Channel
      • By Claim
    • Key Takeaways
  16. South Asia & Pacific Analysis 2020 to 2024 and Forecast 2025 to 2035, By Country
    • Historical Market Size Value (USD Million) Trend Analysis By Market Taxonomy, 2020 to 2024
    • Market Size Value (USD Million) Forecast By Market Taxonomy, 2025 to 2035
      • By Country
        • India
        • Thailand
        • Malaysia
        • Indonesia
        • Singapore
        • Vietnam
        • Australia
        • New Zealand
        • Rest of South Asia
      • By Clay Origin
      • By Function
      • By Product Type
      • By Channel
      • By Claim
    • Market Attractiveness Analysis
      • By Country
      • By Clay Origin
      • By Function
      • By Product Type
      • By Channel
      • By Claim
    • Key Takeaways
  17. Middle East and Africa Analysis 2020 to 2024 and Forecast 2025 to 2035, By Country
    • Historical Market Size Value (USD Million) Trend Analysis By Market Taxonomy, 2020 to 2024
    • Market Size Value (USD Million) Forecast By Market Taxonomy, 2025 to 2035
      • By Country
        • Turkey
        • UAE
        • Saudi Arabia
        • Israel
        • Other GCC Countries
        • North Africa
        • South Africa
      • By Clay Origin
      • By Function
      • By Product Type
      • By Channel
      • By Claim
    • Market Attractiveness Analysis
      • By Country
      • By Clay Origin
      • By Function
      • By Product Type
      • By Channel
      • By Claim
    • Key Takeaways
  18. Key Countries Analysis
    • USA
      • Pricing Analysis
      • Market Share Analysis, 2024
        • By Clay Origin
        • By Function
        • By Product Type
        • By Channel
        • By Claim
    • Canada
      • Pricing Analysis
      • Market Share Analysis, 2024
        • By Clay Origin
        • By Function
        • By Product Type
        • By Channel
        • By Claim
    • Mexico
      • Pricing Analysis
      • Market Share Analysis, 2024
        • By Clay Origin
        • By Function
        • By Product Type
        • By Channel
        • By Claim
    • Brazil
      • Pricing Analysis
      • Market Share Analysis, 2024
        • By Clay Origin
        • By Function
        • By Product Type
        • By Channel
        • By Claim
    • Germany
      • Pricing Analysis
      • Market Share Analysis, 2024
        • By Clay Origin
        • By Function
        • By Product Type
        • By Channel
        • By Claim
    • UK
      • Pricing Analysis
      • Market Share Analysis, 2024
        • By Clay Origin
        • By Function
        • By Product Type
        • By Channel
        • By Claim
    • Italy
      • Pricing Analysis
      • Market Share Analysis, 2024
        • By Clay Origin
        • By Function
        • By Product Type
        • By Channel
        • By Claim
    • Spain
      • Pricing Analysis
      • Market Share Analysis, 2024
        • By Clay Origin
        • By Function
        • By Product Type
        • By Channel
        • By Claim
    • France
      • Pricing Analysis
      • Market Share Analysis, 2024
        • By Clay Origin
        • By Function
        • By Product Type
        • By Channel
        • By Claim
    • India
      • Pricing Analysis
      • Market Share Analysis, 2024
        • By Clay Origin
        • By Function
        • By Product Type
        • By Channel
        • By Claim
    • Australia & New Zealand
      • Pricing Analysis
      • Market Share Analysis, 2024
        • By Clay Origin
        • By Function
        • By Product Type
        • By Channel
        • By Claim
    • China
      • Pricing Analysis
      • Market Share Analysis, 2024
        • By Clay Origin
        • By Function
        • By Product Type
        • By Channel
        • By Claim
    • Japan
      • Pricing Analysis
      • Market Share Analysis, 2024
        • By Clay Origin
        • By Function
        • By Product Type
        • By Channel
        • By Claim
    • South Korea
      • Pricing Analysis
      • Market Share Analysis, 2024
        • By Clay Origin
        • By Function
        • By Product Type
        • By Channel
        • By Claim
    • Russia
      • Pricing Analysis
      • Market Share Analysis, 2024
        • By Clay Origin
        • By Function
        • By Product Type
        • By Channel
        • By Claim
    • Poland
      • Pricing Analysis
      • Market Share Analysis, 2024
        • By Clay Origin
        • By Function
        • By Product Type
        • By Channel
        • By Claim
    • Hungary
      • Pricing Analysis
      • Market Share Analysis, 2024
        • By Clay Origin
        • By Function
        • By Product Type
        • By Channel
        • By Claim
    • Kingdom of Saudi Arabia
      • Pricing Analysis
      • Market Share Analysis, 2024
        • By Clay Origin
        • By Function
        • By Product Type
        • By Channel
        • By Claim
    • South Africa
      • Pricing Analysis
      • Market Share Analysis, 2024
        • By Clay Origin
        • By Function
        • By Product Type
        • By Channel
        • By Claim
  19. Market Structure Analysis
    • Competition Dashboard
    • Competition Benchmarking
    • Market Share Analysis of Top Players
      • By Regional
      • By Clay Origin
      • By Function
      • By Product Type
      • By Channel
      • By Claim
  20. Competition Analysis
    • Competition Deep Dive
      • L’Oréal Paris
        • Overview
        • Product Portfolio
        • Profitability by Market Segments (Product/Age /Sales Channel/Region)
        • Sales Footprint
        • Strategy Overview
        • The Body Shop
        • Kiehl’s
        • Innisfree
        • L’Oréal Garnier
        • L’Oréal La Roche-Posay
        • Shiseido
        • Freeman Beauty
        • Cattier
        • Himalaya
    • Assumptions & Acronyms Used
    • Research Methodology

List of Tables

  • Table 1: Global Value (USD Million) Forecast by Region, 2020-2035
  • Table 2: Global Value (USD Million) Forecast by Clay Origin, 2020-2035
  • Table 3: Global Value (USD Million) Forecast by Function, 2020-2035
  • Table 4: Global Value (USD Million) Forecast by Product Type, 2020-2035
  • Table 5: Global Value (USD Million) Forecast by Channel, 2020-2035
  • Table 6: Global Value (USD Million) Forecast by Claim, 2020-2035
  • Table 7: North America Value (USD Million) Forecast by Country, 2020-2035
  • Table 8: North America Value (USD Million) Forecast by Clay Origin, 2020-2035
  • Table 9: North America Value (USD Million) Forecast by Function, 2020-2035
  • Table 10: North America Value (USD Million) Forecast by Product Type, 2020-2035
  • Table 11: North America Value (USD Million) Forecast by Channel, 2020-2035
  • Table 12: North America Value (USD Million) Forecast by Claim, 2020-2035
  • Table 13: Latin America Value (USD Million) Forecast by Country, 2020-2035
  • Table 14: Latin America Value (USD Million) Forecast by Clay Origin, 2020-2035
  • Table 15: Latin America Value (USD Million) Forecast by Function, 2020-2035
  • Table 16: Latin America Value (USD Million) Forecast by Product Type, 2020-2035
  • Table 17: Latin America Value (USD Million) Forecast by Channel, 2020-2035
  • Table 18: Latin America Value (USD Million) Forecast by Claim, 2020-2035
  • Table 19: Europe Value (USD Million) Forecast by Country, 2020-2035
  • Table 20: Europe Value (USD Million) Forecast by Clay Origin, 2020-2035
  • Table 21: Europe Value (USD Million) Forecast by Function, 2020-2035
  • Table 22: Europe Value (USD Million) Forecast by Product Type, 2020-2035
  • Table 23: Europe Value (USD Million) Forecast by Channel, 2020-2035
  • Table 24: Europe Value (USD Million) Forecast by Claim, 2020-2035
  • Table 25: East Asia Value (USD Million) Forecast by Country, 2020-2035
  • Table 26: East Asia Value (USD Million) Forecast by Clay Origin, 2020-2035
  • Table 27: East Asia Value (USD Million) Forecast by Function, 2020-2035
  • Table 28: East Asia Value (USD Million) Forecast by Product Type, 2020-2035
  • Table 29: East Asia Value (USD Million) Forecast by Channel, 2020-2035
  • Table 30: East Asia Value (USD Million) Forecast by Claim, 2020-2035
  • Table 31: South Asia & Pacific Value (USD Million) Forecast by Country, 2020-2035
  • Table 32: South Asia & Pacific Value (USD Million) Forecast by Clay Origin, 2020-2035
  • Table 33: South Asia & Pacific Value (USD Million) Forecast by Function, 2020-2035
  • Table 34: South Asia & Pacific Value (USD Million) Forecast by Product Type, 2020-2035
  • Table 35: South Asia & Pacific Value (USD Million) Forecast by Channel, 2020-2035
  • Table 36: South Asia & Pacific Value (USD Million) Forecast by Claim, 2020-2035
  • Table 37: Middle East and Africa Value (USD Million) Forecast by Country, 2020-2035
  • Table 38: Middle East and Africa Value (USD Million) Forecast by Clay Origin, 2020-2035
  • Table 39: Middle East and Africa Value (USD Million) Forecast by Function, 2020-2035
  • Table 40: Middle East and Africa Value (USD Million) Forecast by Product Type, 2020-2035
  • Table 41: Middle East and Africa Value (USD Million) Forecast by Channel, 2020-2035
  • Table 42: Middle East and Africa Value (USD Million) Forecast by Claim, 2020-2035

List of Figures

  • Figure 1: Global Pricing Analysis
  • Figure 2: Global Value (USD Million) Forecast 2020-2035
  • Figure 3: Global Value Share and BPS Analysis by Clay Origin, 2025 and 2035
  • Figure 4: Global Y-o-Y Growth Comparison by Clay Origin, 2025-2035
  • Figure 5: Global Attractiveness Analysis by Clay Origin
  • Figure 6: Global Value Share and BPS Analysis by Function, 2025 and 2035
  • Figure 7: Global Y-o-Y Growth Comparison by Function, 2025-2035
  • Figure 8: Global Attractiveness Analysis by Function
  • Figure 9: Global Value Share and BPS Analysis by Product Type, 2025 and 2035
  • Figure 10: Global Y-o-Y Growth Comparison by Product Type, 2025-2035
  • Figure 11: Global Attractiveness Analysis by Product Type
  • Figure 12: Global Value Share and BPS Analysis by Channel, 2025 and 2035
  • Figure 13: Global Y-o-Y Growth Comparison by Channel, 2025-2035
  • Figure 14: Global Attractiveness Analysis by Channel
  • Figure 15: Global Value Share and BPS Analysis by Claim, 2025 and 2035
  • Figure 16: Global Y-o-Y Growth Comparison by Claim, 2025-2035
  • Figure 17: Global Attractiveness Analysis by Claim
  • Figure 18: Global Value (USD Million) Share and BPS Analysis by Region, 2025 and 2035
  • Figure 19: Global Y-o-Y Growth Comparison by Region, 2025-2035
  • Figure 20: Global Attractiveness Analysis by Region
  • Figure 21: North America Incremental $ Opportunity, 2025-2035
  • Figure 22: Latin America Incremental $ Opportunity, 2025-2035
  • Figure 23: Europe Incremental $ Opportunity, 2025-2035
  • Figure 24: East Asia Incremental $ Opportunity, 2025-2035
  • Figure 25: South Asia & Pacific Incremental $ Opportunity, 2025-2035
  • Figure 26: Middle East and Africa Incremental $ Opportunity, 2025-2035
  • Figure 27: North America Value Share and BPS Analysis by Country, 2025 and 2035
  • Figure 28: North America Value Share and BPS Analysis by Clay Origin, 2025 and 2035
  • Figure 29: North America Y-o-Y Growth Comparison by Clay Origin, 2025-2035
  • Figure 30: North America Attractiveness Analysis by Clay Origin
  • Figure 31: North America Value Share and BPS Analysis by Function, 2025 and 2035
  • Figure 32: North America Y-o-Y Growth Comparison by Function, 2025-2035
  • Figure 33: North America Attractiveness Analysis by Function
  • Figure 34: North America Value Share and BPS Analysis by Product Type, 2025 and 2035
  • Figure 35: North America Y-o-Y Growth Comparison by Product Type, 2025-2035
  • Figure 36: North America Attractiveness Analysis by Product Type
  • Figure 37: North America Value Share and BPS Analysis by Channel, 2025 and 2035
  • Figure 38: North America Y-o-Y Growth Comparison by Channel, 2025-2035
  • Figure 39: North America Attractiveness Analysis by Channel
  • Figure 40: North America Value Share and BPS Analysis by Claim, 2025 and 2035
  • Figure 41: North America Y-o-Y Growth Comparison by Claim, 2025-2035
  • Figure 42: North America Attractiveness Analysis by Claim
  • Figure 43: Latin America Value Share and BPS Analysis by Country, 2025 and 2035
  • Figure 44: Latin America Value Share and BPS Analysis by Clay Origin, 2025 and 2035
  • Figure 45: Latin America Y-o-Y Growth Comparison by Clay Origin, 2025-2035
  • Figure 46: Latin America Attractiveness Analysis by Clay Origin
  • Figure 47: Latin America Value Share and BPS Analysis by Function, 2025 and 2035
  • Figure 48: Latin America Y-o-Y Growth Comparison by Function, 2025-2035
  • Figure 49: Latin America Attractiveness Analysis by Function
  • Figure 50: Latin America Value Share and BPS Analysis by Product Type, 2025 and 2035
  • Figure 51: Latin America Y-o-Y Growth Comparison by Product Type, 2025-2035
  • Figure 52: Latin America Attractiveness Analysis by Product Type
  • Figure 53: Latin America Value Share and BPS Analysis by Channel, 2025 and 2035
  • Figure 54: Latin America Y-o-Y Growth Comparison by Channel, 2025-2035
  • Figure 55: Latin America Attractiveness Analysis by Channel
  • Figure 56: Latin America Value Share and BPS Analysis by Claim, 2025 and 2035
  • Figure 57: Latin America Y-o-Y Growth Comparison by Claim, 2025-2035
  • Figure 58: Latin America Attractiveness Analysis by Claim
  • Figure 59: Europe Value Share and BPS Analysis by Country, 2025 and 2035
  • Figure 60: Europe Value Share and BPS Analysis by Clay Origin, 2025 and 2035
  • Figure 61: Europe Y-o-Y Growth Comparison by Clay Origin, 2025-2035
  • Figure 62: Europe Attractiveness Analysis by Clay Origin
  • Figure 63: Europe Value Share and BPS Analysis by Function, 2025 and 2035
  • Figure 64: Europe Y-o-Y Growth Comparison by Function, 2025-2035
  • Figure 65: Europe Attractiveness Analysis by Function
  • Figure 66: Europe Value Share and BPS Analysis by Product Type, 2025 and 2035
  • Figure 67: Europe Y-o-Y Growth Comparison by Product Type, 2025-2035
  • Figure 68: Europe Attractiveness Analysis by Product Type
  • Figure 69: Europe Value Share and BPS Analysis by Channel, 2025 and 2035
  • Figure 70: Europe Y-o-Y Growth Comparison by Channel, 2025-2035
  • Figure 71: Europe Attractiveness Analysis by Channel
  • Figure 72: Europe Value Share and BPS Analysis by Claim, 2025 and 2035
  • Figure 73: Europe Y-o-Y Growth Comparison by Claim, 2025-2035
  • Figure 74: Europe Attractiveness Analysis by Claim
  • Figure 75: East Asia Value Share and BPS Analysis by Country, 2025 and 2035
  • Figure 76: East Asia Value Share and BPS Analysis by Clay Origin, 2025 and 2035
  • Figure 77: East Asia Y-o-Y Growth Comparison by Clay Origin, 2025-2035
  • Figure 78: East Asia Attractiveness Analysis by Clay Origin
  • Figure 79: East Asia Value Share and BPS Analysis by Function, 2025 and 2035
  • Figure 80: East Asia Y-o-Y Growth Comparison by Function, 2025-2035
  • Figure 81: East Asia Attractiveness Analysis by Function
  • Figure 82: East Asia Value Share and BPS Analysis by Product Type, 2025 and 2035
  • Figure 83: East Asia Y-o-Y Growth Comparison by Product Type, 2025-2035
  • Figure 84: East Asia Attractiveness Analysis by Product Type
  • Figure 85: East Asia Value Share and BPS Analysis by Channel, 2025 and 2035
  • Figure 86: East Asia Y-o-Y Growth Comparison by Channel, 2025-2035
  • Figure 87: East Asia Attractiveness Analysis by Channel
  • Figure 88: East Asia Value Share and BPS Analysis by Claim, 2025 and 2035
  • Figure 89: East Asia Y-o-Y Growth Comparison by Claim, 2025-2035
  • Figure 90: East Asia Attractiveness Analysis by Claim
  • Figure 91: South Asia & Pacific Value Share and BPS Analysis by Country, 2025 and 2035
  • Figure 92: South Asia & Pacific Value Share and BPS Analysis by Clay Origin, 2025 and 2035
  • Figure 93: South Asia & Pacific Y-o-Y Growth Comparison by Clay Origin, 2025-2035
  • Figure 94: South Asia & Pacific Attractiveness Analysis by Clay Origin
  • Figure 95: South Asia & Pacific Value Share and BPS Analysis by Function, 2025 and 2035
  • Figure 96: South Asia & Pacific Y-o-Y Growth Comparison by Function, 2025-2035
  • Figure 97: South Asia & Pacific Attractiveness Analysis by Function
  • Figure 98: South Asia & Pacific Value Share and BPS Analysis by Product Type, 2025 and 2035
  • Figure 99: South Asia & Pacific Y-o-Y Growth Comparison by Product Type, 2025-2035
  • Figure 100: South Asia & Pacific Attractiveness Analysis by Product Type
  • Figure 101: South Asia & Pacific Value Share and BPS Analysis by Channel, 2025 and 2035
  • Figure 102: South Asia & Pacific Y-o-Y Growth Comparison by Channel, 2025-2035
  • Figure 103: South Asia & Pacific Attractiveness Analysis by Channel
  • Figure 104: South Asia & Pacific Value Share and BPS Analysis by Claim, 2025 and 2035
  • Figure 105: South Asia & Pacific Y-o-Y Growth Comparison by Claim, 2025-2035
  • Figure 106: South Asia & Pacific Attractiveness Analysis by Claim
  • Figure 107: Middle East and Africa Value Share and BPS Analysis by Country, 2025 and 2035
  • Figure 108: Middle East and Africa Value Share and BPS Analysis by Clay Origin, 2025 and 2035
  • Figure 109: Middle East and Africa Y-o-Y Growth Comparison by Clay Origin, 2025-2035
  • Figure 110: Middle East and Africa Attractiveness Analysis by Clay Origin
  • Figure 111: Middle East and Africa Value Share and BPS Analysis by Function, 2025 and 2035
  • Figure 112: Middle East and Africa Y-o-Y Growth Comparison by Function, 2025-2035
  • Figure 113: Middle East and Africa Attractiveness Analysis by Function
  • Figure 114: Middle East and Africa Value Share and BPS Analysis by Product Type, 2025 and 2035
  • Figure 115: Middle East and Africa Y-o-Y Growth Comparison by Product Type, 2025-2035
  • Figure 116: Middle East and Africa Attractiveness Analysis by Product Type
  • Figure 117: Middle East and Africa Value Share and BPS Analysis by Channel, 2025 and 2035
  • Figure 118: Middle East and Africa Y-o-Y Growth Comparison by Channel, 2025-2035
  • Figure 119: Middle East and Africa Attractiveness Analysis by Channel
  • Figure 120: Middle East and Africa Value Share and BPS Analysis by Claim, 2025 and 2035
  • Figure 121: Middle East and Africa Y-o-Y Growth Comparison by Claim, 2025-2035
  • Figure 122: Middle East and Africa Attractiveness Analysis by Claim
  • Figure 123: Global - Tier Structure Analysis
  • Figure 124: Global - Company Share Analysis

Frequently Asked Questions

How big is the global TerraCotta Clay for Detoxification Market in 2025?

The global TerraCotta Clay for Detoxification Market is estimated to be valued at USD 1,122.1 million in 2025.

What will be the size of the global TerraCotta Clay for Detoxification Market in 2035?

The market size for the global TerraCotta Clay for Detoxification Market is projected to reach USD 3,301.3 million by 2035.

How much will be the global TerraCotta Clay for Detoxification Market growth between 2025 and 2035?

The global TerraCotta Clay for Detoxification Market is expected to grow at a CAGR of 11.4% between 2025 and 2035.

What are the key product types in the global TerraCotta Clay for Detoxification Market?

The key product types in the global TerraCotta Clay for Detoxification Market are wash-off masks, cleansers/scrubs, leave-on spot treatments, and body masks & wraps.

Which clay origin segment will contribute significant share in the global TerraCotta Clay for Detoxification Market in 2025?

In terms of clay origin, terracotta-rich kaolinitic clays are expected to command 46% share in the global TerraCotta Clay for Detoxification Market in 2025.

Explore Similar Insights

Future Market Insights

TerraCotta Clay for Detoxification Market

Chat With

MaRIA

Hi There, I am MaRIA, Your Market Research Intelligence Assistant. How may I help you?