
- Market Size (2026)
- USD 5.5 Bn
- Forecast (2036)
- USD 11.4 Bn
- CAGR (2026 to 2036)
- 7.6%
How Big Is the Trail Mix Market in 2026?
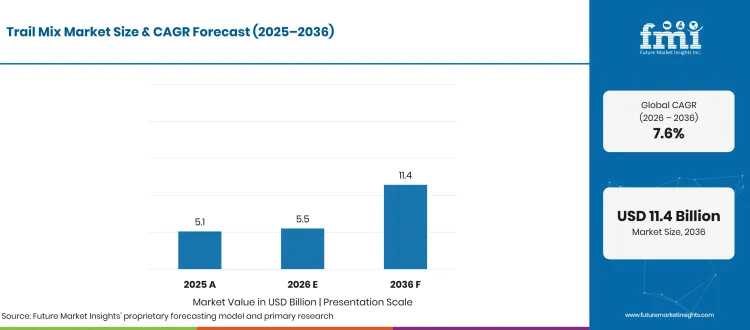
Starting from USD 5.1 billion in 2025, the global trail mix market valuation advanced to USD 5.5 billion in 2026, with projections from Future Market Insights (FMI) pointing toward USD 11.4 billion by 2036 at a CAGR of 7.6%, generating USD 5.9 billion in incremental revenue over the forecast decade.
| Market Metric | Valuation / Share / Forecast Benchmark |
|---|---|
| 2025 Market Size (Historical) | USD 5.1 billion |
| 2026 Market Size (Estimated) | USD 5.5 billion |
| 2036 Market Size (Projected) | USD 11.4 billion |
| Compound Annual Growth Rate (2026 to 2036) | 7.6% CAGR |
| Incremental Dollar Opportunity (2026 to 2036) | USD 5.9 billion |
| Dominant Product Segment (2026 Share) | Nuts & Seed (42.0% in 2026; Other Segment Combined 58.0%) |
| Dominant Type Segment (2026 Share) | Organic (63.0% in 2026; Other Segment Combined 37.0%) |
| Dominant Distribution Channel (2026 Share) | Supermarkets & Hypermarkets (42.0% in 2026; Other Segment Combined 58.0%) |
| Largest Country Markets (2026 Valuation) | USA (USD 2.20 billion), Germany (USD 0.55 billion), Canada & Mexico (USD 0.50 billion) |
| Fastest-Growing Country Markets (2026 to 2036) | Spain (8.1% CAGR), Germany (7.6% CAGR), UK (7.6% CAGR) |
| Leading Tier-1 Companies | PepsiCo, Inc., Hormel Foods Corporation, Second Nature Brands, John B. Sanfilippo & Son, Inc. |
Source: Future Market Insights analysis of the trail mix market, 2026.
This Report Answers
- How large the trail mix market is in 2026 and what it reaches by 2036
- Which product, type and distribution channel segments lead in 2026
- What is driving demand and what is holding the category back
- Which countries grow fastest between 2026 and 2036
- What PepsiCo and other leading players have launched
- How the trail mix market is defined, segmented and measured
Executive Market Overview
Portion-controlled packaging and plant-based protein snacking trends are expanding trail mix sales across convenience stores and supermarkets, appealing to active professionals looking for sustained satiety during working hours. FMI finds that grocery buyers are expanding single-serve multipack allocations for edible nuts and dried-fruit blends owing to steady commuter and school lunchbox replenishment. According to the Organic Trade Association (April 2025), the certified-organic sector in the United States expanded 5.2% in 2024, prompting supermarket buyers to prioritize verifiable organic ingredient claims on snack shelves. Branded processors are also introducing indulgent sweet-and-salty profiles, as seen when Hormel Foods Corporation (September 2025) launched two PLANTERS trail mix varieties formulated with more than 50% roasted nuts in 5-ounce retail bags across the United States.
Ingredient cost swings and allergen-control rules shape commercial margins across North America and Western Europe. In FMI's view and co-packers lift unit realization by pairing certified organic snack food credentials with portion-controlled pouches and labeled cereal bars that meet strict front-of-pack sugar thresholds. Financial disclosures from John B. Sanfilippo & Son, Inc. (September 2026) confirm that major nut and trail mix processors are expanding real-food bar and custom private-label blend capacity in 2026 to protect retailer shelf facings. Market sizing covers finished loose trail mixes and explicitly labeled trail-mix bars sold through retail and online channels, while excluding plain single-variety snack nuts, unblended cereal bars, and raw bulk agricultural commodities.
Analyst Perspective
"Repeat retail orders favor trail mix suppliers whose roasted nut ratios and certified organic provenance pass supermarket margin reviews and multi-allergen audits. The primary commercial risk is tree-nut and cocoa input inflation, which compresses co-packer profitability when grocers resist mid-cycle price increases."
- Nandini Roy Choudhury, Principal Consultant, Future Market Insights (FMI)
Key Market Trends & Insights
- Nut-Forward Sweet-and-Savory Flavor Extensions:Retailers are replacing commoditized raisin-and-peanut blends with dessert-inspired and coffee-paired recipes that command higher retail prices per ounce. FMI observes that national brands use high nut ratios to justify premium shelf placement attributed to shopper preference for protein-dense snacks. In September 2025, Hormel Foods Corporation (September 2025) rolled out PLANTERS White Chocolate Macadamia Nut and Chocolate Caramel Pecan Crunch trail mixes nationwide, while Second Nature Brands (June 2026) expanded its Kar's Nuts and Sahale Snacks glazed nut-and-fruit assortments across grocery and convenience chains.
- Certified Organic Segregation and Clean-Label Auditing:Mainstream supermarkets and drugstores in Europe and North America are expanding shelf space for certified organic mixes that carry audited chain-of-custody seals. FMI's analysis indicates that meeting the 95% organic ingredient threshold under U.S. Department of Agriculture Agricultural Marketing Service (May 2025) and European Commission (May 2025) rules creates a durable entry barrier for verified processors. Sector tracking from Bund Ökologische Lebensmittelwirtschaft (February 2026) confirms that German organic food and beverage sales rose in 2025 as mainstream food retailers widened certified private-label assortments.
- Allergen Cross-Contact Compliance and Claim Substantiation:Multi-ingredient blending lines process peanuts and tree nuts equipment, making validated allergen sanitation and accurate package declarations critical for supplier qualification. Survey findings from the Food Standards Agency (February 2026) show that United Kingdom shoppers rely heavily on explicit precautionary allergen labeling when selecting packaged snacks. In January 2026, the Advertising Standards Authority (January 2026) upheld an enforcement ruling regarding Whitworths 1DERS nutrition comparisons, confirming that snack brands must substantiate SKU-level nutrition claims.
What Are the Main Drivers, Restraints, and Opportunities?
Workplace and school portable snacking habits lift repeat volume for portion-controlled nut-and-fruit pouches, whereas tree-nut crop volatility and strict allergen and sugar-warning rules restrain margin expansion, leaving certified organic and private-label multipacks as key growth avenues.
Driver: Portable Multi-Texture Snacking Across Workplace and School Channels
Consumers and institutional buyers purchase sealed trail mix packs because combined nuts and dried fruit require zero refrigeration while satisfying midday hunger between meals. FMI believes demand for single-serve pouches and snack bars is rising driven by return-to-office routines and lunchbox portion control. Market intelligence published by Agriculture and Agri-Food Canada (July 2025) confirms that Canadian retail demand for portable snack bars and fruit-and-nut snacks continued expanding through 2025 and 2026 as commuters prioritized convenient portion packs. Branded suppliers such as General Mills, Inc. (June 2026) use established Nature Valley distribution to place fruit-and-nut trail mix bars at mass checkout lanes.
Restraint: Raw Material Nut Price Volatility and Mandatory Allergen and Sugar Labeling
Fluctuating harvest yields across almond and walnut create unpredictable input bills for blenders that lock in fixed-price grocery contracts. Commodity tracking from theU.S. Department of Agriculture Economic Research Service (July 2026) and the U.S. Department of Agriculture National Agricultural Statistics Service (May 2025) documents uneven used production and grower prices across United States tree nut and noncitrus fruit crops during the 2025 and 2026 marketing cycles. At the same time, processors blending natural flavours and sweetened chocolate inclusions face strict Mexican front-of-pack warning rules under Diario Oficial de la Federación (May 2025), squeezing formulation margins.
Opportunity: Private-Label Co-Packing and Certified Organic Assortment Expansion
Supermarket chains are expanding store-brand trail mix assortments in resealable stand-up pouches and club-store multipacks to capture value-conscious households. FMI expects contract manufacturers that combine roasted nuts with clean label ingredients to win multi-year retail supply agreements on account of lower brand-marketing overhead. Operational disclosures from John B. Sanfilippo & Son, Inc. (August 2025) and National Raisin Company (June 2026) show that integrated processors with dedicated dry-roasting and dried-fruit packing lines are securing private-label retail programs across North America.
How Is the Trail Mix Market Segmented?
Trail Mix Market is segmented by Product and Type. Forecast period from 2026 to 2036.
| Segmentation Axis | Sub-Segments Covered | 2026 Leading Segment & Share | Remainder & Total Alignment |
|---|---|---|---|
| Product | Nuts & Seed, Dried Fruit, Granola & Cereal Bar, Others | Nuts & Seed (42.0%) | Other Segment Combined (58.0%) | Total (100.0%) |
| Type | Organic, Conventional | Organic (63.0%) | Other Segment Combined (37.0%) | Total (100.0%) |
| Distribution Channel | Supermarkets & Hypermarkets, Convenience Stores, Specialty Stores, Online | Supermarkets & Hypermarkets (42.0%) | Other Segment Combined (58.0%) | Total (100.0%) |
| Region | North America, Latin America, Western Europe, Eastern Europe, East Asia, South Asia and Pacific, Middle East and Africa | North America (led by USA) | Spain leads country growth at 8.1% CAGR (2026 to 2036) |
Source: Future Market Insights analysis of the trail mix market, 2026.
Why Does the Nuts & Seed Segment Lead by Product?
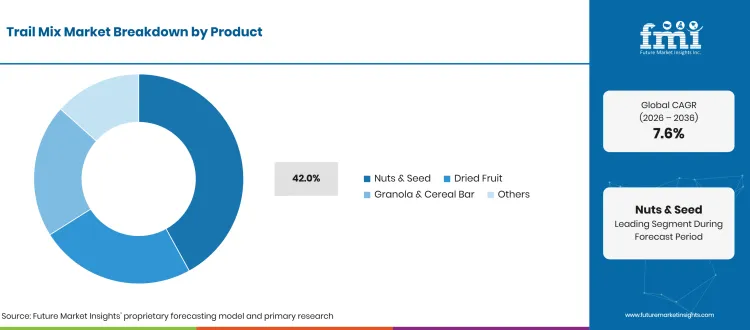
Nuts & Seed varieties secure a leading 42.0% share of Product revenue in 2026, reflecting strong buyer preference for high-protein snacking options that deliver satisfying satiety during workdays and outdoor activities. Formulators control water activity between roasted kernels and fruit pieces so blends stay crisp inside barrier pouches paired with united states cereal bars on adjacent retail racks. In September 2025, Hormel Foods Corporation (September 2025) launched two PLANTERS trail mix varieties containing over 50% nuts by weight, while U.S. Department of Agriculture Economic Research Service (September 2025) crop data highlights steady commercial tree-nut consumption across domestic snack processors. In FMI's view, high-protein nut-and-seed bases will remain the primary volume anchor for retail trail mix assortments through 2036.
Why Does the Organic Segment Lead by Type?
Organic varieties secure a leading 63.0% share of Type revenue in 2026, driven by health-conscious consumer demand for certified pesticide-free dried fruit and unbleached tree nuts. Obtaining certification under U.S. Department of Agriculture Agricultural Marketing Service (May 2025)European Commission (May 2025) standards requires at least 95% certified-organic ingredients and segregated storage bins. According to the Organic Trade Association (April 2025), U.S. organic marketplace sales rose 5.2% in 2024, encouraging processors to pair organic trail mixes with specialty food ingredients for natural grocery chains. FMI expects audited organic traceability to sustain premium retail price points through 2036.
Why Does the Supermarkets & Hypermarkets Segment Lead by Distribution Channel?
Supermarkets and hypermarkets hold 42.0% of Distribution Channel revenue in 2026, leading grocery distribution through family snack displays and private-label multipacks. FMI observes that large grocery chains dominate volume distribution helped by end-cap promotional displays, private-label family tubs, and side-by-side merchandising with fruit snacks and baking nuts. Mass retailers reward suppliers that maintain uniform case dimensions and scan-based replenishment coding under PepsiCo Nut Harvest SmartLabel (July 2025) and Hormel Foods Corporation (September 2025) national 5-ounce bag rollouts. FMI projects that supermarket multipack programs and omnichannel grocery pickup will keep Supermarkets & Hypermarkets as the leading distribution channel through 2036.
Regional & Country Outlook
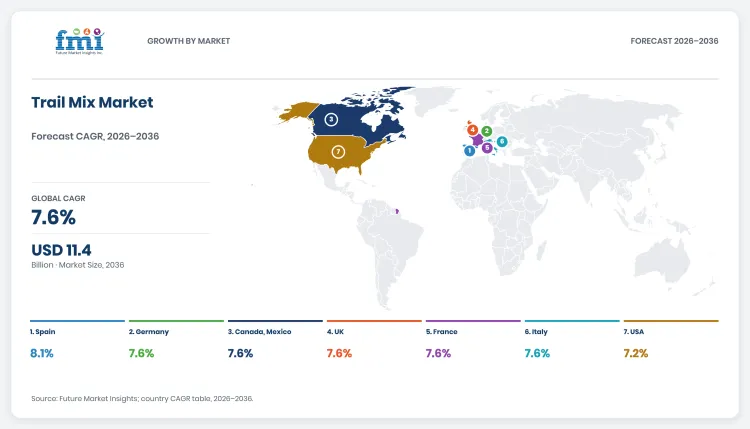
North America and Western Europe account for the majority of global trail mix valuation through 2036, anchored by established portable snacking habits in the United States and expanding certified-organic grocery distribution across Germany, France, Italy, the United Kingdom, and Spain. FMI projects the seven profiled country markets below to represent68.0% of global valuation in 2026 (USD 3.74 billion), advancing to USD 7.69 billion by 2036. While the United States generates the largest absolute dollar addition at USD 2.21 billion (7.2% CAGR), Spain leads national growth pace at an 8.1% CAGR, followed by Germany, the United Kingdom and France at 7.6% CAGR each as retailers widen tea packaging and barrier stand-up pouch formats.
| Country | 2026 Revenue | 2036 Revenue | 10-Year Addition | 2026 to 2036 CAGR | Global Share (2026 -> 2036) |
|---|---|---|---|---|---|
| Spain | USD 0.14 billion | USD 0.31 billion | +USD 0.17 billion | 8.1% | 2.5% -> 2.7% |
| Germany | USD 0.55 billion | USD 1.14 billion | +USD 0.59 billion | 7.6% | 10.0% -> 10.0% |
| Canada, Mexico | USD 0.50 billion | USD 1.04 billion | +USD 0.54 billion | 7.6% | 9.1% -> 9.1% |
| UK | USD 0.44 billion | USD 0.92 billion | +USD 0.48 billion | 7.6% | 8.0% -> 8.1% |
| France | USD 0.25 billion | USD 0.52 billion | +USD 0.27 billion | 7.6% | 4.5% -> 4.6% |
| Italy | USD 0.16 billion | USD 0.33 billion | +USD 0.17 billion | 7.6% | 2.9% -> 2.9% |
| USA | USD 2.20 billion | USD 4.41 billion | +USD 2.21 billion | 7.2% | 40.0% -> 38.7% |
Source: Future Market Insights analysis of the trail mix market, 2026.
USA
Demand for trail mix in USA is projected to rise from USD 2.20 billion in 2026 to USD 4.41 billion by 2036, advancing at a 7.2% CAGR and adding USD 2.21 billion in new revenue. FMI finds that domestic sales are anchored by nationwide grocery and convenience distribution where brand owners pair roasted nuts with indulgent confectionery inclusions and botanical ingredients. In September 2025, Hormel Foods Corporation (September 2025) launched two 5-ounce PLANTERS trail mix varieties across U.S. supermarkets, while John B. Sanfilippo & Son, Inc. (September 2026) expanded private-label trail mix and snack bar manufacturing in fiscal 2026. FMI expects steady club-store multipack replenishment and strict allergen compliance to drive sustained retail orders in the USA through 2036.
Spain
Buyer adoption of trail mix across Spain is estimated to expand from USD 0.14 billion in 2026 to USD 0.31 billion by 2036, spurred by a 8.1% CAGR and generating USD 0.17 billion in commercial expansion. In FMI's view, domestic processors benefit from Spain's expansive certified organic farming base owing to local availability of almonds and sunflower seeds fruit. Official figures from Government of Spain, La Moncloa (October 2025) confirm that Spain consolidated 2.94 million hectares under organic agricultural production, supporting traceable raw material procurement for European snack packers. FMI projects that tourist retail channels and supermarket private-label organic pouches will sustain rapid trail mix sales expansion across Spain through 2036.
Canada, Mexico
Trail mix industry in Canada, Mexico is set to scale from USD 0.50 billion in 2026 to USD 1.04 billion by 2036, driven by a 7.6% CAGR and adding USD 0.54 billion in incremental market value. FMI observes that commercial execution across these two North American markets requires bifurcated packaging strategies due to diverging workplace snacking habits and front-of-pack nutrition rules. Retail tracking by Agriculture and Agri-Food Canada (July 2025) shows growing Canadian demand for portable snack bars and fruit-and-nut packs, whereas Mexico's Diario Oficial de la Federación (May 2025) updated the third phase of NOM-051 warning-label enforcement to 2028. FMI anticipates low-sugar nut-and-seed formulations to drive cross-border supermarket listings through 2036.
Germany
Sales of trail mix throughout Germany are projected to increase from USD 0.55 billion in 2026 to USD 1.14 billion by 2036, progressing at a 7.6% CAGR and creating USD 0.59 billion in additional revenue. FMI believes German demand is fueled by mainstream supermarket and drugstore chains allocating dedicated Gondola shelving to certified organic student-mix (Studentenfutter) and seed-and-berry pouches. Annual sector data from Bund Ökologische Lebensmittelwirtschaft (February 2026) confirms that German organic food and beverage turnover expanded across mainstream retail and drugstore channels during 2025, reinforcing demand for audited EU organic logo products. FMI expects private-label drugstore assortments and verified origin labeling to support steady repeat orders across Germany through 2036.
UK
Consumption of trail mix across UK is estimated to climb from USD 0.44 billion in 2026 to USD 0.92 billion by 2036, reflecting a 7.6% CAGR and contributing USD 0.48 billion over the forecast decade. FMI's analysis indicates that British grocery buyers favor portion-controlled dried-fruit and nut positioned for lunchbox and desk snacking attributed to strict calorie and claim scrutiny. Consumer research from the Food Standards Agency (February 2026) highlights heightened shopper attention to food hypersensitivity disclosures, while the Advertising Standards Authority (January 2026) ruling on Whitworths 1DERS packs reinforces rigorous nutrition-claim verification. In FMI's view, compliant portion packs from suppliers like Whitworths (June 2026) will drive UK supermarket growth through 2036.
France
Revenue generated by trail mix suppliers in France is forecast to expand from USD 0.25 billion in 2026 to USD 0.52 billion by 2036, anchored by a 7.6% CAGR and generating USD 0.27 billion in new category sales. FMI notes that French hypermarkets and specialist organic retailers are widening bulk-bin and prepacked roasted nut-and-fruit assortments on account of recovering household spending on certified organic groceries. Market monitoring published by Agence BIO (March 2026) documents a clear rebound in French organic food consumption across retail channels entering 2026, while European Commission (May 2025) rules govern mandatory allergen and net-weight disclosures. FMI projects that traceable organic fruit-and-nut pouches will capture expanding shelf space across France through 2036.
Italy
Buyer procurement of trail mix throughout Italy is tracking from USD 0.16 billion in 2026 to USD 0.33 billion by 2036, exhibiting a 7.6% CAGR and contributing USD 0.17 billion to national market value. FMI finds that Italian grocery chains and wellness retailers are introducing single-serve nut-and-dried-fruit mixes helped by rising household preference for certified organic snacks. Retail tracking released by ISMEA (May 2026) confirms that Italian household organic food purchases increased 9.2% by value and 7.2% by volume in 2025, creating favorable demand conditions for premium packaged blends. FMI expects domestic packers combining Mediterranean nuts with resealable portion bags to secure wider Italian supermarket listings through 2036.
Competitive Environment and Notable Companies
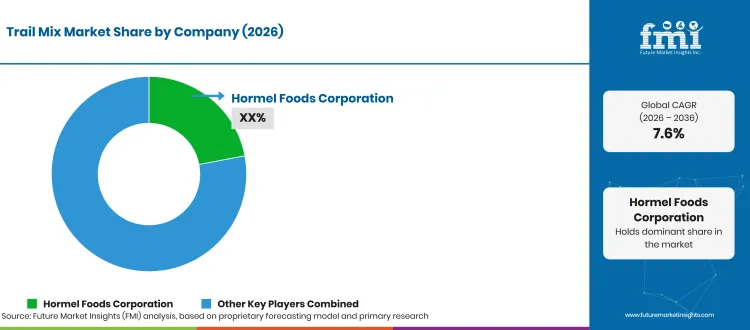
Notable companies operating in the global trail mix market include PepsiCo, Inc., General Mills, Inc., Mars, Incorporated, Hormel Foods Corporation, Second Nature Brands, John B. Sanfilippo & Son, Inc., SunOpta Inc., Texas Star Nut & Food Co, National Raisin Company, and Whitworths. Competition is divided between national CPG brand owners that command checkout and end-cap displays across supermarkets and convenience stores, and vertically integrated nut roasters and dried-fruit processors that supply private-label retail programs and co-packed multipacks.
How Are Companies Positioned in the Trail Mix Market?
Branded CPG leaders includingHormel Foods Corporation (September 2025), Second Nature Brands (June 2026), and PepsiCo, Inc. (February 2026) compete through nationally distributed loose trail mix pouches under the PLANTERS, Kar's Nuts and Sahale Snacks brands. General Mills, Inc. (June 2026) and Mars, Incorporated (December 2025) participate across trail-mix bars and snacking platforms, while John B. Sanfilippo & Son, Inc. (September 2026) and National Raisin Company (June 2026) anchor private-label manufacturing.
What Matters When a Buyer Selects a Trail Mix Supplier?
Supermarket category managers and foodservice distributors evaluate trail mix suppliers on nut-to-fruit ratio consistency and moisture-barrier packaging segregation across peanuts and tree nuts. Suppliers must also demonstrate compliant ingredient and nutrition disclosures, as highlighted by theAdvertising Standards Authority (January 2026) ruling in the United Kingdom and PepsiCo Nut Harvest SmartLabel (July 2025) item-level digital allergen records.
Which Capabilities Distinguish Product Offers?
Manufacturing capabilities diverge across dry-roasting scale and glazing and organic certification. Second Nature Brands (June 2026) combines conventional Kar's sweet-and-salty mixes with culinary-glazed Sahale Snacks blends, whereas SunOpta Inc. (May 2025) and Texas Star Nut & Food Co (June 2026) supply organic fruit snack mixes and Nature's Eats grocery packs with flavonoids and antioxidant-rich berry inclusions.
How Does Geographic Reach Affect Competition?
United States suppliers such asHormel Foods Corporation (September 2025), John B. Sanfilippo & Son, Inc. (August 2025), and General Mills, Inc. (June 2026) use coast-to-coast warehouse and direct-store-delivery networks, while Whitworths (June 2026) focuses on United Kingdom supermarket chains. Following its December 2025 acquisition of Kellanova, Mars, Incorporated (December 2025) broadened its international snack distribution footprint across Europe and Latin America.
| Verified Company Evidence (2025 to 2026) | Commercial Effect | Buyer Action |
|---|---|---|
| September 2025: Hormel Foods Corporation launched PLANTERS White Chocolate Macadamia Nut and Chocolate Caramel Pecan Crunch trail mixes in 5 oz bags with >50% nuts (Hormel Foods Corporation, September 2025). | Extends a flagship roasted-nut brand into premium dessert-inspired trail mixes across national grocery aisles. | Benchmark nut-content percentage and unit velocity when allocating premium 5 oz stand-up pouch facings. |
| December 2025: Mars, Incorporated completed its acquisition of Kellanova, integrating global snack bar and portable snack distribution networks (Mars, Incorporated, December 2025). | Consolidates international retail and convenience route-to-market infrastructure across snacking categories. | Review consolidated supplier terms and cross-category promotional bundles across bar and trail mix aisles. |
| September 2026: John B. Sanfilippo & Son, Inc. expanded its FY26 real-food snack bar, roasted nut, and trail mix private-label and branded portfolio capacity (John B. Sanfilippo & Son, Inc., September 2026). | Strengthens domestic contract manufacturing and private-label supply for mass retailers and club stores. | Qualify integrated roaster-blenders for multi-format private-label trail mix pouches and bar programs. |
Source: Verified corporate disclosures and Future Market Insights analysis, 2026.
| Company | Core Positioning | Verified Activity & Source Attribution |
|---|---|---|
| Hormel Foods Corporation | National branded packaged nuts and nut-forward trail mixes (PLANTERS) | Launched two >50%-nut sweet-and-salty PLANTERS trail mix varieties in 5 oz retail bags nationwide in September 2025 (Hormel Foods Corporation, September 2025). |
| Second Nature Brands | Dedicated trail mix and glazed nut-and-fruit brand platform (Kar's Nuts, Sahale Snacks) | Markets single-serve and variety-pack Kar's Nuts and culinary-glazed Sahale Snacks trail mixes across U.S. retail and online channels (Second Nature Brands, June 2026). |
| John B. Sanfilippo & Son, Inc. | Integrated processor of branded (Fisher, Orchard Valley Harvest) and private-label trail mixes and bars | Reported full-year FY25 and FY26 portfolio expansion across trail mixes, snack nuts, and bars (John B. Sanfilippo & Son, Inc., August 2025; September 2026). |
| PepsiCo, Inc. | Mass-retail and convenience packaged trail mix and snack nut supplier (Frito-Lay / Nut Harvest) | Maintains item-level SmartLabel allergen and nutrition records for Nut Harvest Nut & Chocolate Trail Mix across U.S. channels (PepsiCo, Inc., February 2026; July 2025). |
| General Mills, Inc. | Branded trail-mix fruit-and-nut granola bars (Nature Valley) | Supplies Nature Valley Fruit & Nut Trail Mix Bars across North American and international grocery retail (General Mills, Inc., June 2026). |
| Mars, Incorporated | Global snacking, nutrition bar, and portable snack portfolio operator | Completed acquisition of Kellanova on 11 December 2025 to scale global snacking distribution (Mars, Incorporated, December 2025). |
| Whitworths | United Kingdom dried fruit, nut, and seed mix specialist (Wondermix, 1DERS) | Markets portion-controlled Wondermix and 1DERS fruit-and-nut packs across UK supermarkets (Whitworths, June 2026). |
| Texas Star Nut & Food Co | Retail and bulk packaged trail mix and culinary nut processor (Nature's Eats) | Supplies Nature's Eats trail mixes, roasted nuts, and seed blends to U.S. grocery retailers (Texas Star Nut & Food Co, June 2026). |
| National Raisin Company | Vertically integrated dried-fruit processor and private-label trail mix co-packer | Provides custom private-label trail mix blending and multi-format pouch packing for retail accounts (National Raisin Company, June 2026). |
| SunOpta Inc. | Organic and better-for-you fruit snack and ingredient supplier | Expanded USDA organic-certified fruit snack and better-for-you snack capabilities across North American retail channels (SunOpta Inc., May 2025). |
Source: Verified corporate disclosures and Future Market Insights analysis, 2026.
Key takeaways
- Valued at USD 5.5 billion in 2026, on course for USD 11.4 billion by 2036.
- The decade adds USD 5.9 billion in new value at a 7.6% CAGR.
- The product segment is led by Nuts & Seed at 42.0% of 2026 revenue.
- 63.0% of type revenue goes to Organic in 2026.
- Spain grows fastest at 8.1% CAGR, ahead of Germany at 7.6%.
Trail Mix Market - Report Scope and Research Methodology
FMI sizes the global trail mix market using a bottom-up and top-down triangulation model that reconciles retail scanner turnover, private-label co-packing volumes, and average selling prices per kilogram across each tracked country. Primary interviews with nut roasters, dried-fruit processors, supermarket category buyers, and food-safety compliance officers establish segment splits across Product and Type axes. Desk research cross-checks national organic food expenditure and tree-nut consumption reports, and corporate Form 10-K filings to validate core 2025 and 2026 revenues. Adjacent categories such as unblended single-variety snack nuts, standard cereal bars without trail-mix positioning, and raw bulk agricultural trade are excluded to prevent double counting.
| Coverage Field | Report Scope |
|---|---|
| Market Definition | Revenue from finished packaged loose trail mixes (blends of nuts, seeds, dried fruit, and sweet or savory inclusions) and explicitly marketed trail-mix bars. |
| Product Segmentation | Nuts & Seed (42.0% in 2026); Other Segment Combined (58.0%: Dried Fruit, Granola & Cereal Bar, Others) | Total (100.0%). |
| Type Segmentation | Organic (63.0% in 2026); Other Segment Combined (37.0%: Conventional) | Total (100.0%). |
| Distribution Channel Segmentation | Supermarkets & Hypermarkets (42.0% in 2026); Other Segment Combined (58.0%: Convenience Stores, Specialty Stores, Online) | Total (100.0%). |
| Regions Covered | North America, Latin America, Western Europe, Eastern Europe, East Asia, South Asia and Pacific, Middle East and Africa. |
| Countries Profiled | USA, Canada & Mexico, Germany, UK, France, Italy, Spain. |
| Exclusions | Plain single-variety snack nuts, unrelated cereal or energy bars, raw bulk nut/fruit commodity sales, and downstream foodservice bakery dishes. |
| Quantitative Units | USD billion (uniform unit lock across global and national valuations). |
| Historical & Base Years | 2025 (USD 5.1 billion historical); 2026 (USD 5.5 billion estimated). |
| Forecast Period & 2036 Projection | 2026 to 2036 (USD 11.4 billion projected by 2036; 7.6% CAGR; +USD 5.9 billion incremental addition). |
| Companies Profiled | PepsiCo, Inc., General Mills, Inc., Mars, Incorporated, Hormel Foods Corporation, Second Nature Brands, John B. Sanfilippo & Son, Inc., SunOpta Inc., Texas Star Nut & Food Co, National Raisin Company, Whitworths. |
| Research Approach | Primary buyer/processor interviews, government agricultural and organic trade statistics, SEC filings, and bottom-up/top-down market triangulation. |
Source: Future Market Insights analysis of the trail mix market, 2026.
Research Sources and Bibliography
- Advertising Standards Authority. (2026, January 28).ASA Ruling on Whitworths Ltd (a25-1305207). https://www.asa.org.uk/rulings/whitworths-ltd-a25-1305207-whitworths-ltd.html
- Agence BIO. (2026, March 16).Conjoncture bio Mars 2026: Reprise de la consommation bio en France. https://www.agencebio.org/wp-content/uploads/2026/04/conjoncture-bio-mars-2026.pdf
- Agriculture and Agri-Food Canada. (2025, July 2).Customized Report Service: Sweet biscuits and snack bars in Canada. https://agriculture.canada.ca/en/international-trade/market-intelligence/reports-and-guides/customized-report-service-sweet-biscuits-snack-bars-and-fruit-snacks-canada
- Bund Ökologische Lebensmittelwirtschaft. (2026, February 10).Branchenzahlen 2025/2026: Umsatz, Absatz und Importe. https://www.boelw.de/news/umsatz-absatz-importe-2026/
- Diario Oficial de la Federación. (2025, May 15).Acuerdo de actualización de la tercera fase de la NOM-051-SCFI/SSA1-2010 a 2028. https://sidof.segob.gob.mx/notas/docFuente/5764197
- European Commission. (2025, May 10).Food Information to Consumers: Regulation (EU) No 1169/2011 Legislation. https://food.ec.europa.eu/food-safety/labelling-and-nutrition/food-information-consumers-legislation_en
- European Commission. (2025, May 12).The European Union Organic Logo and Certification Rules. https://agriculture.ec.europa.eu/farming/organic-farming/organic-logo_en
- Food Standards Agency. (2026, February 19).Food and You 2, Wave 10: Chapter 4 Food Allergies and Intolerances. https://www.food.gov.uk/research/fy2-wave-10-chapter-4-food-allergies-intolerances-and-other-hypersensitivities
- General Mills, Inc. (2026, June 25).Annual Report on Form 10-K for the Fiscal Year Ended May 31, 2026. https://www.sec.gov/Archives/edgar/data/40704/000162828026046466/gis-20260531.htm
- General Mills, Inc. (2026, June 30).Nature Valley Fruit and Nut Trail Mix Bars Portfolio. https://www.generalmills.com/our-food/brands/nature-valley
- Government of Spain, La Moncloa. (2025, October 10).Spain Consolidates Its Position in Organic Production Surface Area. https://www.lamoncloa.gob.es/lang/en/gobierno/news/paginas/2025/20251010-organic-production.aspx
- Hormel Foods Corporation. (2025, September 18).Trailblazing Taste: The PLANTERS Brand Mixes Premium Nuts with Sweet Twists. https://www.hormelfoods.com/newsroom/press-releases/trailblazing-taste-the-planters-brand-mixes-premium-nuts-with-sweet-twists/
- ISMEA. (2026, May 18).Biologico: nel 2025 gli acquisti delle famiglie volano a 4,4 miliardi di euro. https://www.ismeamercati.it/flex/cm/pages/ServeBLOB.php/L/IT/IDPagina/13861
- John B. Sanfilippo & Son, Inc. (2025, August 20).Annual Report on Form 10-K for the Fiscal Year Ended June 26, 2025. https://www.sec.gov/Archives/edgar/data/880117/000095017025110463/jbss-20250626.htm
- John B. Sanfilippo & Son, Inc. (2026, September 15).FY26 Year End Investor Update: Complete Real-Food Portfolio of Bars and Nuts. https://jbssinc.com/wp-content/uploads/2026/09/FY26-Year-End_FNL.pdf
- Mars, Incorporated. (2025, December 11).Mars Completes Acquisition of Kellanova. https://www.mars.com/news-and-stories/press-releases-statements/mars-completes-acquisition-of-kellanova
- National Raisin Company. (2026, June 10).Private Label Dried Fruit and Trail Mix Co-Packing Capabilities. https://nationalraisin.com/private-label-dried-fruit/
- Organic Trade Association. (2025, April 23).Growth of U.S. Organic Marketplace Accelerated in 2024. https://ota.com/about-ota/press-releases/growth-us-organic-marketplace-accelerated-2024
- PepsiCo, Inc. (2025, July 3).Nut Harvest Nut and Chocolate Trail Mix SmartLabel Product Specification. https://smartlabel.pepsico.info/028400034821-0020-en-US/index.html
- PepsiCo, Inc. (2026, February 2).Annual Report on Form 10-K for the Fiscal Year Ended December 27, 2025. https://www.sec.gov/Archives/edgar/data/77476/000007747626000007/pep-20251227.htm
- Second Nature Brands. (2026, June 15).Assorted Kar's Nuts and Sahale Snacks Trail Mixes Portfolio. https://secondnaturebrands.com/collections/trail-mixes
- Second Nature Brands. (2026, June 18).Sahale Snacks Premium Nut and Fruit Snack Mixes Collection. https://secondnaturebrands.com/collections/sahale-snacks-all-products
- SunOpta Inc. (2025, May 15).Form 10-K Annual Report: Healthy Fruit Snacks and Better-for-You Snack Manufacturing. https://www.sec.gov/Archives/edgar/data/351834/000106299324004783/form10k.htm
- Texas Star Nut & Food Co. (2026, June 12).Nature's Eats and Retail Nut and Trail Mix Brands. https://texasnut.com/our-brands/
- U.S. Department of Agriculture Agricultural Marketing Service. (2025, May 14).Labeling Requirements for the U.S. Organic Market. https://www.ams.usda.gov/services/organic-certification/international-trade/labeling-requirements-US-organic-market
- U.S. Department of Agriculture Economic Research Service. (2025, September 25).Fruit and Tree Nuts Outlook: September 2025 (FTS-383). https://www.ers.usda.gov/media/10755/fts-383.pdf
- U.S. Department of Agriculture Economic Research Service. (2026, July 23).Fruit and Tree Nuts Outlook: July 2026 (FTS-385). https://www.ers.usda.gov/media/29391/fts-385.pdf
- U.S. Department of Agriculture National Agricultural Statistics Service. (2025, May 2).Noncitrus Fruits and Nuts 2024 Summary (ncit0525). https://esmis.nal.usda.gov/sites/default/release-files/zs25x846c/mc87rn20c/w37656321/ncit0525.pdf
- Whitworths. (2026, June 20).Whitworths Wondermix and 1DERS Dried Fruit and Nut. https://whitworths.co.uk/shop/
Table of Content
- Key Takeaways
- Market Size and CAGR
- Top Growth Driver
- Fastest Growing Segment
- Leading Region
- Key Companies
- Emerging Opportunities
- Executive Summary
- Global Market Outlook
- Demand-side Trends
- Supply-side Trends
- Technology Roadmap Analysis
- Analysis and Recommendations
- Analyst Perspective (What is happening? Why now? What should investors know?)
- Key Questions Answered
- How large is the market?
- What is the CAGR?
- What are key trends?
- Which region dominates?
- Who are the leaders?
Read More...
- Market Overview
- Market Coverage / Taxonomy
- Market Definition / Scope / Limitations
- Research Methodology
- Chapter Orientation
- Analytical Lens and Working Hypotheses
- Market Structure, Signals, and Trend Drivers
- Benchmarking and Cross-market Comparability
- Market Sizing, Forecasting, and Opportunity Mapping
- Research Design and Evidence Framework
- Desk Research Programme (Secondary Evidence)
- Expert Input and Fieldwork (Primary Evidence)
- Tooling, Models, and Reference Databases
- Data Engineering and Model Build
- Quality Assurance and Audit Trail
- Market Background
- Market Dynamics (Drivers, Restraints, Opportunity, Trends)
- Scenario Forecast (Optimistic, Likely, Conservative)
- Impact Analysis
- AI Impact
- Sustainability Impact
- Regulatory Impact
- Technology Impact
- Consumer / Buyer Analysis
- Purchase Drivers
- Adoption Barriers
- Buyer Journey
- Opportunity Map Analysis
- Product Life Cycle Analysis
- Supply Chain Analysis
- Investment Feasibility Matrix
- Value Chain Analysis
- PESTLE and Porter's Analysis
- Regulatory Landscape
- Regional Parent Market Outlook
- Production and Consumption Statistics
- Import and Export Statistics
- Global Market Analysis and Forecast, 2021 to 2036
- Historical Market Size Value (USD Billion) Analysis, 2021 to 2025
- Current and Future Market Size Value (USD Billion) Projections, 2026 to 2036
- Y-o-Y Growth Trend Analysis
- Absolute $ Opportunity Analysis
- Global Market Pricing Analysis, 2021 to 2036
- Global Market Analysis and Forecast, By Product, 2021 to 2036
- Introduction / Key Findings
- Historical Market Size Value (USD Billion) Analysis By Product, 2021 to 2025
- Current and Future Market Size Value (USD Billion) Analysis and Forecast By Product, 2026 to 2036
- Nuts & Seed
- Dried Fruit
- Granola & Cereal Bar
- Others
- Y-o-Y Growth Trend Analysis By Product, 2021 to 2025
- Absolute $ Opportunity Analysis By Product, 2026 to 2036
- Global Market Analysis and Forecast, By Type, 2021 to 2036
- Introduction / Key Findings
- Historical Market Size Value (USD Billion) Analysis By Type, 2021 to 2025
- Current and Future Market Size Value (USD Billion) Analysis and Forecast By Type, 2026 to 2036
- Organic
- Conventional
- Y-o-Y Growth Trend Analysis By Type, 2021 to 2025
- Absolute $ Opportunity Analysis By Type, 2026 to 2036
- Global Market Analysis and Forecast, By Distribution Channel, 2021 to 2036
- Introduction / Key Findings
- Historical Market Size Value (USD Billion) Analysis By Distribution Channel, 2021 to 2025
- Current and Future Market Size Value (USD Billion) Analysis and Forecast By Distribution Channel, 2026 to 2036
- Supermarkets & Hypermarkets
- Convenience Stores
- Specialty Stores
- Online
- Y-o-Y Growth Trend Analysis By Distribution Channel, 2021 to 2025
- Absolute $ Opportunity Analysis By Distribution Channel, 2026 to 2036
- Global Market Analysis and Forecast, By Region, 2021 to 2036
- Introduction
- Historical Market Size Value (USD Billion) Analysis By Region, 2021 to 2025
- Current Market Size Value (USD Billion) Analysis and Forecast By Region, 2026 to 2036
- North America
- Western Europe
- East Asia
- South Asia and Pacific
- Market Attractiveness Analysis By Region
- North America Market Analysis and Forecast, By Country, 2021 to 2036
- Historical Market Size Value (USD Billion) Trend Analysis By Market Taxonomy, 2021 to 2025
- Market Size Value (USD Billion) Forecast By Market Taxonomy, 2026 to 2036
- By Country
- United States
- Canada
- By Product
- By Type
- By Distribution Channel
- By Country
- Market Attractiveness Analysis
- By Country
- By Product
- By Type
- By Distribution Channel
- Key Takeaways
- Western Europe Market Analysis and Forecast, By Country
- Historical Market Size Value (USD Billion) Trend Analysis By Market Taxonomy, 2021 to 2025
- Market Size Value (USD Billion) Forecast By Market Taxonomy, 2026 to 2036
- By Country
- United Kingdom
- Germany
- France
- By Product
- By Type
- By Distribution Channel
- By Country
- Market Attractiveness Analysis
- By Country
- By Product
- By Type
- By Distribution Channel
- Key Takeaways
- East Asia Market Analysis and Forecast, By Country
- Historical Market Size Value (USD Billion) Trend Analysis By Market Taxonomy, 2021 to 2025
- Market Size Value (USD Billion) Forecast By Market Taxonomy, 2026 to 2036
- By Country
- China
- Japan
- South Korea
- By Product
- By Type
- By Distribution Channel
- By Country
- Market Attractiveness Analysis
- By Country
- By Product
- By Type
- By Distribution Channel
- Key Takeaways
- South Asia and Pacific Market Analysis and Forecast, By Country
- Historical Market Size Value (USD Billion) Trend Analysis By Market Taxonomy, 2021 to 2025
- Market Size Value (USD Billion) Forecast By Market Taxonomy, 2026 to 2036
- By Country
- India
- Australia
- Rest of world aggregate
- By Product
- By Type
- By Distribution Channel
- By Country
- Market Attractiveness Analysis
- By Country
- By Product
- By Type
- By Distribution Channel
- Key Takeaways
- Key Countries Market Analysis
- United States
- Pricing Analysis
- Market Share Analysis, 2025
- By Product
- By Type
- By Distribution Channel
- Canada
- Pricing Analysis
- Market Share Analysis, 2025
- By Product
- By Type
- By Distribution Channel
- Germany
- Pricing Analysis
- Market Share Analysis, 2025
- By Product
- By Type
- By Distribution Channel
- United Kingdom
- Pricing Analysis
- Market Share Analysis, 2025
- By Product
- By Type
- By Distribution Channel
- France
- Pricing Analysis
- Market Share Analysis, 2025
- By Product
- By Type
- By Distribution Channel
- India
- Pricing Analysis
- Market Share Analysis, 2025
- By Product
- By Type
- By Distribution Channel
- China
- Pricing Analysis
- Market Share Analysis, 2025
- By Product
- By Type
- By Distribution Channel
- Japan
- Pricing Analysis
- Market Share Analysis, 2025
- By Product
- By Type
- By Distribution Channel
- South Korea
- Pricing Analysis
- Market Share Analysis, 2025
- By Product
- By Type
- By Distribution Channel
- Australia
- Pricing Analysis
- Market Share Analysis, 2025
- By Product
- By Type
- By Distribution Channel
- United States
- Market Structure Analysis
- Competition Dashboard
- Competition Benchmarking
- Market Share Analysis of Top Players
- By Regional
- By Product
- By Type
- By Distribution Channel
- Emerging Startups
- Innovation Benchmarking
- Competition Analysis
- Competition Deep Dive
- Hormel Foods Corporation
- Overview
- Product Portfolio
- Profitability by Market Segments
- Sales Footprint
- Strategy Overview
- Marketing Strategy
- Product Strategy
- Channel Strategy
- Second Nature Brands
- John B. Sanfilippo & Son, Inc.
- PepsiCo, Inc.
- General Mills, Inc.
- Mars, Incorporated
- Whitworths
- Texas Star Nut & Food Co
- National Raisin Company
- SunOpta Inc.
- Hormel Foods Corporation
- Case Studies
- Success Stories
- Recent Developments
- Competition Deep Dive
- Assumptions & Acronyms Used
List of Tables
- Table 1: Global Market Value (USD Billion) Forecast by Region, 2021 to 2036
- Table 2: Global Market Value (USD Billion) Forecast by Product, 2021 to 2036
- Table 3: Global Market Value (USD Billion) Forecast by Type, 2021 to 2036
- Table 4: Global Market Value (USD Billion) Forecast by Distribution Channel, 2021 to 2036
- Table 5: North America Market Value (USD Billion) Forecast by Country, 2021 to 2036
- Table 6: North America Market Value (USD Billion) Forecast by Product, 2021 to 2036
- Table 7: North America Market Value (USD Billion) Forecast by Type, 2021 to 2036
- Table 8: North America Market Value (USD Billion) Forecast by Distribution Channel, 2021 to 2036
- Table 9: Western Europe Market Value (USD Billion) Forecast by Country, 2021 to 2036
- Table 10: Western Europe Market Value (USD Billion) Forecast by Product, 2021 to 2036
- Table 11: Western Europe Market Value (USD Billion) Forecast by Type, 2021 to 2036
- Table 12: Western Europe Market Value (USD Billion) Forecast by Distribution Channel, 2021 to 2036
- Table 13: East Asia Market Value (USD Billion) Forecast by Country, 2021 to 2036
- Table 14: East Asia Market Value (USD Billion) Forecast by Product, 2021 to 2036
- Table 15: East Asia Market Value (USD Billion) Forecast by Type, 2021 to 2036
- Table 16: East Asia Market Value (USD Billion) Forecast by Distribution Channel, 2021 to 2036
- Table 17: South Asia and Pacific Market Value (USD Billion) Forecast by Country, 2021 to 2036
- Table 18: South Asia and Pacific Market Value (USD Billion) Forecast by Product, 2021 to 2036
- Table 19: South Asia and Pacific Market Value (USD Billion) Forecast by Type, 2021 to 2036
- Table 20: South Asia and Pacific Market Value (USD Billion) Forecast by Distribution Channel, 2021 to 2036
List of Figures
- Figure 1: Global Market Pricing Analysis
- Figure 2: Global Market Value (USD Billion) Forecast 2021-2036
- Figure 3: Global Market Value Share and BPS Analysis by Product, 2026 and 2036
- Figure 4: Global Market Y-o-Y Growth Comparison by Product, 2026-2036
- Figure 5: Global Market Attractiveness Analysis by Product
- Figure 6: Global Market Value Share and BPS Analysis by Type, 2026 and 2036
- Figure 7: Global Market Y-o-Y Growth Comparison by Type, 2026-2036
- Figure 8: Global Market Attractiveness Analysis by Type
- Figure 9: Global Market Value Share and BPS Analysis by Distribution Channel, 2026 and 2036
- Figure 10: Global Market Y-o-Y Growth Comparison by Distribution Channel, 2026-2036
- Figure 11: Global Market Attractiveness Analysis by Distribution Channel
- Figure 12: Global Market Value (USD Billion) Share and BPS Analysis by Region, 2026 and 2036
- Figure 13: Global Market Y-o-Y Growth Comparison by Region, 2026-2036
- Figure 14: Global Market Attractiveness Analysis by Region
- Figure 15: North America Market Incremental Dollar Opportunity, 2026-2036
- Figure 16: Western Europe Market Incremental Dollar Opportunity, 2026-2036
- Figure 17: East Asia Market Incremental Dollar Opportunity, 2026-2036
- Figure 18: South Asia and Pacific Market Incremental Dollar Opportunity, 2026-2036
- Figure 19: North America Market Value Share and BPS Analysis by Country, 2026 and 2036
- Figure 20: North America Market Value Share and BPS Analysis by Product, 2026 and 2036
- Figure 21: North America Market Y-o-Y Growth Comparison by Product, 2026-2036
- Figure 22: North America Market Attractiveness Analysis by Product
- Figure 23: North America Market Value Share and BPS Analysis by Type, 2026 and 2036
- Figure 24: North America Market Y-o-Y Growth Comparison by Type, 2026-2036
- Figure 25: North America Market Attractiveness Analysis by Type
- Figure 26: North America Market Value Share and BPS Analysis by Distribution Channel, 2026 and 2036
- Figure 27: North America Market Y-o-Y Growth Comparison by Distribution Channel, 2026-2036
- Figure 28: North America Market Attractiveness Analysis by Distribution Channel
- Figure 29: Western Europe Market Value Share and BPS Analysis by Country, 2026 and 2036
- Figure 30: Western Europe Market Value Share and BPS Analysis by Product, 2026 and 2036
- Figure 31: Western Europe Market Y-o-Y Growth Comparison by Product, 2026-2036
- Figure 32: Western Europe Market Attractiveness Analysis by Product
- Figure 33: Western Europe Market Value Share and BPS Analysis by Type, 2026 and 2036
- Figure 34: Western Europe Market Y-o-Y Growth Comparison by Type, 2026-2036
- Figure 35: Western Europe Market Attractiveness Analysis by Type
- Figure 36: Western Europe Market Value Share and BPS Analysis by Distribution Channel, 2026 and 2036
- Figure 37: Western Europe Market Y-o-Y Growth Comparison by Distribution Channel, 2026-2036
- Figure 38: Western Europe Market Attractiveness Analysis by Distribution Channel
- Figure 39: East Asia Market Value Share and BPS Analysis by Country, 2026 and 2036
- Figure 40: East Asia Market Value Share and BPS Analysis by Product, 2026 and 2036
- Figure 41: East Asia Market Y-o-Y Growth Comparison by Product, 2026-2036
- Figure 42: East Asia Market Attractiveness Analysis by Product
- Figure 43: East Asia Market Value Share and BPS Analysis by Type, 2026 and 2036
- Figure 44: East Asia Market Y-o-Y Growth Comparison by Type, 2026-2036
- Figure 45: East Asia Market Attractiveness Analysis by Type
- Figure 46: East Asia Market Value Share and BPS Analysis by Distribution Channel, 2026 and 2036
- Figure 47: East Asia Market Y-o-Y Growth Comparison by Distribution Channel, 2026-2036
- Figure 48: East Asia Market Attractiveness Analysis by Distribution Channel
- Figure 49: South Asia and Pacific Market Value Share and BPS Analysis by Country, 2026 and 2036
- Figure 50: South Asia and Pacific Market Value Share and BPS Analysis by Product, 2026 and 2036
- Figure 51: South Asia and Pacific Market Y-o-Y Growth Comparison by Product, 2026-2036
- Figure 52: South Asia and Pacific Market Attractiveness Analysis by Product
- Figure 53: South Asia and Pacific Market Value Share and BPS Analysis by Type, 2026 and 2036
- Figure 54: South Asia and Pacific Market Y-o-Y Growth Comparison by Type, 2026-2036
- Figure 55: South Asia and Pacific Market Attractiveness Analysis by Type
- Figure 56: South Asia and Pacific Market Value Share and BPS Analysis by Distribution Channel, 2026 and 2036
- Figure 57: South Asia and Pacific Market Y-o-Y Growth Comparison by Distribution Channel, 2026-2036
- Figure 58: South Asia and Pacific Market Attractiveness Analysis by Distribution Channel
- Figure 59: Global Market - Tier Structure Analysis
Figure 60: Global Market - Company Share Analysis
Frequently Asked Questions
How big is the trail mix market in 2026?
Future Market Insights estimates the global trail mix market valuation at USD 5.5 billion in 2026, advancing from USD 5.1 billion in 2025 across packaged loose mixes and explicitly labeled trail-mix bars.
What is the trail mix market forecast and CAGR for 2026 to 2036?
FMI projects the global trail mix market to expand at a 7.6% CAGR between 2026 and 2036, reaching USD 11.4 billion by 2036 and generating USD 5.9 billion in incremental dollar opportunity.
Which Product segment leads the trail mix market in 2026?
Nuts & Seed leads the Product axis with 42.0% of global valuation in 2026, as roasted almonds and peanuts provide essential crunchy texture and high protein content.
Which Type segment holds the largest share in the trail mix market?
Organic leads the Type segment at 63.0% of 2026 revenue reflecting sustained demand across natural grocery aisles for certified residue-free nuts and dried fruit.
Which Distribution Channel leads global trail mix sales?
Supermarkets & Hypermarkets account for 42.0% of Distribution Channel sales in 2026 anchored by prominent shelf space for family-size stand-up pouches and private-label tub promotions.
Which country is the largest trail mix market globally?
USA is the largest national trail mix market, valued at USD 2.20 billion in 2026 (40.0% global share) and projected to reach USD 4.41 billion by 2036 at a 7.2% CAGR.
Which profiled country is projected to grow fastest through 2036?
Spain records the highest forecast growth rate among profiled countries at an 8.1% CAGR from 2026 to 2036, corroborated by 2.94 million hectares of domestic organic farmland and expanding European retail distribution.
Which companies are profiled as key players in the trail mix market?
Key profiled participants includePepsiCo, Inc., General Mills, Inc., Mars, Incorporated, Hormel Foods Corporation, Second Nature Brands, John B. Sanfilippo & Son, Inc., SunOpta Inc., Texas Star Nut & Food Co, National Raisin Company, and Whitworths.
Preview the report firsthand - request a free sample
Get SampleGet the brochure for pricing and purchase details.
Get PDF
