

- Market Size (2026)
- USD 3.2 Bn
- Forecast (2036)
- USD 6.1 Bn
- CAGR (2026 to 2036)
- 6.6%
How big is the Turf Irrigation System Market in 2026?
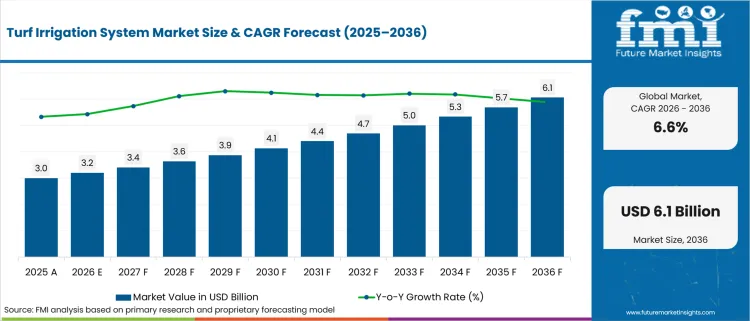
USD 3.2 billion in 2026 and USD 6.1 billion by 2036 at a 6.6% CAGR.
Water-stressed turf operations are shifting buying decisions from basic watering coverage to managed surface performance. EPA WaterSense reported in March 2026 that USA outdoor water use reaches nearly 8 billion gallons each day. The same source noted that up to 50% of this water can be wasted by inefficient systems. This pushes venue owners toward sensor-linked control and audit-backed layouts that reduce avoidable watering loss.
Sports-field operators and golf superintendents buy these systems alongside parks departments and campus facility teams to protect playable surfaces. The value case is practical rather than decorative. Better irrigation helps buyers limit brown zones and overwatered patches before turf stress turns visible. The same system choice can reduce nozzle failure and labor-intensive schedule changes at staffed sites. The same purchase also touches contractor work, pump sizing and adjacent pitch irrigation systems used for natural turf venues.
Regional adoption differs by water pressure, sports funding and contractor depth. North American buyers focus on retrofits and golf water budgets. European buyers select systems around field quality and public funding rules. China and India show project-led demand tied to public venues and institutional sports fields. Strategic value rises once controllers and pumps connect to sprinklers and maintenance service in one operating plan.
| Metric | Value |
|---|---|
| 2025 Market Size | USD 3.0 billion |
| 2026 Market Size | USD 3.2 billion |
| 2036 Market Size | USD 6.1 billion |
| Forecast CAGR (2026-2036) | 6.6% |
| Leading System Type | Sprinkler Irrigation |
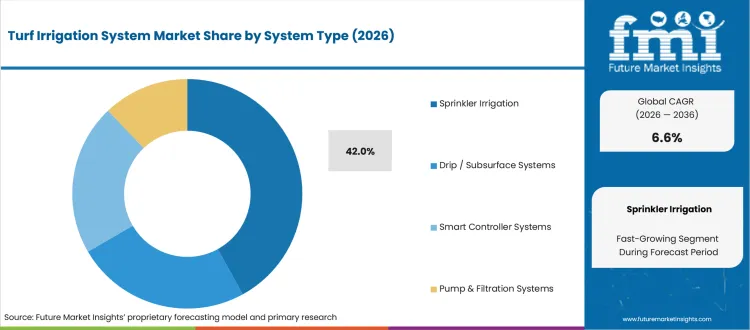
| Sprinkler Irrigation Share (2026) | 42.0% |
| Leading Application | Sports Fields |
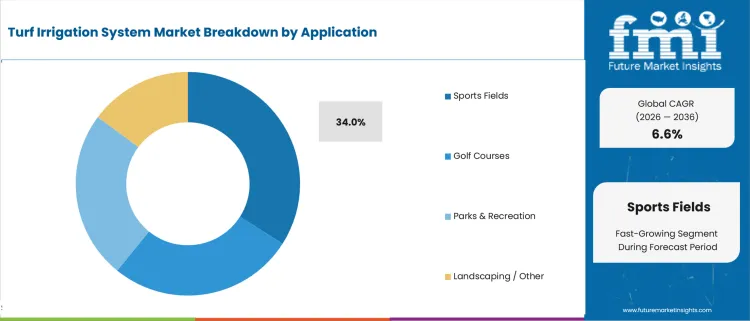
| Sports Fields Share (2026) | 34.0% |
| Leading Control Type | Manual / Timer-based |
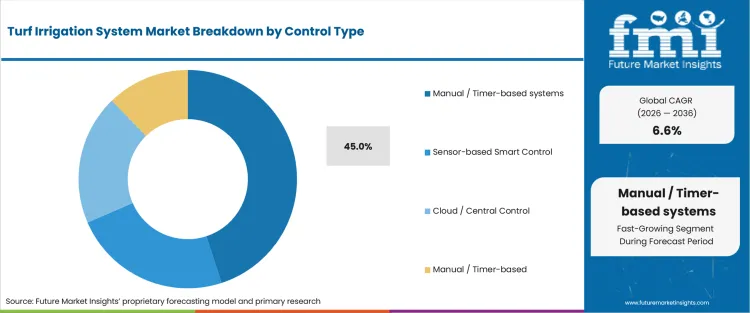
| Manual / Timer-based Share (2026) | 45.0% |
| Fastest-growing Country | China |
| China CAGR by 2036 | 7.4% |
Summary of the Turf Irrigation System Market
| Market Signal | Commercial Impact |
|---|---|
| Demand and Growth Drivers | Demand for turf irrigation systems is increasing as golf courses, sports facilities, and public infrastructure projects prioritize water conservation, turf quality, and efficient irrigation management.
|
| Product and Segment View | Sprinkler irrigation systems, sports field applications, and manual/timer-based controls continue to represent the leading commercial opportunities across the market.
|
| Geography and Growth Outlook | North America and Asia continue to drive market expansion through golf course modernization, sports infrastructure investment, and increasing focus on efficient water management.
|
| Competitive Landscape | Competition increasingly focuses on irrigation efficiency, smart control technologies, hydraulic design expertise, and long-term installation support.
|
| Analyst Perspective | Turf irrigation systems are evolving from conventional watering equipment into performance-driven infrastructure that improves water efficiency, turf quality, and long-term field sustainability.
- Nandini Roy Choudhury, Principal Consultant at Future Market Insights |
How is the turf irrigation system market segmented?
The Turf Irrigation System industry is segmented by system type, application, control type, component, sales channel, and region.
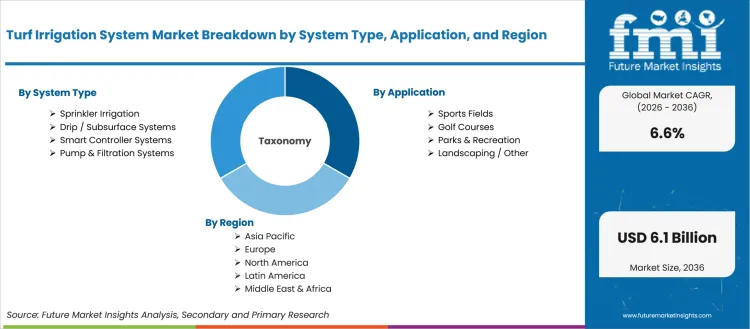
The turf irrigation system market is segmented by system type, application, control type, component, sales channel, and region. System type covers sprinkler irrigation, drip / subsurface systems, smart controller systems, and pump & filtration systems. Application includes sports fields, golf courses, parks & recreation, and landscaping / other. Control type spans manual / timer-based, sensor-based smart control, and cloud / central control. Component covers controllers, sprinklers / nozzles, pumps / valves, and sensors & software. Sales channel includes direct projects, contractors, and distributors. Regional coverage extends across North America, Latin America, Europe, East Asia, South Asia and Pacific, and the Middle East and Africa.
Why does Sprinkler Irrigation matter within the system type category?
Large turf areas need uniform overhead coverage before surface quality becomes visible to players and spectators. Sprinkler irrigation remains relevant owing to sports fields and fairways that require throw distance, pressure stability and serviceable heads. The segment also connects to raingun sprinklers in cases that still depend on pressure performance.
- Sprinkler Irrigation is anticipated to hold 42.0% share of system type demand in 2026, driven by open turf layouts that need even throw patterns. FIFA stadium guidance places turf and pitch design at the core of venue planning. This supports sprinkler layouts that match field geometry and use intensity.
- The operations value is visible surface control. Venue teams can adjust zones, replace heads and test coverage without changing the full buried network. This lowers disruption for sports fields that must stay playable across match calendars and school use periods.
What supports Sports Fields demand within the application category?
School districts, clubs and municipalities need fields that can survive repeat use without long closure periods. Irrigation decisions sit next to drainage, turf renovation and safety planning. That makes sports fields a project-led application shaped by contractor design choices and post-installation maintenance access.
- Sports Fields is predicted to hold 34.0% share in 2026, supported by public venue programs and institutional projects. FIFA reported in April 2026 that Korea Football Park includes seven football pitches. Multi-pitch facilities create demand for reliable watering plans and service-ready equipment.
- Facility buyers benefit from field systems that protect playability between events. Better watering reduces dry spots, limits overwatered areas and gives grounds teams a clearer maintenance routine. This makes irrigation part of asset protection rather than a standalone equipment purchase.
How do buyers evaluate Manual / Timer-based control?
Budget buyers often start with timer-based control owing to upfront cost limits in small parks and school fields. The limitation appears during rainfall, heat periods and temporary use changes. Staff must override schedules manually, which raises water waste and can weaken turf quality during busy seasons.
- Manual / Timer-based systems is expected to hold 45.0% of control type demand in 2026, attributable to low-cost requirements across smaller public sites. EPA WaterSense states that labeled controllers apply water at plant-need points. That standard shows why timed systems face replacement pressure in water-stressed accounts.
- The executive case for smarter control is lower operational noise. Site managers can reduce avoidable watering and improve compliance records by moving selected zones from fixed timers to sensor-linked scheduling. This creates retrofit demand without forcing full network replacement at once.
What makes Sprinklers / Nozzles a replacement-focused component?
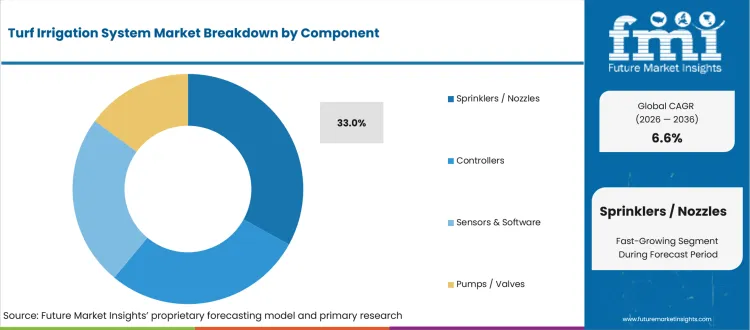
Component spending often starts once turf stress becomes visible. Sprinklers and nozzles wear, clog or drift from the intended pattern. Buyers therefore replace them during audits before committing to pumps, valves or full software upgrades. The component also links to smart sprinkler controller market in managed landscape upkeep.
- Sprinklers / Nozzles are expected to account for 33.0% of component demand in 2026, driven by recurring wear and coverage checks. Rain Bird released the 952LT Long-Throw Block Rotor in March 2026. The product offers a radius of up to 115 feet for larger golf layouts.
- For facility managers, nozzle replacement is a low-disruption route to improve uniformity. Better throw and pressure matching reduce dry edges, wet spots and manual correction work. This makes component upgrades a practical entry point before broader control-system investments.
How are Contractors positioned within sales channels?
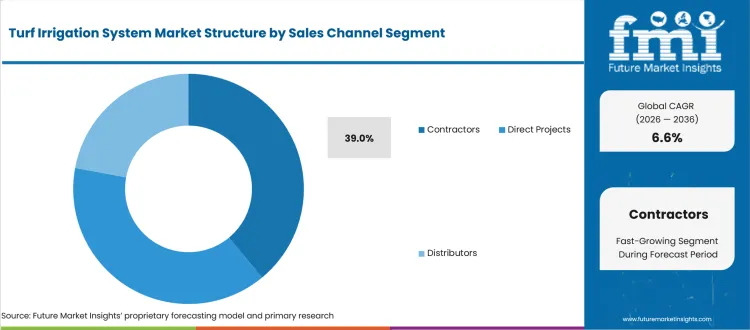
Turf irrigation is rarely a box sale owing to buried pipe condition and pressure. Head spacing and commissioning quality shape the remaining installation risk before projects move into service. Contractors influence the design path before equipment selection. They also shape support needs after installation, especially in retrofits that cannot close active fields for long.
- Contractors are projected to direct 39.0% of sales channel demand in 2026, supported by their role in field audits and installation quality. Public sports projects often combine turf, drainage and irrigation works. This gives contractors a practical position between suppliers, funders and site owners.
- The channel value is accountability during field use. Contractors can test hydraulics, stage retrofits and handle seasonal service without requiring the buyer to manage every technical detail. This supports demand for supplier programs that train installers and protect parts availability.
What are the drivers, restraints, and opportunities in the turf irrigation system market?
Near-term purchases are being shaped by playability requirements, retrofit disruption, and water-efficient service routes outlined below.
- Driver: Playability-based watering is driving upgrades in sites that link surface firmness and turf recovery to match schedules and venue revenue.
- Restraint: Retrofit disruption restrains adoption in venues that have buried pipe networks and pump limits during active sports seasons.
- Opportunity: Water-efficient filtration and control packages gain relevance in projects shaped by reclaimed water, stored water and municipal restrictions.
Sports and golf buyers are expected to increase spending for sites that use irrigation to protect playing time and reduce field repair costs. Rain Bird’s March 2026 952LT rotor release showed a radius of up to 115 feet for larger golf layouts. This product direction matters owing to high-value sites that need coverage planning to reduce head count, simplify spacing decisions and protect fairway quality.
Retrofit projects are expected to remain difficult once old pipes, pumps and wiring limit the benefit of new controllers. Lindsay announced in March 2024 that it would invest over USD 50 million in manufacturing modernization. The project included a 40,000-square-foot facility expansion. This shows why suppliers are investing in production depth and connected equipment. Buyers still need site audits before premium hardware selection.
Water-efficiency opportunities are likely to expand for turf managers that want better control of stored or lower-quality water sources. Rivulis announced in September 2024 the opening of a micro-irrigation facility in North America. The development supports capacity for drip and subsurface formats. This matters for turf sites that evaluate micro irrigation systems beside conventional sprinklers.
Which country CAGRs are profiled in the turf irrigation system market?
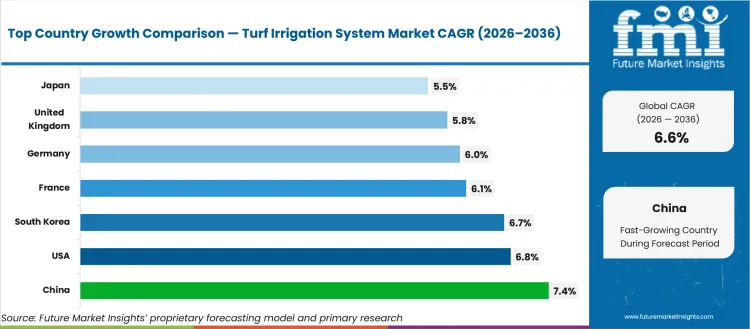
| Country | CAGR |
|---|---|
| United States | 6.8% |
| United Kingdom | 5.8% |
| Germany | 6.0% |
| France | 6.1% |
| Japan | 5.5% |
| China | 7.4% |
| South Korea | 6.7% |
| India | 7.3% |
How do country-level CAGRs compare in the turf irrigation system market?
Country CAGR profiles should be read against the buyer setting rather than climate alone. In North America and Western Europe, demand is tied to retrofits and water budgets alongside contractor-led venue renewal. In China and India, the same systems sit closer to public sports construction and school or campus fields. Japan and South Korea show selective demand tied to compact premium venues. For buyers and suppliers, country variation points to different routes for specification and service access plus financing.
- The United States is projected to record 6.8% CAGR by 2036, supported by golf water budgeting and municipal field upgrades. GCSAA reported in December 2025 that two-thirds of the golf water reduction from 2005 to 2024 was likely tied to operational efficiency improvements. This makes the United States more retrofit-led than project-led markets.
- The United Kingdom is expected to grow at 5.8% CAGR during the forecast period, owing to selective irrigation in grant-backed venues. UK Parliament reported in January 2026 that government announced £85 million for grassroots sport facilities in 2026/27. This keeps demand visible but measured across community sports projects.
- Germany is forecast to advance at 6.0% CAGR over the assessment period, reinforced by club sport and municipal field upkeep. DOSB research published in 2025 showed around 25,500 clubs worked with schools. This supports multi-use field maintenance demand and keeps buyers focused on durable serviceable equipment.
- France is anticipated to post 6.1% CAGR by 2036, shaped by community sports access and tighter turf maintenance rules. Agence nationale du Sport reported in February 2025 that 95% of Plan 5000 equipment was used by the public. That public-use profile favors reliable systems for shared venues.
- Japan is likely to expand at 5.5% CAGR by 2036, influenced by compact venue management and selective natural turf use. Japan Sport Council’s 2025 material listed Yoyogi National Stadium, AJINOMOTO NATIONAL TRAINING CENTER and AJINOMOTO FIELD NISHIGAOKA among managed facilities. This supports replacement-led demand for high-use sites.
- China is estimated to rise at 7.4% CAGR between 2026 and 2036, driven by public venue scale and sports-service spending. China Sporting Goods Federation reported in June 2025 that China had 4.8417 million sports venues in 2024. The scale gives China a broader project base than more retrofit-heavy countries.
- Demand in South Korea is projected to grow at 6.7% CAGR by 2036, supported by elite football assets and municipal sports complexes. FIFA reported in April 2026 that FIFA Forward funded five pitches at the new national training centre. The profile is compact but premium-spec in procurement behavior.
- India is forecast to record 7.3% CAGR over the assessment period, attributable to public sports funding and private institutional fields. The Press Information Bureau reported in August 2024 that 343 sports infrastructure projects had been sanctioned across states and territories. This supports a project-led path for irrigation vendors.
Who are the notable companies in the turf irrigation system market?
Toro, Rain Bird, Hunter Industries, Netafim, Rivulis, Lindsay Corporation, Valmont, Weathermatic, Irritrol and Perrot are the notable companies shaping this market.
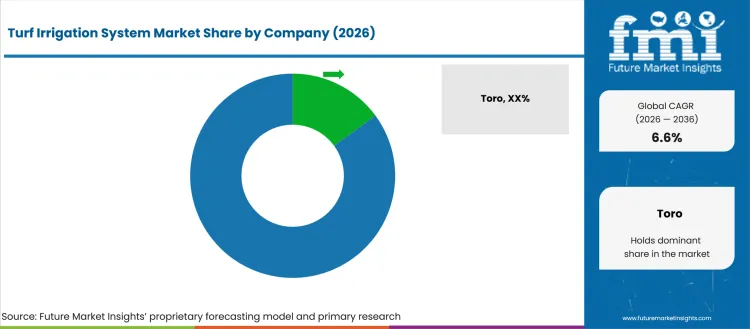
Supplier selection is shaped by the layer of the irrigation problem the buyer wants to solve. Toro and Rain Bird are more relevant alongside Hunter Industries for sites that need rotors and central control to support sports turf performance. Netafim and Rivulis become important for sites guided by subsurface delivery, filtration and water efficiency. Lindsay Corporation and Valmont gain relevance in pump-linked and remote-control contexts. Weathermatic, Irritrol and Perrot are better suited to practical contractor-led projects and regional sports-field work.
- Golf-course buyers often evaluate Toro and Rain Bird first due to central control depth, rotor portfolios and service relationships. These suppliers matter once superintendents need zone control, diagnostics and course-level support during active play periods.
- Sports-field and landscape contractors use Hunter Industries and Irritrol if standard parts, controller familiarity and distributor access reduce service risk. Their role is practical in school fields, parks and mid-sized venues that need reliable replacement support.
- Water-efficient designs give Netafim and Rivulis relevance in subsurface or filtration-heavy projects. These companies bring dripline, micro-irrigation and water-management knowledge into turf cases that compare conventional sprinklers against synthetic turf market.
- Pump-linked and remote irrigation projects make Lindsay Corporation and Valmont relevant to sites that use stored water or larger hydraulic assets. Their position connects turf projects to recirculating irrigation pumps and control platforms used in adjacent water systems.
- Turf irrigation value chains also connect to lawn and garden equipment, landscaping services and commercial booster pumps. Pump-linked projects overlap with pressure-management equipment and controller-led projects connect to landscape automation needs.
Competitive Benchmarking: Turf Irrigation System Market
| Company | Turf Rotor & Nozzle Depth | Smart Control Fit | Contractor Service Reach | Geographic Footprint |
|---|---|---|---|---|
| Toro | High | High | Strong | Global |
| Rain Bird | High | High | Strong | Global |
| Hunter Industries | High | Strong | Strong | Global |
| Netafim | Medium | Strong | Medium | Global |
| Rivulis | Medium | Medium | Medium | Global |
| Lindsay Corporation | Low | High | Strong | Global |
| Valmont | Low | Strong | Strong | Global |
| Weathermatic | Low | Strong | Medium | North America |
| Irritrol | Medium | Medium | Medium | North America and Europe |
| Perrot | High | Medium | Strong | Europe and global sports-field projects |
Source: Future Market Insights competitive analysis, 2026. Ratings reflect relative portfolio relevance, workflow or project fit, service capability, and geographic reach.
Key Developments in the Turf Irrigation System Market
- In January 2024, Rain Bird became the official irrigation partner for Pinehurst Resort. The relationship covered equipment, service and support for Pinehurst No. 10 and The Cradle. The development matters owing to reference golf sites that help suppliers prove service quality and course-level irrigation reliability.
- In January 2024, Toro introduced Lynx Drive golf irrigation software. The launch targeted easier central control and mobile access for golf course irrigation management. The market implication turns software depth into a competitive factor in premium turf accounts.
- In January 2024, Lindsay unveiled FieldNET NextGen for precision irrigation management. The interface focused on clearer maps and mobile control for irrigation decisions. The development points to a wider control-platform trend that can influence remote water management in large turf sites.
- In March 2026, Rain Bird released the 952LT Long-Throw Block Rotor. The rotor offers a maximum radius of up to 115 feet for golf layouts. The launch supports fewer-head design options in selected course projects and gives buyers another rotor choice for large areas.
Key Players in the Turf Irrigation System Market
Golf and Sports Turf Irrigation Leaders
- Toro
- Rain Bird
- Hunter Industries
Precision and Subsurface Specialists
- Netafim
- Rivulis
- Lindsay Corporation
- Valmont
Smart Control and Regional Specialists
- Weathermatic
- Irritrol
- Perrot
Turf Irrigation System Market - Report Scope
| Coverage field | Report scope |
|---|---|
| Market breakdown | Turf Irrigation System Market Breakdown By System Type, Application, Control Type, Component, Sales Channel, and Region |
| Market Definition | Engineered watering systems used to maintain turf in sports fields, golf courses, parks and managed landscapes. |
| Regions Covered | North America, Latin America, Europe, East Asia, South Asia and Pacific, Middle East and Africa |
| Countries Covered | United States, United Kingdom, Germany, France, Japan, China, South Korea, India and broader regional coverage |
| Key Companies Profiled | Toro, Rain Bird, Hunter Industries, Netafim, Rivulis, Lindsay Corporation, Valmont, Weathermatic, Irritrol, Perrot |
| Forecast Period | 2026 to 2036 |
| Approach | Hybrid bottom-up and top-down methodology using project activity, equipment pricing, replacement cycles, contractor input and country-level application mix |
Turf Irrigation System Market - Research Methodology
| Method | Approach |
|---|---|
| Primary Research | FMI analysts reviewed inputs from turf managers, golf superintendents, irrigation contractors, landscape architects, sports facility buyers and distributors. Interviews focused on specification triggers, replacement cycles, service pain points and price sensitivity. |
| Desk Research | Desk research covered sports facility guidance, water conservation sources, public sports infrastructure programs and official company product information. Product checks focused on rotors, controllers, pumps, sensors, valves and service channels. |
| Market Sizing and Forecasting | The model combined system volume, equipment pricing, replacement frequency, application mix and contractor-led retrofit activity. Country differences were adjusted using sports infrastructure activity, golf course intensity and water pressure. |
| Data Validation | Forecasts were checked against smart controller adoption, golf irrigation modernization, public venue investment and verified company portfolios. Duplicate evidence statistics were removed before assigning claims to sections. |
Turf Irrigation System Market by Segments
Turf Irrigation System Market segmented by System Type:
- Sprinkler Irrigation
- Drip / Subsurface Systems
- Smart Controller Systems
- Pump & Filtration Systems
Turf Irrigation System Market segmented by Application:
- Sports Fields
- Golf Courses
- Parks & Recreation
- Landscaping / Other
Turf Irrigation System Market segmented by Control Type:
- Manual / Timer-based
- Sensor-based Smart Control
- Cloud / Central Control
Turf Irrigation System Market segmented by Component:
- Controllers
- Sprinklers / Nozzles
- Pumps / Valves
- Sensors & Software
Turf Irrigation System Market segmented by Sales Channel:
- Direct Projects
- Contractors
- Distributors
Turf Irrigation System Market by Region:
- North America
- United States
- Canada
- Mexico
- Latin America
- Brazil
- Chile
- Rest of Latin America
- Western Europe
- Germany
- UK
- Italy
- Spain
- France
- Nordic
- BENELUX
- Rest of Western Europe
- Eastern Europe
- Russia
- Poland
- Hungary
- Balkan & Baltic
- Rest of Eastern Europe
- East Asia
- China
- Japan
- South Korea
- South Asia and Pacific
- India
- ASEAN
- Australia & New Zealand
- Rest of South Asia and Pacific
- Middle East & Africa
- Kingdom of Saudi Arabia
- Other GCC Countries
- Turkiye
- South Africa
- Other African Union
- Rest of Middle East & Africa
Research Sources and Bibliography
- USA Environmental Protection Agency. (2026, March 5). WaterSense labeled controllers. EPA. https://www.epa.gov/watersense/watersense-labeled-controllers
- Golf Course Superintendents Association of America. (2025, December 30). Golf courses reduce water usage by 31 percent according to national survey. GCSAA. https://www.gcsaa.org/who-we-are/media/news-release/2025-news-releases/2025/12/30/golf-courses-reduce-water-usage-by-31-percent-according-to-national-survey
- Department for Culture, Media and Sport. (2024, October 8). Multi-Sport Grassroots Facilities Programme projects: 2024 to 2025. GOV.UK. https://www.gov.uk/guidance/multi-sport-grassroots-facilities-programme-projects-2024-to-2025
- UK Parliament. (2026, January 27). Investment in Grassroots Sport Facilities. UK Parliament. https://questions-statements.parliament.uk/written-statements/detail/2026-01-27/hcws1273
- German Olympic Sports Confederation. (2025). Sport clubs in Germany: Results from the ninth wave of the Sport Development Report. DOSB. https://cdn.dosb.de/Relaunch_2024/Ehrenamt/Downloads/SEB-Bundesbericht-Englisch-bf.pdf
- Agence nationale du Sport. (2025, February 5). Enquête - Plan 5000 Terrains de Sport. Agence nationale du Sport. https://www.agencedusport.fr/actualites/enquete-plan-5000-terrains-de-sport
- Japan Sport Council. (2025). JAPAN SPORT COUNCIL. Japan Sport Council. https://www.jpnsport.go.jp/corp/Portals/0/corp/2025_JSC_Pamphlet_ENG_Web.pdf
- National Bureau of Statistics of China. (2026, January 1). Announcement on total scale and value-added data of national sports industry in 2024. National Bureau of Statistics of China. https://www.stats.gov.cn/english/PressRelease/202601/t20260108_1962260.html
- China Sporting Goods Federation. (2025, June 30). 2025 Trends in China Sporting Goods Industry. China Sporting Goods Federation. https://en.csgf.org.cn/News/IndustryNews/1251.html
- FIFA. (2026, April 8). Korea Republic opens new national training centre with FIFA Forward. FIFA. https://inside.fifa.com/news/korea-republic-opens-new-national-training-center-fifa-forward
- Press Information Bureau. (2024, August 5). Development of Sports Infrastructure in the Country. Government of India. https://www.pib.gov.in/PressReleasePage.aspx?PRID=2041698
- Khelo India. (2024, March 14). Sports Infrastructure Under Khelo India Scheme. Ministry of Youth Affairs and Sports. https://mdsd.kheloindia.gov.in/fund-requests-trackers?page=1
- FIFA. (2026). Turf and pitch design. FIFA Stadium Guidelines. https://inside.fifa.com/innovation/stadium-guidelines/general-process-guidelines/design/turf-and-pitch-design
- Rain Bird Corporation. (2024, January 15). Rain Bird becomes official irrigation partner for Pinehurst Resort. Rain Bird. https://www.rainbird.com/corporate/press-releases/rain-bird-becomes-official-irrigation-partner-pinehurst-resort
- The Toro Company. (2024, January 31). New Toro Lynx Drive revitalizes golf irrigation software. Toro Newsroom. https://newsroom.toro.com/en/news/2024-us/01-31-20024-lynx-drive-revitalizes-golf-irrigation-software
- Lindsay Corporation. (2024, January 22). Lindsay Corporation unveils next generation user interface for precision irrigation management. Lindsay. https://www.lindsay.com/usca/en/about/media-relations/press-releases/lindsay-corporation-unveils-next-generation-user-interface-for-precision-irrigation-management
- Lindsay Corporation. (2024, March 20). Lindsay to invest over $50M to expand, modernize manufacturing facility. Lindsay. https://www.lindsay.com/usca/en/about/media-relations/press-releases/lindsay-to-invest-over-50m-to-expand-modernize-manufacturing-facility
- Rivulis. (2024, September 5). Rivulis unveils North America's largest micro irrigation facility. Rivulis. https://www.rivulis.com/rivulis-unveils-north-americas-largest-micro-irrigation-facility/
- Rain Bird Corporation. (2026, March 30). Reaching farther than ever: Rain Bird Golf unveils a new rotor that inspires larger, more ambitious course designs. Rain Bird. https://www.rainbird.com/corporate/press-releases/reaching-farther-ever-rain-bird-golf-unveils-new-rotor-inspires-larger
This bibliography is provided for reader reference and uses primary government sources, standards bodies and official trade or company sources.
This Report Answers
- What is the expected global value of the Turf Irrigation System Market in 2026 and 2036?
- What CAGR is forecast for turf irrigation systems during the 2026 to 2036 period?
- Which system type has a notable share in 2026?
- Why do sports fields and golf courses buy upgraded turf irrigation systems?
- How do smart controllers shape replacement demand in water-stressed sites?
- Which countries are compared in the turf irrigation system forecast?
- Which companies compete across rotors and controls plus pumps and service channels?
- What components are included within the turf irrigation system definition?
- How does FMI size and forecast turf irrigation demand across countries and segments?
- What supplier-selection factors should buyers assess before installation?
Frequently Asked Questions
Why should executives track the Turf Irrigation System Market?
Executives should track this market because turf irrigation directly affects water cost field uptime and surface quality across sports and recreational venues.
What business problem does the Turf Irrigation System Market address?
It delivers controlled water distribution that keeps turf playable while reducing waste and labor tied to manual schedule corrections.
What should procurement leaders evaluate before selecting suppliers?
Procurement leaders should evaluate coverage uniformity control reliability hydraulic design support component durability and contractor service capability.
What can limit return on investment for buyers?
Return on investment can be limited by retrofit disruption buried pipe constraints and poor control over watering schedules during peak use periods.
How can suppliers build executive confidence?
Suppliers build confidence by proving field performance water efficiency consistent parts availability and dependable post installation service support.
Preview the report firsthand - request a free sample
Get SampleGet the brochure for pricing and purchase details.
Get PDFTable of Content
- Key Takeaways
- Market Size and CAGR
- Top Growth Driver
- Fastest Growing Segment
- Leading Region
- Key Companies
- Emerging Opportunities
- Executive Summary
- Global Market Outlook
- Demand-side Trends
- Supply-side Trends
- Technology Roadmap Analysis
- Analysis and Recommendations
- Analyst Perspective (What is happening? Why now? What should investors know?)
- Key Questions Answered
- How large is the market?
- What is the CAGR?
- What are key trends?
- Which region dominates?
- Who are the leaders?
- Market Overview
- Market Coverage / Taxonomy
- Market Definition / Scope / Limitations
- Research Methodology
- Chapter Orientation
- Analytical Lens and Working Hypotheses
- Market Structure, Signals, and Trend Drivers
- Benchmarking and Cross-market Comparability
- Market Sizing, Forecasting, and Opportunity Mapping
- Research Design and Evidence Framework
- Desk Research Programme (Secondary Evidence)
- Expert Input and Fieldwork (Primary Evidence)
- Tooling, Models, and Reference Databases
- Data Engineering and Model Build
- Quality Assurance and Audit Trail
- Market Background
- Market Dynamics (Drivers, Restraints, Opportunity, Trends)
- Scenario Forecast (Optimistic, Likely, Conservative)
- Impact Analysis
- AI Impact
- Sustainability Impact
- Regulatory Impact
- Technology Impact
- Consumer / Buyer Analysis
- Purchase Drivers
- Adoption Barriers
- Buyer Journey
- Opportunity Map Analysis
- Product Life Cycle Analysis
- Supply Chain Analysis
- Investment Feasibility Matrix
- Value Chain Analysis
- PESTLE and Porter's Analysis
- Regulatory Landscape
- Regional Parent Market Outlook
- Production and Consumption Statistics
- Import and Export Statistics
- Global Market Analysis and Forecast, 2021 to 2036
- Historical Market Size Value (USD Billion) & Volume (Unit) Analysis, 2021 to 2025
- Current and Future Market Size Value (USD Billion) & Volume (Unit) Projections, 2026 to 2036
- Y-o-Y Growth Trend Analysis
- Absolute $ Opportunity Analysis
- Global Market Pricing Analysis, 2021 to 2036
- Global Market Analysis and Forecast, By System Type, 2021 to 2036
- Introduction / Key Findings
- Historical Market Size Value (USD Billion) & Volume (Unit) Analysis By System Type, 2021 to 2025
- Current and Future Market Size Value (USD Billion) & Volume (Unit) Analysis and Forecast By System Type, 2026 to 2036
- Sprinkler Irrigation
- Drip / Subsurface Systems
- Smart Controller Systems
- Pump & Filtration Systems
- Sprinkler Irrigation
- Y-o-Y Growth Trend Analysis By System Type, 2021 to 2025
- Absolute $ Opportunity Analysis By System Type, 2026 to 2036
- Global Market Analysis and Forecast, By Application, 2021 to 2036
- Introduction / Key Findings
- Historical Market Size Value (USD Billion) & Volume (Unit) Analysis By Application, 2021 to 2025
- Current and Future Market Size Value (USD Billion) & Volume (Unit) Analysis and Forecast By Application, 2026 to 2036
- Sports Fields
- Golf Courses
- Parks & Recreation
- Landscaping / Other
- Sports Fields
- Y-o-Y Growth Trend Analysis By Application, 2021 to 2025
- Absolute $ Opportunity Analysis By Application, 2026 to 2036
- Global Market Analysis and Forecast, By Control Type, 2021 to 2036
- Introduction / Key Findings
- Historical Market Size Value (USD Billion) & Volume (Unit) Analysis By Control Type, 2021 to 2025
- Current and Future Market Size Value (USD Billion) & Volume (Unit) Analysis and Forecast By Control Type, 2026 to 2036
- Manual / Timer-based systems
- Sensor-based Smart Control
- Cloud / Central Control
- Manual / Timer-based systems
- Y-o-Y Growth Trend Analysis By Control Type, 2021 to 2025
- Absolute $ Opportunity Analysis By Control Type, 2026 to 2036
- Global Market Analysis and Forecast, By Component, 2021 to 2036
- Introduction / Key Findings
- Historical Market Size Value (USD Billion) & Volume (Unit) Analysis By Component, 2021 to 2025
- Current and Future Market Size Value (USD Billion) & Volume (Unit) Analysis and Forecast By Component, 2026 to 2036
- Sprinklers / Nozzles
- Controllers
- Sensors & Software
- Pumps / Valves
- Sprinklers / Nozzles
- Y-o-Y Growth Trend Analysis By Component, 2021 to 2025
- Absolute $ Opportunity Analysis By Component, 2026 to 2036
- Global Market Analysis and Forecast, By Sales Channel, 2021 to 2036
- Introduction / Key Findings
- Historical Market Size Value (USD Billion) & Volume (Unit) Analysis By Sales Channel, 2021 to 2025
- Current and Future Market Size Value (USD Billion) & Volume (Unit) Analysis and Forecast By Sales Channel, 2026 to 2036
- Contractors
- Direct Projects
- Distributors
- Contractors
- Y-o-Y Growth Trend Analysis By Sales Channel, 2021 to 2025
- Absolute $ Opportunity Analysis By Sales Channel, 2026 to 2036
- Global Market Analysis and Forecast, By Region, 2021 to 2036
- Introduction
- Historical Market Size Value (USD Billion) & Volume (Unit) Analysis By Region, 2021 to 2025
- Current Market Size Value (USD Billion) & Volume (Unit) Analysis and Forecast By Region, 2026 to 2036
- North America
- Latin America
- Western Europe
- Eastern Europe
- East Asia
- South Asia and Pacific
- Middle East & Africa
- Market Attractiveness Analysis By Region
- North America Market Analysis and Forecast, By Country, 2021 to 2036
- Historical Market Size Value (USD Billion) & Volume (Unit) Trend Analysis By Market Taxonomy, 2021 to 2025
- Market Size Value (USD Billion) & Volume (Unit) Forecast By Market Taxonomy, 2026 to 2036
- By Country
- USA
- Canada
- Mexico
- By System Type
- By Application
- By Control Type
- By Component
- By Sales Channel
- By Country
- Market Attractiveness Analysis
- By Country
- By System Type
- By Application
- By Control Type
- By Component
- By Sales Channel
- Key Takeaways
- Latin America Market Analysis and Forecast, By Country
- Historical Market Size Value (USD Billion) & Volume (Unit) Trend Analysis By Market Taxonomy, 2021 to 2025
- Market Size Value (USD Billion) & Volume (Unit) Forecast By Market Taxonomy, 2026 to 2036
- By Country
- Brazil
- Chile
- Rest of Latin America
- By System Type
- By Application
- By Control Type
- By Component
- By Sales Channel
- By Country
- Market Attractiveness Analysis
- By Country
- By System Type
- By Application
- By Control Type
- By Component
- By Sales Channel
- Key Takeaways
- Western Europe Market Analysis and Forecast, By Country
- Historical Market Size Value (USD Billion) & Volume (Unit) Trend Analysis By Market Taxonomy, 2021 to 2025
- Market Size Value (USD Billion) & Volume (Unit) Forecast By Market Taxonomy, 2026 to 2036
- By Country
- Germany
- UK
- Italy
- Spain
- France
- Nordic
- BENELUX
- Rest of Western Europe
- By System Type
- By Application
- By Control Type
- By Component
- By Sales Channel
- By Country
- Market Attractiveness Analysis
- By Country
- By System Type
- By Application
- By Control Type
- By Component
- By Sales Channel
- Key Takeaways
- Eastern Europe Market Analysis and Forecast, By Country
- Historical Market Size Value (USD Billion) & Volume (Unit) Trend Analysis By Market Taxonomy, 2021 to 2025
- Market Size Value (USD Billion) & Volume (Unit) Forecast By Market Taxonomy, 2026 to 2036
- By Country
- Russia
- Poland
- Hungary
- Balkan & Baltic
- Rest of Eastern Europe
- By System Type
- By Application
- By Control Type
- By Component
- By Sales Channel
- By Country
- Market Attractiveness Analysis
- By Country
- By System Type
- By Application
- By Control Type
- By Component
- By Sales Channel
- Key Takeaways
- East Asia Market Analysis and Forecast, By Country
- Historical Market Size Value (USD Billion) & Volume (Unit) Trend Analysis By Market Taxonomy, 2021 to 2025
- Market Size Value (USD Billion) & Volume (Unit) Forecast By Market Taxonomy, 2026 to 2036
- By Country
- China
- Japan
- South Korea
- By System Type
- By Application
- By Control Type
- By Component
- By Sales Channel
- By Country
- Market Attractiveness Analysis
- By Country
- By System Type
- By Application
- By Control Type
- By Component
- By Sales Channel
- Key Takeaways
- South Asia and Pacific Market Analysis and Forecast, By Country
- Historical Market Size Value (USD Billion) & Volume (Unit) Trend Analysis By Market Taxonomy, 2021 to 2025
- Market Size Value (USD Billion) & Volume (Unit) Forecast By Market Taxonomy, 2026 to 2036
- By Country
- India
- ASEAN
- Australia & New Zealand
- Rest of South Asia and Pacific
- By System Type
- By Application
- By Control Type
- By Component
- By Sales Channel
- By Country
- Market Attractiveness Analysis
- By Country
- By System Type
- By Application
- By Control Type
- By Component
- By Sales Channel
- Key Takeaways
- Middle East & Africa Market Analysis and Forecast, By Country
- Historical Market Size Value (USD Billion) & Volume (Unit) Trend Analysis By Market Taxonomy, 2021 to 2025
- Market Size Value (USD Billion) & Volume (Unit) Forecast By Market Taxonomy, 2026 to 2036
- By Country
- Kingdom of Saudi Arabia
- Other GCC Countries
- Türkiye
- South Africa
- Other African Union
- Rest of Middle East & Africa
- By System Type
- By Application
- By Control Type
- By Component
- By Sales Channel
- By Country
- Market Attractiveness Analysis
- By Country
- By System Type
- By Application
- By Control Type
- By Component
- By Sales Channel
- Key Takeaways
- Key Countries Market Analysis
- USA
- Pricing Analysis
- Market Share Analysis, 2025
- By System Type
- By Application
- By Control Type
- By Component
- By Sales Channel
- Canada
- Pricing Analysis
- Market Share Analysis, 2025
- By System Type
- By Application
- By Control Type
- By Component
- By Sales Channel
- Mexico
- Pricing Analysis
- Market Share Analysis, 2025
- By System Type
- By Application
- By Control Type
- By Component
- By Sales Channel
- Brazil
- Pricing Analysis
- Market Share Analysis, 2025
- By System Type
- By Application
- By Control Type
- By Component
- By Sales Channel
- Chile
- Pricing Analysis
- Market Share Analysis, 2025
- By System Type
- By Application
- By Control Type
- By Component
- By Sales Channel
- Germany
- Pricing Analysis
- Market Share Analysis, 2025
- By System Type
- By Application
- By Control Type
- By Component
- By Sales Channel
- UK
- Pricing Analysis
- Market Share Analysis, 2025
- By System Type
- By Application
- By Control Type
- By Component
- By Sales Channel
- Italy
- Pricing Analysis
- Market Share Analysis, 2025
- By System Type
- By Application
- By Control Type
- By Component
- By Sales Channel
- Spain
- Pricing Analysis
- Market Share Analysis, 2025
- By System Type
- By Application
- By Control Type
- By Component
- By Sales Channel
- France
- Pricing Analysis
- Market Share Analysis, 2025
- By System Type
- By Application
- By Control Type
- By Component
- By Sales Channel
- India
- Pricing Analysis
- Market Share Analysis, 2025
- By System Type
- By Application
- By Control Type
- By Component
- By Sales Channel
- ASEAN
- Pricing Analysis
- Market Share Analysis, 2025
- By System Type
- By Application
- By Control Type
- By Component
- By Sales Channel
- Australia & New Zealand
- Pricing Analysis
- Market Share Analysis, 2025
- By System Type
- By Application
- By Control Type
- By Component
- By Sales Channel
- China
- Pricing Analysis
- Market Share Analysis, 2025
- By System Type
- By Application
- By Control Type
- By Component
- By Sales Channel
- Japan
- Pricing Analysis
- Market Share Analysis, 2025
- By System Type
- By Application
- By Control Type
- By Component
- By Sales Channel
- South Korea
- Pricing Analysis
- Market Share Analysis, 2025
- By System Type
- By Application
- By Control Type
- By Component
- By Sales Channel
- Russia
- Pricing Analysis
- Market Share Analysis, 2025
- By System Type
- By Application
- By Control Type
- By Component
- By Sales Channel
- Poland
- Pricing Analysis
- Market Share Analysis, 2025
- By System Type
- By Application
- By Control Type
- By Component
- By Sales Channel
- Hungary
- Pricing Analysis
- Market Share Analysis, 2025
- By System Type
- By Application
- By Control Type
- By Component
- By Sales Channel
- Kingdom of Saudi Arabia
- Pricing Analysis
- Market Share Analysis, 2025
- By System Type
- By Application
- By Control Type
- By Component
- By Sales Channel
- Türkiye
- Pricing Analysis
- Market Share Analysis, 2025
- By System Type
- By Application
- By Control Type
- By Component
- By Sales Channel
- South Africa
- Pricing Analysis
- Market Share Analysis, 2025
- By System Type
- By Application
- By Control Type
- By Component
- By Sales Channel
- USA
- Market Structure Analysis
- Competition Dashboard
- Competition Benchmarking
- Market Share Analysis of Top Players
- By Regional
- By System Type
- By Application
- By Control Type
- By Component
- By Sales Channel
- Emerging Startups
- Innovation Benchmarking
- Competition Analysis
- Competition Deep Dive
- Toro
- Overview
- Product Portfolio
- Profitability by Market Segments (Product/Region/Sales Channel)
- Sales Footprint
- Strategy Overview
- Marketing Strategy
- Product Strategy
- Channel Strategy
- Rain Bird
- Hunter Industries
- Netafim
- Rivulis
- Lindsay Corporation
- Toro
- Case Studies
- Success Stories
- Recent Developments
- Competition Deep Dive
- Assumptions & Acronyms Used


