The demand for bioimpedance spectroscopy in the USA is projected to grow from USD 218.5 million in 2025 to USD 532.2 million by 2035, reflecting a CAGR of 9.3%. Bioimpedance spectroscopy, a non-invasive technique used to measure body composition and fluid balance, is increasingly utilized in clinical diagnostics, chronic disease management, and fitness applications. The rise in chronic diseases such as obesity, diabetes, and heart disease, which require regular monitoring of body composition, will be a key driver for the growth of this technology. Additionally, bioimpedance spectroscopy's application in monitoring hydration levels and nutritional status will continue to gain traction, especially in hospital settings, sports science, and wellness centers.
The market will benefit from technological advancements, making bioimpedance spectroscopy devices more affordable, portable, and user-friendly. As the healthcare industry focuses on preventive care and personalized treatment, the need for real-time and accurate health monitoring systems will drive demand. The ongoing shift toward patient-centered care and the integration of bioimpedance spectroscopy into telemedicine and home care solutions will further fuel market expansion, particularly as healthcare providers strive to offer more cost-effective and non-invasive alternatives to traditional diagnostic methods.
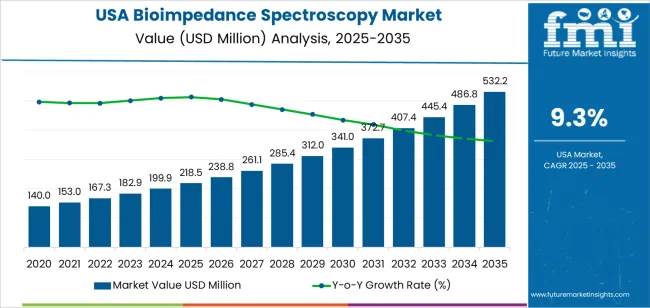
From 2025 to 2030, the demand for bioimpedance spectroscopy in the USA will grow from USD 218.5 million to USD 341 million, adding USD 122.5 million in value. This early phase will experience significant acceleration driven by the growing recognition of bioimpedance spectroscopy’s clinical utility in chronic disease management and preventive healthcare. The expansion will be particularly notable in hospital environments, sports medicine, and fitness sectors, where accurate monitoring of body composition and hydration is crucial for patient care and performance optimization. Technological improvements and cost reductions will also make bioimpedance devices more accessible to a broader range of healthcare providers, thus expanding the market.
From 2030 to 2035, the market will grow from USD 341 million to USD 532.2 million, contributing an additional USD 191.2 million in value. This phase will reflect a moderation in growth as the market matures, but the demand will remain strong due to increasing adoption of bioimpedance spectroscopy in preventive medicine, personal health monitoring, and home care. The focus will shift toward the integration of bioimpedance systems into personalized healthcare solutions, with more emphasis on telehealth and patient self-monitoring. As healthcare systems evolve, bioimpedance spectroscopy will become a standard tool for non-invasive health assessment, supporting steady market growth even as the rate of acceleration slows.
| Metric | Value |
|---|---|
| Industry Sales Value (2025) | USD 218.5 million |
| Industry Forecast Value (2035) | USD 532.2 million |
| Industry Forecast CAGR (2025-2035) | 9.3% |
Demand for bioimpedance spectroscopy (BIS) in the USA is expanding as healthcare and research organisations adopt non invasive tools to assess fluid status, body composition and tissue health. The technique offers real time monitoring of intracellular and extracellular water, fat free mass and other physiological parameters. According to industry projections, this market in the USA is expected to grow at a compound annual growth rate (CAGR) of 9.3 % between 2025 and 2035. Growing incidence of chronic conditions such as heart failure, renal disease and oncology, where fluid status monitoring is critical, amplifies demand for BIS equipment in clinical settings.
Another driver is the trend toward remote and preventive healthcare, combined with integration of BIS technology into wellness, fitness and sports science applications. Portable and wearable BIS devices support telehealth, outpatient monitoring and personalised care models. Research growth in modalities such as multi frequency BIS and segmental body measurement also widens application scope. At the same time, challenges such as the need for regulatory clearance, standardisation of measurement protocols and implementation costs remain. Nonetheless, given the convergence of clinical demand, technological innovation and system integration readiness, the market for bioimpedance spectroscopy in the USA is positioned for sustained growth.
The demand for bioimpedance spectroscopy in the USA is primarily driven by product type and modality. The leading product type is multiple frequency, capturing 53% of the market share, while hand-to-foot BIA dominates the modality segment, accounting for 41.2% of the demand. Bioimpedance spectroscopy is a key technology used to measure body composition, including body fat, muscle mass, and water distribution, playing a significant role in clinical diagnostics and fitness monitoring.
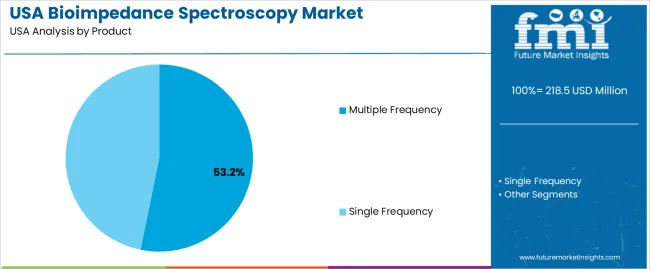
Multiple frequency bioimpedance spectroscopy products lead the market in the USA, holding 53% of the demand. Multiple frequency bioimpedance devices work by applying different electrical frequencies to measure the impedance at various tissue depths. This approach provides more detailed and accurate information about body composition, especially regarding fluid distribution and tissue properties, making it highly useful for medical diagnostics and personalized healthcare.
The growing demand for multiple frequency bioimpedance spectroscopy is driven by its higher accuracy and ability to assess complex body composition metrics, such as total body water, fat-free mass, and extracellular fluid. These devices are commonly used in healthcare settings to monitor conditions like obesity, cardiovascular diseases, and chronic kidney disease, where understanding fluid balance and body composition is crucial. The continued advancements in multiple frequency technology, along with an increasing focus on precision medicine, ensure that multiple frequency bioimpedance spectroscopy will remain a dominant product type in the market.
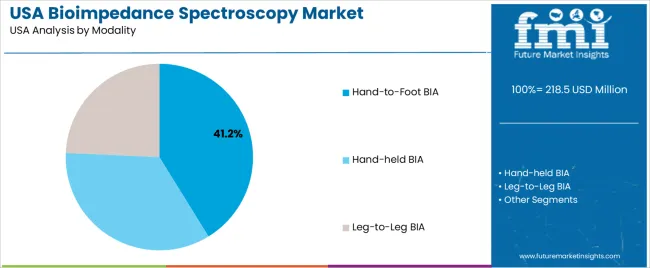
Hand-to-foot BIA is the leading modality for bioimpedance spectroscopy in the USA, capturing 41.2% of the demand. This modality involves the measurement of impedance between electrodes placed on the hands and feet, offering a non-invasive and simple method for assessing body composition. It is widely used in both clinical and fitness settings to monitor changes in body composition over time.
The demand for hand-to-foot BIA is driven by its ease of use, comfort, and reliability, making it a popular choice for both professional healthcare providers and consumers. This modality is particularly useful for general body composition assessments, as it provides accurate measurements of fat mass, muscle mass, and hydration status. The growing popularity of wellness and fitness tracking, combined with the increasing focus on preventive healthcare, is contributing to the continued growth of hand-to-foot BIA in the USA. As the demand for non-invasive, user-friendly body composition tools continues to rise, hand-to-foot BIA is expected to maintain its dominant position in the market.
Demand for bioimpedance spectroscopy (BIS) in the USA is driven by its expanded use in diagnostics, body composition analysis, fluid monitoring and wellness applications. Its non invasive nature and ability to provide real time data support adoption across clinical and consumer markets. Growth is supported by rising chronic disease incidence, an ageing population and interest in personalised medicine. At the same time, equipment cost, accuracy concerns and regulatory complexity moderate the rate of uptake. These factors shape the market opportunity for BIS solutions in the USA
Several drivers support market expansion. First, growing prevalence of conditions such as heart failure, kidney disease, lymphedema and obesity increases demand for monitoring tools that assess tissue fluid, composition and body mass. Second, clinical interest in personalised and preventive health care fuels demand for BIS devices that offer non invasive and rapid assessment. Third, advances in device technology including multi frequency BIS systems, wearable formats and wireless connectivity improve functionality and appeal. Fourth, increased use of BIS in fitness, wellness and home care markets broadens the addressable market beyond hospitals and clinics.
Despite favourable drivers, several constraints apply. The capital cost of sophisticated BIS devices and their consumables may limit adoption, especially in smaller practices or clinics. Accuracy and consistency of readings can vary depending on patient hydration, electrode placement and device calibration, which may reduce clinician confidence. Regulatory clearance and reimbursement pathways for novel BIS applications remain complex and can delay deployment. Additionally, competition from established diagnostic modalities (such as DEXA, MRI) and traditional monitoring tools may slow penetration in certain segments.
Important trends include growing integration of BIS devices with telehealth platforms and remote monitoring ecosystems, enabling home based patient monitoring. The consumer wellness segment is increasingly adopting BIS for body composition and hydration tracking via fitness centres, wearable devices and direct to consumer models. Device makers are emphasising portability, ease of use and integration with electronic health record systems to support broader use. Also, multi‐modality systems combining BIS with ultrasound or bio signals are emerging to enhance diagnostic value and push BIS into new clinical applications.
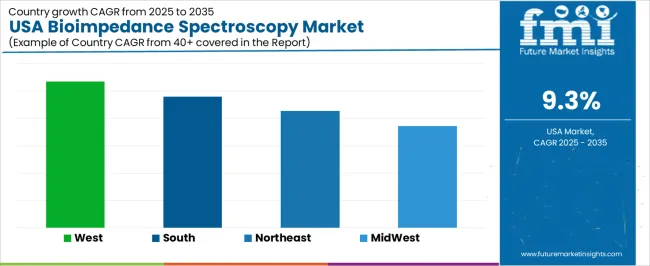
The demand for bioimpedance spectroscopy in the USA shows strong growth across all regions, with the West leading at a CAGR of 10.7%. The South follows closely with a 9.6% CAGR, supported by growing healthcare and medical research sectors. The Northeast, with a CAGR of 8.6%, is also experiencing significant growth, driven by its established healthcare infrastructure and medical technology investments. The Midwest has the lowest growth rate at 7.4%, reflecting more stable adoption trends. Overall, the increasing demand for non-invasive diagnostic tools and growing healthcare investments across the USA are driving substantial growth in bioimpedance spectroscopy, though the rate of growth varies by region.
| Region | CAGR (2025-2035) |
|---|---|
| West | 10.7% |
| South | 9.6% |
| Northeast | 8.6% |
| Midwest | 7.4% |
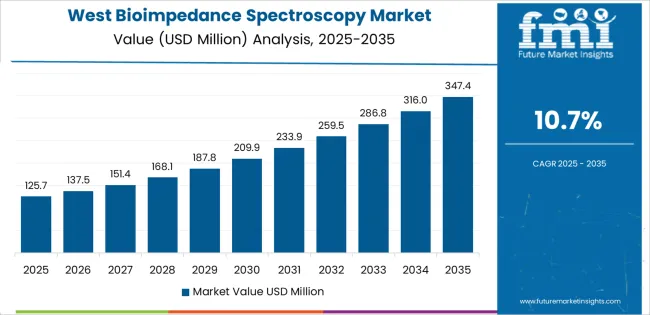
The demand for bioimpedance spectroscopy in the West is projected to grow at an impressive CAGR of 10.7%, fueled by several key factors. The West has a strong healthcare and medical research infrastructure, with leading institutions in states like California, which are at the forefront of adopting advanced medical technologies. The region's focus on non-invasive diagnostic methods, particularly in areas such as oncology, cardiovascular health, and metabolic disorders, is driving increased use of bioimpedance spectroscopy.
Additionally, the West is home to numerous medical technology companies that are innovating and integrating bioimpedance spectroscopy into healthcare systems. The region’s high-tech, research-driven environment, coupled with increasing healthcare investments and an aging population, contributes to the robust demand for this diagnostic tool. As healthcare systems continue to embrace cutting-edge technologies, the demand for bioimpedance spectroscopy in the West is expected to grow significantly.
In the South, the demand for bioimpedance spectroscopy is expected to grow at a CAGR of 9.6%, reflecting the region's expanding healthcare sector and rising interest in non-invasive diagnostic solutions. The South has seen significant investments in healthcare infrastructure, particularly in medical research and advanced diagnostic technologies. Hospitals and medical centers in the region are increasingly adopting bioimpedance spectroscopy to aid in the management of chronic diseases, such as obesity, diabetes, and cardiovascular conditions.
The region’s aging population, combined with a high prevalence of lifestyle-related health issues, further fuels the demand for efficient, non-invasive monitoring tools. As healthcare providers in the South continue to prioritize patient-centered care and cutting-edge technologies, bioimpedance spectroscopy is becoming an essential diagnostic tool. This trend, supported by government initiatives and healthcare funding, positions the South as a key growth region for this technology.
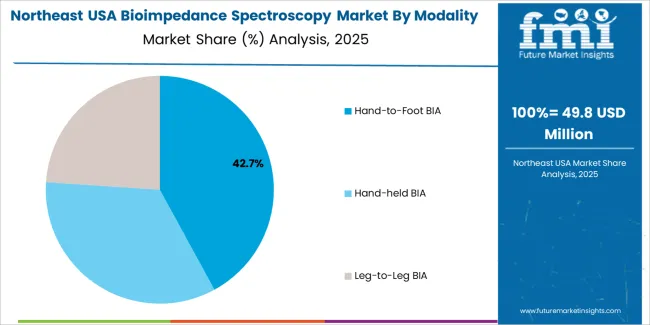
In the Northeast, the demand for bioimpedance spectroscopy is projected to grow at a CAGR of 8.6%, driven by the region's well-established healthcare infrastructure and medical technology innovations. The Northeast is home to several renowned medical institutions and research facilities, particularly in states like Massachusetts and New York, where there is a strong focus on advancing medical diagnostics. The region’s healthcare systems are increasingly adopting bioimpedance spectroscopy as a non-invasive method for monitoring patients' hydration levels, body composition, and other health parameters.
Additionally, as the Northeast’s population ages and healthcare needs grow, demand for advanced diagnostic technologies, including bioimpedance spectroscopy, is expected to increase. The integration of this technology into clinical settings for managing chronic diseases such as heart disease, kidney disease, and obesity is driving significant adoption, positioning the Northeast as a critical region for growth in bioimpedance spectroscopy usage.
In the Midwest, the demand for bioimpedance spectroscopy is expected to grow at a CAGR of 7.4%, reflecting more steady growth compared to other regions. The Midwest has a strong healthcare presence, with major medical centers in cities like Chicago and Cleveland, but it tends to adopt new technologies at a slightly slower pace. However, there is growing interest in non-invasive diagnostic tools, particularly for managing chronic conditions such as diabetes, hypertension, and obesity.
Bioimpedance spectroscopy’s ability to provide valuable insights into body composition and fluid balance without invasive procedures is attracting attention in the region's healthcare settings. The Midwest’s large healthcare infrastructure, combined with its focus on improving patient outcomes and reducing healthcare costs, supports steady adoption of bioimpedance spectroscopy. As awareness of its benefits continues to spread, demand for this technology is expected to grow, albeit at a more moderate rate than in the West and South.
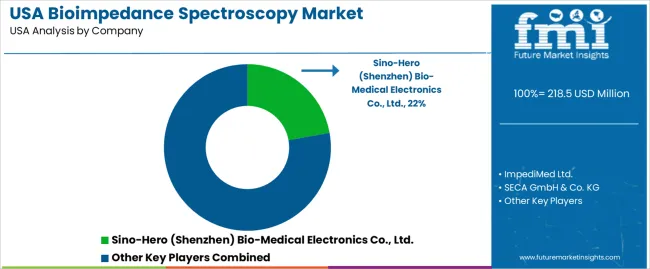
Demand for bioimpedance spectroscopy (BIS) in the United States is increasing due to the growing prevalence of chronic illnesses, the rise in personalized healthcare, and the expansion of wellness and monitoring services. The USA market for BIS is projected to grow at a compound annual growth rate (CAGR) of approximately 9.9%. Key companies providing BIS solutions include Sino-Hero (Shenzhen) Bio-Medical Electronics Co., Ltd., ImpediMed Ltd., SECA GmbH & Co. KG, Bodystat Ltd., and Tanita Corporation.
Competition in this market is focused on device accuracy, clinical application scope, and service integration. Companies develop multi-frequency BIS devices capable of distinguishing intracellular and extracellular fluid, which is useful in fields like nephrology, cardiology, oncology, and nutrition monitoring. Another area of competition is the growing demand for wearable or portable BIS systems, enabling remote monitoring for outpatient and home healthcare.
Companies also differentiate themselves through regulatory support, data analytics integration, and partnerships with healthcare providers for validation studies. Marketing materials typically highlight features such as impedance measurement range, segmental analysis, body-composition data, and connectivity options. By aligning their offerings with the demand for non-invasive diagnostics, personalized monitoring, and efficient clinical workflows, these companies aim to strengthen their presence in the USA bioimpedance spectroscopy industry.
| Items | Details |
|---|---|
| Quantitative Units | USD Million |
| Regions Covered | USA |
| Product | Single Frequency, Multiple Frequency |
| Modality | Hand-held BIA, Hand-to-Foot BIA, Leg-to-Leg BIA |
| End User | Hospitals, Specialty Clinics, Ambulatory Surgical Centers, Rehabilitation Centers |
| Key Companies Profiled | Sino-Hero (Shenzhen) Bio-Medical Electronics Co., Ltd., ImpediMed Ltd., SECA GmbH & Co. KG, Bodystat Ltd., Tanita Corporation |
| Additional Attributes | The market analysis includes dollar sales by product, modality, end-user, and company categories. It also covers regional demand trends in the USA, driven by the increasing use of bioimpedance spectroscopy in medical diagnostics and rehabilitation. The competitive landscape highlights key manufacturers focusing on innovations in bioimpedance technologies for body composition analysis. Trends in the growing adoption of bioimpedance spectroscopy devices in hospitals and specialty clinics for non-invasive health assessments are explored, along with advancements in device functionality and accuracy. |
The demand for bioimpedance spectroscopy in usa is estimated to be valued at USD 218.5 million in 2025.
The market size for the bioimpedance spectroscopy in usa is projected to reach USD 532.2 million by 2035.
The demand for bioimpedance spectroscopy in usa is expected to grow at a 9.3% CAGR between 2025 and 2035.
The key product types in bioimpedance spectroscopy in usa are multiple frequency and single frequency.
In terms of modality, hand-to-foot bia segment is expected to command 41.2% share in the bioimpedance spectroscopy in usa in 2025.


Our Research Products

The "Full Research Suite" delivers actionable market intel, deep dives on markets or technologies, so clients act faster, cut risk, and unlock growth.

The Leaderboard benchmarks and ranks top vendors, classifying them as Established Leaders, Leading Challengers, or Disruptors & Challengers.

Locates where complements amplify value and substitutes erode it, forecasting net impact by horizon

We deliver granular, decision-grade intel: market sizing, 5-year forecasts, pricing, adoption, usage, revenue, and operational KPIs—plus competitor tracking, regulation, and value chains—across 60 countries broadly.

Spot the shifts before they hit your P&L. We track inflection points, adoption curves, pricing moves, and ecosystem plays to show where demand is heading, why it is changing, and what to do next across high-growth markets and disruptive tech

Real-time reads of user behavior. We track shifting priorities, perceptions of today’s and next-gen services, and provider experience, then pace how fast tech moves from trial to adoption, blending buyer, consumer, and channel inputs with social signals (#WhySwitch, #UX).

Partner with our analyst team to build a custom report designed around your business priorities. From analysing market trends to assessing competitors or crafting bespoke datasets, we tailor insights to your needs.
Supplier Intelligence
Discovery & Profiling
Capacity & Footprint
Performance & Risk
Compliance & Governance
Commercial Readiness
Who Supplies Whom
Scorecards & Shortlists
Playbooks & Docs
Category Intelligence
Definition & Scope
Demand & Use Cases
Cost Drivers
Market Structure
Supply Chain Map
Trade & Policy
Operating Norms
Deliverables
Buyer Intelligence
Account Basics
Spend & Scope
Procurement Model
Vendor Requirements
Terms & Policies
Entry Strategy
Pain Points & Triggers
Outputs
Pricing Analysis
Benchmarks
Trends
Should-Cost
Indexation
Landed Cost
Commercial Terms
Deliverables
Brand Analysis
Positioning & Value Prop
Share & Presence
Customer Evidence
Go-to-Market
Digital & Reputation
Compliance & Trust
KPIs & Gaps
Outputs
Full Research Suite comprises of:
Market outlook & trends analysis
Interviews & case studies
Strategic recommendations
Vendor profiles & capabilities analysis
5-year forecasts
8 regions and 60+ country-level data splits
Market segment data splits
12 months of continuous data updates
DELIVERED AS:
PDF EXCEL ONLINE
Bioimpedance Spectroscopy Market – Trends & Forecast 2025 to 2035
Demand for Bioimpedance Spectroscopy in Japan Size and Share Forecast Outlook 2025 to 2035
USA Medical Coding Market Size and Share Forecast Outlook 2025 to 2035
USA Labels Market Size and Share Forecast Outlook 2025 to 2035
USA Plant-based Creamers Market Size and Share Forecast Outlook 2025 to 2035
USA Barrier Coated Paper Market Size and Share Forecast Outlook 2025 to 2035
USA Electronic Health Records (EHR) Market Size and Share Forecast Outlook 2025 to 2035
USA Animal Model Market Size and Share Forecast Outlook 2025 to 2035
USA and Canada Packer Bottle Market Size and Share Forecast Outlook 2025 to 2035
USA Stretch Hood Films Market Size and Share Forecast Outlook 2025 to 2035
USA and Canada Fence Screen Market Size and Share Forecast Outlook 2025 to 2035
USA Lubricant Contaminated HDPE Container Waste Market Size and Share Forecast Outlook 2025 to 2035
USA Commercial Walk-In Refrigeration Market Size and Share Forecast Outlook 2025 to 2035
Bioimpedance Devices Market Analysis - Size, Share, and Forecast 2025 to 2035
USA & Canada Pre-painted Steel Roofing and Cladding Market Size and Share Forecast Outlook 2025 to 2035
USA Residential Cotton Candy Maker Market Size and Share Forecast Outlook 2025 to 2035
USA Faith Based Tourism Market Size and Share Forecast Outlook 2025 to 2035
United States NFC Lemon Juice Market Analysis - Size, Growth and Forecast 2025 to 2035
USA and Canada Copper Market Insights - Demand, Size & Industry Trends 2025 to 2035
USA Ground and Precipitated Calcium Carbonate Market Growth by Product Type, Application, End-Use, and Region in 2025 to 2035

Thank you!
You will receive an email from our Business Development Manager. Please be sure to check your SPAM/JUNK folder too.
Chat With
MaRIA