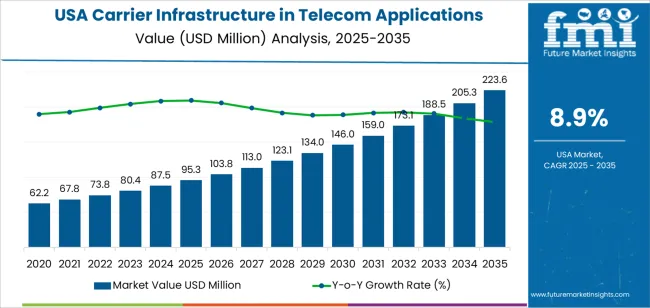
The USA carrier infrastructure in telecom applications demand is valued at USD 95.3 million in 2025 and is forecasted to reach USD 222.5 million by 2035, recording a CAGR of 8.9%. Demand is shaped by ongoing network modernisation, sustained traffic growth across mobile and fixed communication layers, and continued use of legacy network elements that support specialised industrial and rural coverage needs. Carrier infrastructure investments address capacity management, signal reliability, and interoperability across heterogeneous network environments. Growth is further influenced by expansion of connected-device ecosystems, spectrum reallocation, and phased upgrades across national communication networks.
2G infrastructure represents the leading technology due to its continued deployment in machine-to-machine communication, low-bandwidth IoT networks, and remote coverage zones that depend on stable, power-efficient communication protocols. These systems remain embedded in industrial monitoring, transportation tracking, and public-utility applications that require predictable performance and broad geographic reach. Their operational longevity, cost efficiency, and integration with existing network layers support sustained procurement.
Demand is strongest in the West, South, and Northeast, where urban communication networks, enterprise deployments, and regional carriers drive infrastructure investment. Key suppliers include Huawei Technologies Co., Ltd., Ericsson AB, Nokia Corporation, ZTE Corporation, Cisco Systems, Inc., and Samsung Electronics Co., Ltd. These suppliers provide radio-access systems, switching platforms, and transport-network solutions used across national telecom operations.
The 10-year growth comparison shows a stronger expansion phase between 2025 and 2030, supported by continued 5G densification, backhaul-capacity upgrades, and expanded deployment of fibre-supported transport networks. During these years, operators will prioritise network reliability, low-latency connectivity, and integration of cloud-native cores, creating sustained early-period demand. Growth will also be reinforced by edge-computing rollouts and increased small-cell installation across urban areas.
From 2030 to 2035, growth remains steady but becomes more structured as operators shift from large-scale expansion to optimisation cycles. Procurement will centre on lifecycle replacements, software-defined transport upgrades, and incremental improvements in power efficiency and network-management systems. As 5G networks mature and early 6G transition planning begins, spending patterns will stabilise across national carriers. The decade-long comparison reflects a transition from an early investment-driven phase to a mature period defined by system optimisation, network resilience requirements, and predictable capacity upgrades across the USA telecom-infrastructure ecosystem.
| Metric | Value |
|---|---|
| USA Carrier Infrastructure in Telecom Applications Sales Value (2025) | USD 95.3 million |
| USA Carrier Infrastructure in Telecom Applications Forecast Value (2035) | USD 222.5 million |
| USA Carrier Infrastructure in Telecom Applications Forecast CAGR (2025-2035) | 8.9% |
Demand for carrier infrastructure in telecom applications in the USA is increasing because telecommunications operators require upgraded hardware and networks to support greater data volumes, faster speeds and wider device connectivity. Deployment of 5G networks, expansion of fibre-optic backhaul and densification of small-cell sites to meet urban and suburban demand all drive infrastructure investment. Growth in enterprise services, Internet of Things (IoT) devices and cloud applications places heavier load on carrier networks which means more antennas, routers, base stations and tower leasing arrangements are needed.
Government support for broadband access, particularly in underserved rural areas, encourages operators to invest in infrastructure that complements commercial expansion. Constraints include high capital expenditure required for network equipment, spectrum acquisition and site builds along with regulatory and zoning hurdles for deployments in certain jurisdictions. Legacy infrastructure still operating in many locations may delay full upgrade cycles and operators must balance cost-control against service quality and competitive pressure.
Demand for carrier-infrastructure solutions in the United States reflects the coexistence of legacy networks and expanding high-capacity systems. Technology choices vary by network-coverage goals, device compatibility, and upgrade cycles. End-user distribution reflects how telecom operators and public bodies invest in network stability and traffic management. Component requirements highlight the balance between physical infrastructure and service-based support functions needed to manage national communication systems.
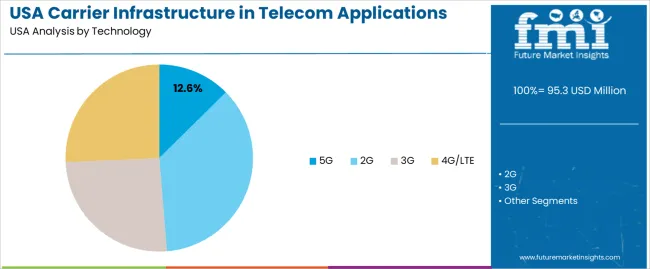
2G systems hold 36.1% of national demand and form the leading technology segment. They remain in use across machine-to-machine links, legacy devices, and low-bandwidth applications where coverage reliability outweighs speed. 4G/LTE represents 25.7%, supporting high-capacity mobility and broad consumer use. The 25.6% share held by 3G reflects its continued, though declining, presence in areas undergoing phased transition. 5G holds 12.6%, serving urban and industrial users requiring high throughput and low latency. Technology distribution reflects the mixed-state nature of USA infrastructure, where legacy networks remain operational while advanced deployments expand gradually across high-traffic corridors and enterprise environments.
Key drivers and attributes:
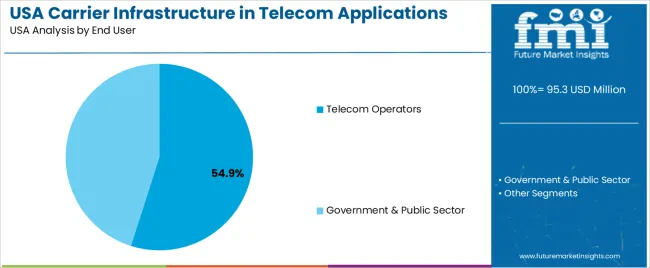
Telecom operators hold 54.9% of national demand and represent the largest end-user category. They maintain broad-area coverage, manage network upgrades, and deploy carrier-grade systems across metropolitan and rural regions. Operators use multi-technology infrastructure to serve mobility, fixed-wireless, and enterprise-connectivity requirements. Government and public-sector entities represent 45.1%, supporting emergency-communication networks, administrative systems, and public-service connectivity. These users prioritise network resilience, secure data handling, and long-term operational reliability. End-user distribution reflects responsibility for national coverage, public-safety communication, and the ongoing need for structured, high-availability infrastructure across administrative sectors.
Key drivers and attributes:
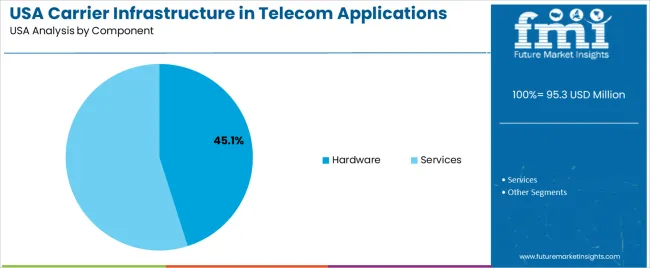
Services represent 54.9% of national demand and form the leading component category. Network planning, deployment support, optimisation, monitoring, and maintenance services ensure reliable performance across multi-layered carrier infrastructure. These services support lifecycle management, fault detection, and capacity planning across varied technology generations. Hardware accounts for 45.1%, including radios, antennas, backhaul equipment, and core-network systems. Hardware demand reflects physical-layer expansion, replacement cycles, and integration with software-driven functions. Component distribution highlights the importance of continuous technical support, performance analytics, and operational management required to maintain nationwide connectivity across legacy and advanced communication systems.
Key drivers and attributes:
In the United States, demand for carrier infrastructure is strong as mobile network operators deploy 5G macro cells and small cells and expand fibre-optic backhaul to support higher data throughput. Consumers and enterprises are consuming more video streaming, cloud services, and connected-device applications, which increases network capacity requirements. Telecom carriers are also deploying edge-computing nodes close to service areas to reduce latency and support applications such as autonomous vehicles, AR/VR, and IoT, which drives investment in infrastructure such as aggregation backhaul, edge data centres and upgraded radio access networks (RAN).
Infrastructure roll-out often faces lengthy permit processes, local zoning and community-approval requirements, which slows deployment of small-cell sites and antenna installations in dense urban areas. Capital cost for fibre deployment, small-cell densification, and equipment upgrades remains high, especially when amortised over relatively low incremental revenue in saturated industries. Some rural and underserved regions have low return-on-investment profiles, which limits carrier willingness to expand infrastructure widely without subsidies or regulatory support.
Carriers and vendors are adopting open‐RAN architectures to reduce vendor dependency, accelerate deployment cycles and introduce more modular equipment. Virtualisation of network functions enables flexible deployment of software-defined infrastructure across data centres and edge sites. Fibre-to-the-tower and fibre-to-the-small-cell backhaul continue to expand, especially in urban and suburban areas. The deployment of MEC and distributed data-centre platforms supports low-latency applications, content delivery networks and IoT services. These infrastructure trends are setting investment priorities for USA telecom operators and continue to shape carrier infrastructure demand.
Demand for carrier infrastructure in USA telecom applications is increasing through 2035 as operators expand fiber networks, modernize radio-access equipment, and deploy advanced transport systems to support rising data traffic, 5G expansion, and distributed cloud architecture. Investments focus on fiber backhaul, small-cell densification, high-capacity microwave links, virtualized network cores, and power-efficient base-station systems. Enterprises, data centers, and public-sector users rely on improved network reliability, low-latency connectivity, and scalable bandwidth delivery. Regional growth varies based on telecom-capital expenditure, data-center concentration, and population density. The West leads with a 10.2% CAGR, followed by the South (9.2%), the Northeast (8.1%), and the Midwest (7.1%).
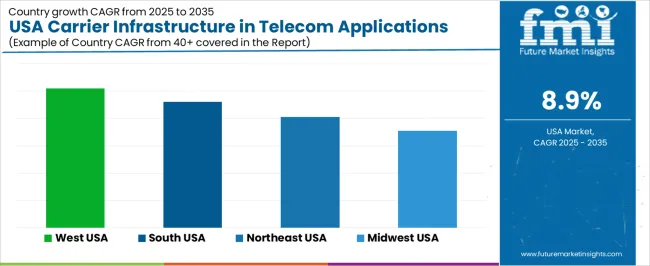
| Region | CAGR (2025-2035) |
|---|---|
| West | 10.2% |
| South | 9.2% |
| Northeast | 8.1% |
| Midwest | 7.1% |
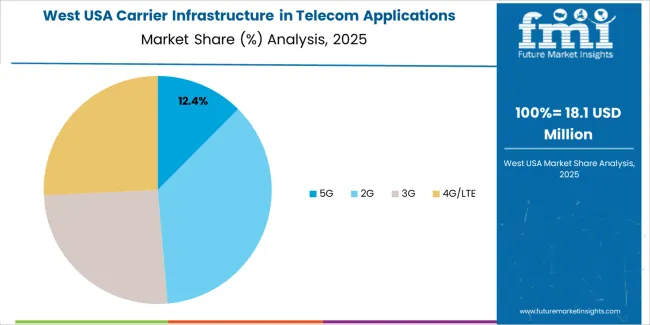
The West grows at 10.2% CAGR, supported by high-density data centers, strong fiber backbone expansion, and intensive 5G deployments across California, Washington, and Oregon. Telecom operators upgrade mid-band and millimeter-wave radio sites using advanced fronthaul and backhaul systems. Data-center corridors require large-capacity optical transport platforms to handle interconnection traffic and distributed computing workloads. Urban districts adopt small-cell installations to support dense user bases and high-bandwidth applications. Fiber-to-the-premises initiatives expand coverage into suburban industries, reinforcing continuous infrastructure upgrades. Network virtualization and cloud-based core functions accelerate adoption of scalable carrier equipment across regional networks.
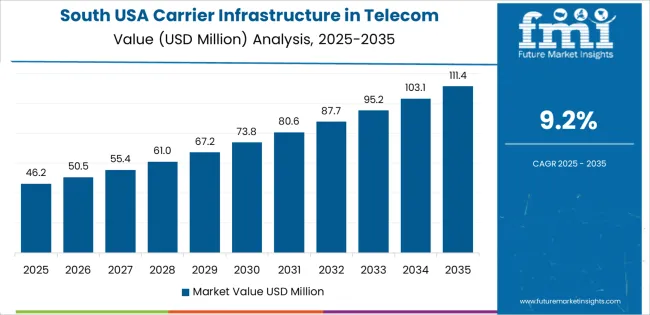
The South grows at 9.2% CAGR, supported by rapid metropolitan expansion, industrial connectivity requirements, and expanding cloud-service footprints across Texas, Florida, Georgia, and North Carolina. Telecom operators invest in fiber backbone extensions, large-scale 5G deployments, and microwave transport links for areas with dispersed populations. Logistics hubs adopt high-capacity connectivity for warehouse automation and fleet-management systems. Data-center projects in Texas increase demand for optical transport equipment and network-interconnection upgrades. Rural broadband programs drive fiber deployment into underserved communities, reinforcing long-term infrastructure spending.
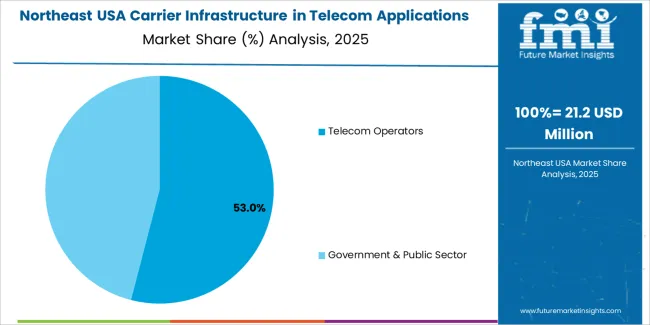
The Northeast grows at 8.1% CAGR, supported by major financial centers, dense urban connectivity requirements, and significant enterprise telecommunications usage across New York, Massachusetts, and Pennsylvania. Operators deploy advanced radio systems and high-capacity backhaul to support business districts with heavy data-traffic loads. Financial institutions rely on low-latency optical connectivity for trading and data-intensive workloads, increasing demand for robust transport platforms. Universities and research institutions adopt high-bandwidth connectivity for distributed computing applications. Telecom networks also invest in indoor coverage systems for office towers and transport hubs with complex architectural environments.
The Midwest grows at 7.1% CAGR, supported by manufacturing operations, logistics centers, and expanding suburban broadband requirements across Illinois, Michigan, Ohio, and Minnesota. Telecom operators upgrade radio-access systems and deploy mid-band 5G across industrial corridors. Fiber-to-the-home and fiber-to-the-business programs support suburban expansion. Logistics and transportation hubs depend on reliable high-capacity connectivity for automation and real-time fleet coordination. Rural broadband initiatives continue to increase fiber deployment across low-density areas. Although growth is slower than in coastal regions, long-term infrastructure upgrades remain steady across industrial and suburban industries.
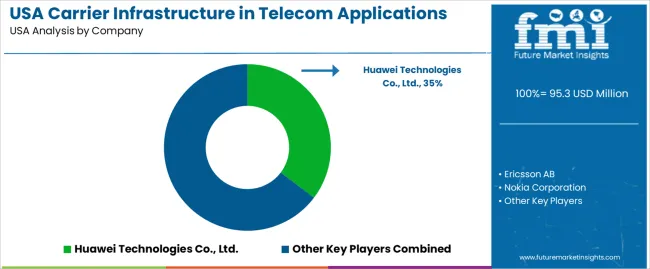
Demand for carrier-infrastructure solutions in the USA is shaped by a concentrated group of global telecom-equipment suppliers supporting radio access networks, transport systems, and core-network modernization. Huawei Technologies Co., Ltd. holds the leading position with an estimated 35.3% share, supported by extensive RAN portfolios, controlled hardware performance, and consistent delivery of high-capacity systems used in large-scale deployments. Its position is reinforced by stable throughput, strong spectral-efficiency characteristics, and integrated hardware-software architectures suited to high-density USA environments.
Ericsson AB and Nokia Corporation follow as significant participants, providing 4G and 5G radio units, baseband platforms, and transport solutions widely adopted by USA operators. Their strengths include predictable radio performance, advanced MIMO capability, and documented reliability across mid-band and low-band deployments. Both companies remain central to ongoing 5G rollouts and modernization of legacy LTE systems.
ZTE Corporation maintains a role in selective applications, supplying radio and core-network elements aligned with operators’ capacity-expansion requirements. Cisco Systems, Inc. supports the segment through IP routing, optical-transport equipment, and core-network solutions used in backbone and data-center environments, emphasizing consistent packet-transport performance and strong security integration. Samsung Electronics Co., Ltd. contributes additional capability with 5G RAN solutions featuring reliable beamforming performance and compact hardware designed for dense urban networks.
Competition across this segment centers on radio-unit efficiency, backhaul stability, interoperability, latency characteristics, security compliance, and lifecycle-support quality. Demand continues to rise as USA carriers advance 5G deployment, network virtualization, capacity scaling, and edge-computing integration, requiring predictable, high-performance carrier-infrastructure systems across nationwide and regional telecom networks.
| Items | Values |
|---|---|
| Quantitative Units | USD million |
| Technology | 5G, 2G, 3G, 4G/LTE |
| End User | Telecom Operators, Government & Public Sector |
| Component | Hardware, Services |
| Regions Covered | West, Midwest, South, Northeast |
| Key Companies Profiled | Huawei Technologies Co., Ltd., Ericsson AB, Nokia Corporation, ZTE Corporation, Cisco Systems, Inc., Samsung Electronics Co., Ltd. |
| Additional Attributes | Dollar sales by technology, end-user, and component categories; regional deployment trends across West, Midwest, South, and Northeast; competitive landscape of telecom infrastructure vendors; advancements in 5G RAN, core network virtualization, small-cell densification, and fiber backhaul systems; integration with public networks, government communication systems, and enterprise connectivity solutions in the USA. |
The global demand for carrier infrastructure in telecom applications in USA is estimated to be valued at USD 95.3 million in 2025.
The market size for the demand for carrier infrastructure in telecom applications in USA is projected to reach USD 223.6 million by 2035.
The demand for carrier infrastructure in telecom applications in USA is expected to grow at a 8.9% CAGR between 2025 and 2035.
The key product types in demand for carrier infrastructure in telecom applications in USA are 5g, 2g, 3g and 4g/lte.
In terms of end user, telecom operators segment to command 54.9% share in the demand for carrier infrastructure in telecom applications in USA in 2025.


Our Research Products

The "Full Research Suite" delivers actionable market intel, deep dives on markets or technologies, so clients act faster, cut risk, and unlock growth.

The Leaderboard benchmarks and ranks top vendors, classifying them as Established Leaders, Leading Challengers, or Disruptors & Challengers.

Locates where complements amplify value and substitutes erode it, forecasting net impact by horizon

We deliver granular, decision-grade intel: market sizing, 5-year forecasts, pricing, adoption, usage, revenue, and operational KPIs—plus competitor tracking, regulation, and value chains—across 60 countries broadly.

Spot the shifts before they hit your P&L. We track inflection points, adoption curves, pricing moves, and ecosystem plays to show where demand is heading, why it is changing, and what to do next across high-growth markets and disruptive tech

Real-time reads of user behavior. We track shifting priorities, perceptions of today’s and next-gen services, and provider experience, then pace how fast tech moves from trial to adoption, blending buyer, consumer, and channel inputs with social signals (#WhySwitch, #UX).

Partner with our analyst team to build a custom report designed around your business priorities. From analysing market trends to assessing competitors or crafting bespoke datasets, we tailor insights to your needs.
Supplier Intelligence
Discovery & Profiling
Capacity & Footprint
Performance & Risk
Compliance & Governance
Commercial Readiness
Who Supplies Whom
Scorecards & Shortlists
Playbooks & Docs
Category Intelligence
Definition & Scope
Demand & Use Cases
Cost Drivers
Market Structure
Supply Chain Map
Trade & Policy
Operating Norms
Deliverables
Buyer Intelligence
Account Basics
Spend & Scope
Procurement Model
Vendor Requirements
Terms & Policies
Entry Strategy
Pain Points & Triggers
Outputs
Pricing Analysis
Benchmarks
Trends
Should-Cost
Indexation
Landed Cost
Commercial Terms
Deliverables
Brand Analysis
Positioning & Value Prop
Share & Presence
Customer Evidence
Go-to-Market
Digital & Reputation
Compliance & Trust
KPIs & Gaps
Outputs
Full Research Suite comprises of:
Market outlook & trends analysis
Interviews & case studies
Strategic recommendations
Vendor profiles & capabilities analysis
5-year forecasts
8 regions and 60+ country-level data splits
Market segment data splits
12 months of continuous data updates
DELIVERED AS:
PDF EXCEL ONLINE
Carrier Screening Market Size and Share Forecast Outlook 2025 to 2035
Carrier Wi-Fi Equipment Market Size and Share Forecast Outlook 2025 to 2035
Carrier Infrastructure in Telecom Applications Market - Forecast 2025 to 2035
Cup Carriers Market Size, Share & Trends 2025 to 2035
Pet Carriers Market Analysis - Trends, Growth & Forecast 2025 to 2035
Market Share Breakdown of Cup Carrier Packaging Suppliers
Multicarrier Parcel Management Solutions Software Market Size and Share Forecast Outlook 2025 to 2035
Bird Carriers Market Size and Share Forecast Outlook 2025 to 2035
Baby Carriers Market
Drink Carrier Poly Bags Market Size and Share Forecast Outlook 2025 to 2035
Leading Providers & Market Share in Drink Carrier Poly Bags
Cable Carrier Market
Bottle Carrier Market Trends – Growth & Forecast 2024-2034
Flavour Carriers Market Trends – Growth & Industry Forecast 2025-2035
Beverage Carrier Market Size and Share Forecast Outlook 2025 to 2035
Multi-pack Carriers Market Size and Share Forecast Outlook 2025 to 2035
Market Share Distribution Among Multi-Pack Carriers Suppliers
Demand for Carrier Infrastructure in Telecom Applications in Japan Size and Share Forecast Outlook 2025 to 2035
Solid Phase Carrier Resin for Peptide Drug Synthesis Market Size and Share Forecast Outlook 2025 to 2035
Wine Bottle Carrier Market Trends & Forecast 2024-2034

Thank you!
You will receive an email from our Business Development Manager. Please be sure to check your SPAM/JUNK folder too.
Chat With
MaRIA