The USA insurtech demand is valued at USD 9.3 billion in 2025 and is estimated to reach USD 84.9 billion by 2035, recording a CAGR of 24.8%. Demand is driven by rapid digitalisation across insurance distribution, underwriting, and claims management. Insurtech platforms support automation of policy issuance, data-driven risk assessment, telehealth-linked servicing, and customer onboarding across digital-first channels. Growth is reinforced by increasing adoption of AI-enabled analytics, remote identity verification, and cloud-based policy administration systems designed to improve efficiency and reduce operational costs for insurers.
Health insurance represents the leading insurance type due to strong growth in digital enrolment, remote benefits management, and demand for continuous risk monitoring. Digital platforms in this segment provide structured workflows for claims processing, eligibility checks, and documentation verification. Integration of health data sources, remote diagnostics, and predictive analytics continues to influence product design and service delivery.

Demand is strongest in the West, South, and Northeast, where large insurers, technology providers, and employer networks drive digital adoption. Key suppliers include Entrust, Onfido, IDEMIA, Transmit Security, and Secret Double Octopus. Their focus is on secure identity frameworks, workflow automation, and integration capabilities that support digital underwriting and claims-processing functions.
The 10-year growth comparison shows a pronounced shift from rapid early expansion to more structured, platform-driven maturity. Between 2025 and 2030, growth will be strongest as insurers adopt digital underwriting tools, automated claims systems, and data-driven risk models. Early gains will be reinforced by increased use of API-based distribution, embedded insurance within digital commerce platforms, and broader integration of telematics, behavioral analytics, and remote-inspection technologies across property, health, and auto segments.
From 2030 to 2035, growth remains high but becomes more predictable as large carriers standardize digital workflows and insurtech platforms mature. Expansion during this period is driven by lifecycle upgrades, regulatory alignment for digital policies, and widespread use of AI-supported risk scoring. While the pace moderates compared with the early years, adoption deepens across complex lines such as commercial, specialty, and cyber coverage. The decade-long comparison shows a transition from innovation-led acceleration to sustained enterprise-scale modernization, supported by operational efficiency needs, improved data infrastructure, and long-term digital-transformation strategies in the USA insurance industry.
| Metric | Value |
|---|---|
| USA Insurtech Sales Value (2025) | USD 9.3 billion |
| USA Insurtech Forecast Value (2035) | USD 84.9 billion |
| USA Insurtech Forecast CAGR (2025 to 2035) | 24.8% |
Demand for insurtech in the USA is expanding as insurers and consumers seek faster, digital and more personalised insurance services. Technology platforms for underwriting, claims automation, usage-based insurance, data-driven risk assessment and real-time customer engagement support increased efficiency and consumer convenience. Rising consumer expectations, competition from tech-savvy entrants and increased mobile adoption drive insurers to invest in innovative solutions.
Growth is further supported by regulatory encouragement of digital innovation, increased data availability and open-API ecosystems that enable partnership models between traditional insurers and technology firms. Constraints to growth include regulatory complexity across states, legacy system integration challenges within incumbent insurers and concerns over data privacy and cybersecurity risk. Smaller insurers may lack resources to adopt advanced technologies which may slow industry penetration.
Demand for insurtech solutions in the United States is shaped by digital transformation priorities across insurers, intermediaries, and technology providers. Distribution across insurance type, end users, and technology categories reflects adoption of digital onboarding, automation, analytics-driven underwriting, and platform-based customer interaction. These patterns illustrate how insurers and service partners deploy technology to reduce processing errors, streamline claims, and expand digital service delivery.

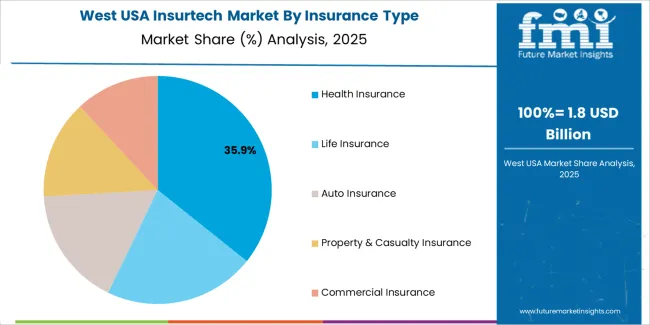
Health insurance holds 35.5% and represents the leading category. Adoption of digital claims processing, automated eligibility checks, virtual health integrations, and mobile-first policy management supports this share. Life insurance represents 21.5%, reflecting increased use of automated underwriting and identity verification tools. Auto insurance accounts for 17.0%, linked to telematics-driven pricing, digital claims imaging, and automated appraisal workflows. Property and casualty insurance holds 14.0%, supported by digital policy management and risk-assessment tools. Commercial insurance represents 12.0%, reflecting gradual integration of digital platforms for underwriting and claims handling in business-focused portfolios.
Key drivers and attributes:

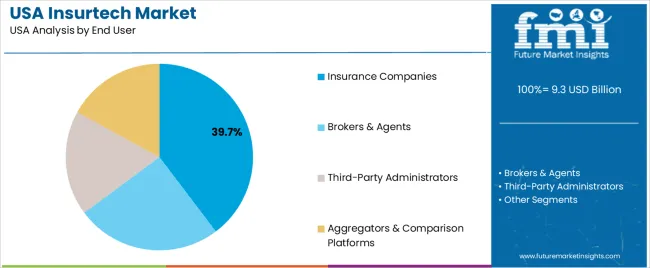
Insurance companies hold 39.7% of USA insurtech demand, reflecting strong investment in digital platforms that improve risk assessment, claims processing, and customer engagement. Internal modernisation strategies drive adoption of AI systems, low-code platforms, and automated decision engines. Brokers and agents represent 25.1%, using digital quoting, CRM tools, and automated comparison systems to support client acquisition. Third-party administrators account for 18.2%, supported by workflow automation, digital claims handling, and document-management tools. Aggregators and comparison platforms hold 17.0%, relying on API-based integrations to deliver real-time quotes and policy comparisons.
Key drivers and attributes:

Artificial intelligence holds an estimated 32.0% share. AI supports predictive modelling, customer verification, claims automation, and fraud detection across insurance segments. Machine learning and data analytics account for 27.0%, reflecting widespread use of risk scoring and premium modelling. Cloud computing holds 21.0%, enabling hosted underwriting systems, API-based integration, and scalable claims platforms. Internet of Things (IoT) represents 12.0%, used in telematics, property sensors, and workplace safety monitoring. Blockchain and smart contracts hold 8.0%, serving niche applications in policy validation and secure data exchange. Technology distribution reflects the varying maturity of digital infrastructure across insurers.
Key drivers and attributes:
Increased digitalisation of insurance operations, rising consumer expectations for seamless experiences, and need for cost efficiency are driving demand.
In the United States, demand for insurtech solutions is growing as insurers seek to modernise legacy systems, accelerate digital transformation and respond to changing consumer behaviours. Customers expect fast, user-friendly interactions for quotes, claims, policy adjustments and renewals, which drives deployment of digital platforms, mobile apps, AI chatbots and embedded insurance interfaces. Insurers also face pressure to reduce operational costs, improve underwriting accuracy and enhance risk selection. Insurtech companies providing data analytics, telematics, IoT-driven risk monitoring and automation of claims processing are gaining traction across personal lines, commercial insurance and niche segments. The growth of digital distribution models and direct-to-consumer insurers further supports insurtech adoption.
Regulatory complexity, legacy ecosystem inertia and cybersecurity risks restrain adoption.
Insurance regulation in the USA varies by state, which complicates deployment of new technologies and requires significant compliance investment. Many insurers operate on outdated IT infrastructure and deeply embedded process models, which slows the ability to integrate insurtech solutions or replace legacy systems. The handling of large volumes of personal and risk data introduces cybersecurity and data-privacy obligations, which raise cost and may deter small providers from rapid adoption. Uncertainty about ROI from investments in new platforms also makes some incumbents cautious.
Rise of embedded insurance models, increased use of AI and analytics across underwriting and claims, and expanding partnerships between insurers and tech firms define industry trends.
Insurtech adoption in the USA is shifting toward embedded insurance offerings where coverage is integrated into platforms outside traditional insurance channels, such as mobility services, e-commerce check-out flows and connected devices. AI and predictive analytics are being used to improve risk-scoring, personalise coverage and accelerate claims settlement, improving customer satisfaction. Major insurers increasingly form partnerships with insurtech firms and startups to pilot new business models, reduce time-to- industry and harness agile innovation. These trends are positioning insurtech as a key growth driver in the evolving U.S. insurance landscape.
Demand for insurtech in the United States is expanding rapidly through 2035 as insurers, brokers, and digital-service providers adopt technology-driven solutions for underwriting, claims handling, customer onboarding, and risk analytics. Growth is reinforced by rising operational automation, increased use of API-driven platforms, and broader integration of artificial intelligence across policy management systems. Insurtech applications support digital policy distribution, fraud detection, telematics-based pricing, and automated claims verification. Regional differences reflect technology-sector concentration, startup activity, insurance-carrier density, and digital-adoption levels within commercial and personal insurance industries. The West leads with a 28.5% CAGR, followed by the South (25.5%), the Northeast (22.8%), and the Midwest (19.8%).

| Region | CAGR (2025-2035) |
|---|---|
| West | 28.5% |
| South | 25.5% |
| Northeast | 22.8% |
| Midwest | 19.8% |

The West grows at 28.5% CAGR, supported by strong technology-sector activity, extensive startup ecosystems, and broad adoption of digital insurance platforms across personal and commercial industries. California, Washington, and Colorado host insurtech firms developing automated underwriting systems, AI-based claims tools, and digital distribution platforms. Regional carriers integrate telematics, remote-verification tools, and risk-scoring algorithms to enhance accuracy in pricing and fraud detection. Venture-capital activity supports continuous development of cloud-native insurance software and embedded-insurance technologies. High demand from technology companies, gig-economy platforms, and online marketplaces reinforces sustained adoption of digital insurance tools.

The South grows at 25.5% CAGR, supported by strong insurance-carrier presence, expanding fintech clusters, and broad adoption of digital underwriting and claims platforms. Texas, Florida, Georgia, and North Carolina maintain large insurance operations that integrate automation, customer-self-service platforms, and predictive-risk analytics. Carriers rely on digital distribution tools for sales, policy servicing, and compliance workflows. Growing metropolitan populations increase demand for automated policy onboarding, particularly in property, auto, and health segments. Regional fintech ecosystems continue to adopt API-based insurance connectors that streamline policy sales across digital marketplaces.

The Northeast grows at 22.8% CAGR, supported by dense financial hubs, established insurance groups, and strong adoption of compliance-driven digital tools. States such as New York, Massachusetts, New Jersey, and Pennsylvania rely on insurtech systems for regulatory documentation, real-time risk assessment, identity verification, and digital customer support. Carriers integrate advanced analytics for policy pricing and automated workflow software to manage claims and underwriting tasks. Consulting firms in the region use insurtech platforms to support actuarial analysis and insurance-process optimization. High commercial-insurance activity reinforces consistent demand for digital modernization across large enterprise clients.
The Midwest grows at 19.8% CAGR, supported by regional insurance carriers, established financial-services networks, and increasing digital transformation across corporate environments. States such as Illinois, Ohio, Michigan, and Wisconsin adopt insurtech platforms for customer onboarding, fraud detection, policy-servicing automation, and agent-workflow management. Regional insurers integrate AI-supported claims systems and telematics-based pricing models. Midwestern financial institutions rely on digital-compliance tools and automated verification modules to manage regulatory requirements. Growth remains steady due to modernization initiatives across traditional insurance industries and rising demand for digital capabilities.

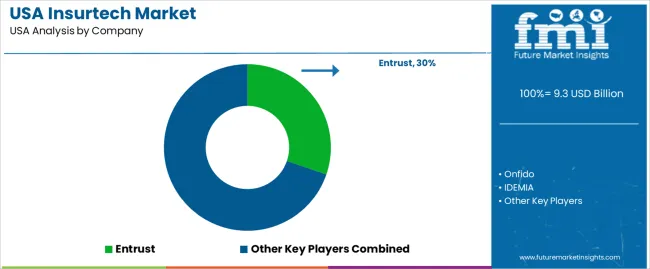
Demand for insurtech solutions in the USA is shaped by a concentrated group of digital-identity and authentication providers that support underwriting, claims automation, policy onboarding, and fraud-mitigation processes. Entrust holds the leading position with an estimated 30.3% share, supported by established credential-management systems, strong cryptographic infrastructure, and long-term integration with insurers requiring high-assurance identity validation. Its position is reinforced by consistent performance across digital policy issuance, secure document handling, and multi-factor authentication frameworks.
Onfido and IDEMIA follow as major participants, supplying identity-proofing, biometric verification, and document-analysis tools widely used in digital onboarding and claim-authorization workflows. Their strengths include scalable machine-learning models, verified document-authenticity checks, and alignment with fraud-control requirements for U.S. insurers. Transmit Security maintains a notable presence through passwordless authentication and orchestration platforms designed to streamline customer sign-in, reduce friction, and improve retention during digital policy interactions.
Secret Double Octopus contributes additional capability through enterprise-grade multi-factor and credential-resilience solutions that support insurers seeking to reduce identity-related fraud and strengthen access control across distributed teams. Competition across this segment centers on fraud-detection accuracy, biometric reliability, integration flexibility, regulatory alignment, and consistency of customer-verification performance. Demand is expanding as insurers continue to digitize policy issuance and claims management, adopt automated identity controls, and invest in secure, low-friction authentication and verification systems that improve operational efficiency and reduce exposure to identity-driven losses.
| Items | Values |
|---|---|
| Quantitative Units | USD billion |
| Insurance Type | Health Insurance, Life Insurance, Auto Insurance, Property & Casualty Insurance, Commercial Insurance |
| End User | Insurance Companies, Brokers & Agents, Third-Party Administrators, Aggregators & Comparison Platforms |
| Technology | Artificial Intelligence, Machine Learning & Data Analytics, Blockchain & Smart Contracts, Internet of Things, Cloud Computing |
| Regions Covered | West, Midwest, South, Northeast |
| Key Companies Profiled | Entrust, Onfido, IDEMIA, Transmit Security, Secret Double Octopus |
| Additional Attributes | Dollar sales by insurance type, end user, and technology categories; regional adoption trends across West, Midwest, South, and Northeast; competitive landscape of insurtech solution providers; advancements in underwriting automation, digital claims processing, behavioral analytics, IoT-enabled risk monitoring, and blockchain-based policy administration; integration with insurers, brokers, TPAs, and comparison platforms in the USA. |
The global demand for insurtech in USA is estimated to be valued at USD 9.3 billion in 2025.
The market size for the demand for insurtech in USA is projected to reach USD 84.9 billion by 2035.
The demand for insurtech in USA is expected to grow at a 24.8% CAGR between 2025 and 2035.
The key product types in demand for insurtech in USA are health insurance, life insurance, auto insurance, property & casualty insurance and commercial insurance.
In terms of end user, insurance companies segment to command 39.7% share in the demand for insurtech in USA in 2025.


Our Research Products

The "Full Research Suite" delivers actionable market intel, deep dives on markets or technologies, so clients act faster, cut risk, and unlock growth.

The Leaderboard benchmarks and ranks top vendors, classifying them as Established Leaders, Leading Challengers, or Disruptors & Challengers.

Locates where complements amplify value and substitutes erode it, forecasting net impact by horizon

We deliver granular, decision-grade intel: market sizing, 5-year forecasts, pricing, adoption, usage, revenue, and operational KPIs—plus competitor tracking, regulation, and value chains—across 60 countries broadly.

Spot the shifts before they hit your P&L. We track inflection points, adoption curves, pricing moves, and ecosystem plays to show where demand is heading, why it is changing, and what to do next across high-growth markets and disruptive tech

Real-time reads of user behavior. We track shifting priorities, perceptions of today’s and next-gen services, and provider experience, then pace how fast tech moves from trial to adoption, blending buyer, consumer, and channel inputs with social signals (#WhySwitch, #UX).

Partner with our analyst team to build a custom report designed around your business priorities. From analysing market trends to assessing competitors or crafting bespoke datasets, we tailor insights to your needs.
Supplier Intelligence
Discovery & Profiling
Capacity & Footprint
Performance & Risk
Compliance & Governance
Commercial Readiness
Who Supplies Whom
Scorecards & Shortlists
Playbooks & Docs
Category Intelligence
Definition & Scope
Demand & Use Cases
Cost Drivers
Market Structure
Supply Chain Map
Trade & Policy
Operating Norms
Deliverables
Buyer Intelligence
Account Basics
Spend & Scope
Procurement Model
Vendor Requirements
Terms & Policies
Entry Strategy
Pain Points & Triggers
Outputs
Pricing Analysis
Benchmarks
Trends
Should-Cost
Indexation
Landed Cost
Commercial Terms
Deliverables
Brand Analysis
Positioning & Value Prop
Share & Presence
Customer Evidence
Go-to-Market
Digital & Reputation
Compliance & Trust
KPIs & Gaps
Outputs
Full Research Suite comprises of:
Market outlook & trends analysis
Interviews & case studies
Strategic recommendations
Vendor profiles & capabilities analysis
5-year forecasts
8 regions and 60+ country-level data splits
Market segment data splits
12 months of continuous data updates
DELIVERED AS:
PDF EXCEL ONLINE
Insurtech Market Analysis by Component, by Deployment and by Industry Through 2035
Demand for Insurtech in Japan Size and Share Forecast Outlook 2025 to 2035
Real Estate InsurTech Market Growth - Trends & Forecast 2025 to 2035
USA Medical Coding Market Size and Share Forecast Outlook 2025 to 2035
USA Labels Market Size and Share Forecast Outlook 2025 to 2035
USA Plant-based Creamers Market Size and Share Forecast Outlook 2025 to 2035
USA Barrier Coated Paper Market Size and Share Forecast Outlook 2025 to 2035
USA Electronic Health Records (EHR) Market Size and Share Forecast Outlook 2025 to 2035
USA Animal Model Market Size and Share Forecast Outlook 2025 to 2035
USA and Canada Packer Bottle Market Size and Share Forecast Outlook 2025 to 2035
USA Stretch Hood Films Market Size and Share Forecast Outlook 2025 to 2035
USA and Canada Fence Screen Market Size and Share Forecast Outlook 2025 to 2035
USA Lubricant Contaminated HDPE Container Waste Market Size and Share Forecast Outlook 2025 to 2035
USA Commercial Walk-In Refrigeration Market Size and Share Forecast Outlook 2025 to 2035
USA & Canada Pre-painted Steel Roofing and Cladding Market Size and Share Forecast Outlook 2025 to 2035
USA Residential Cotton Candy Maker Market Size and Share Forecast Outlook 2025 to 2035
USA Faith Based Tourism Market Size and Share Forecast Outlook 2025 to 2035
United States NFC Lemon Juice Market Analysis - Size, Growth and Forecast 2025 to 2035
USA and Canada Copper Market Insights - Demand, Size & Industry Trends 2025 to 2035
USA Ground and Precipitated Calcium Carbonate Market Growth by Product Type, Application, End-Use, and Region in 2025 to 2035

Thank you!
You will receive an email from our Business Development Manager. Please be sure to check your SPAM/JUNK folder too.
Chat With
MaRIA