United States Compounding Pharmacy - Size, Share, and Forecast Outlook 2025 to 2035

Revenue from compounding pharmacies in the USA is estimated at USD 5.6 billion in 2025, with projections indicating a rise to USD 11.8 billion by 2035, reflecting a CAGR of 7.8% over the forecast period.
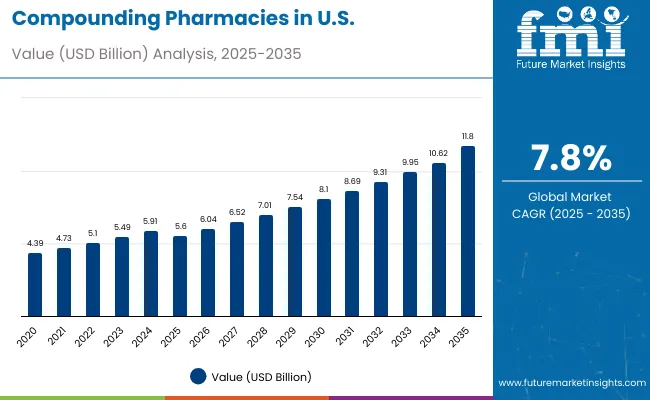
Quick Stats for Compounding Pharmacies in the USA

  • Value of Compounding Pharmacies in the USA (2025): USD 5.6 billion
  • Projected Value of Compounding Pharmacies in the USA (2035): USD 11.8 billion
  • Forecast CAGR of Compounding Pharmacies in the USA (2025 to 2035): 7.8%
  • Leading Segment by Application in the USA Compounding Pharmacies (2025): Adults (45% share)
  • Top Key Players in the USA Compounding Pharmacy Revenue:Avella Specialty Pharmacy, Central Admixture Pharmacy Services Inc, Hoye's Pharmacy, Vertisis Custom Pharmacy, Smith Caldwell Drug Store, Sixth Avenue Medical Pharmacy, Cantrell Drug Company, Clinigen Group, Dougherty's Pharmacy, Fagron N.V.

Demand For Compounding Pharmacies In Usa

Metric Value
Estimated Size (2025E) USD 5.6 billion
Projected Value (2035F) USD 11.8 billion
CAGR (2025 to 2035) 7.8%

This growth is driven by increasing demand for personalized medications, rising prevalence of chronic diseases, growing geriatric population requiring customized treatments, and expanding drug shortages necessitating alternative formulations. Per capita demand is expected to increase as healthcare providers adopt individualized pharmaceutical solutions that offer precise dosing, allergy-free formulations, and specialized delivery methods.

Oral medication products are poised to remain the leading product segment with a 33% share in 2025, owing to patient preference for familiar administration routes, ease of compliance, and versatility in customization options, including strength modifications and allergen removal. Alternative formulations, including injectables, topical preparations, and specialized delivery systems, serve specific therapeutic applications where oral administration is not suitable or optimal.

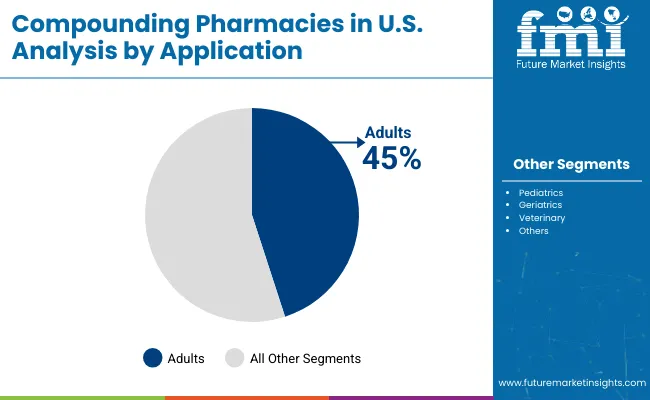
By application, adults will continue to drive the highest demand, with a 45% share in 2025, supported by the largest patient population requiring customized medications, prevalence of chronic conditions necessitating personalized treatments, and increasing awareness among healthcare providers about tailored pharmaceutical solutions. Pediatric and geriatric segments also show robust growth potential, driven by unique dosing requirements and specialized formulation needs that commercial medications cannot adequately address.

Consumer adoption is concentrated among patients with drug allergies, those requiring non-commercial dosage strengths, and individuals with complex medical conditions needing combination therapies. Expansion is further supported by increased availability of sterile compounding capabilities and FDA-compliant facilities. Innovation in automation technology, regulatory compliance, and strategic partnerships between compounding pharmacies and healthcare institutions are expected to accelerate adoption.

Segmental Analysis

The USA compounding pharmacy sector is segmented based on product type, pharmacy type, application, and therapeutic area. By product,it includes oral medications (solid, liquid and topical), injectables, topical preparations, nasal formulations, ocular preparations, otic formulations, suppositories, and mouthwashes. Based on pharmacy type, it is segmented into 503A pharmacies and 503B outsourcing facilities. In terms of applications, it is divide into adults, pediatrics, geriatrics, and veterinary use, while therapeutic areas include hormone replacement therapy, pain management, dermatology, oncology, hematology, dental, and others.
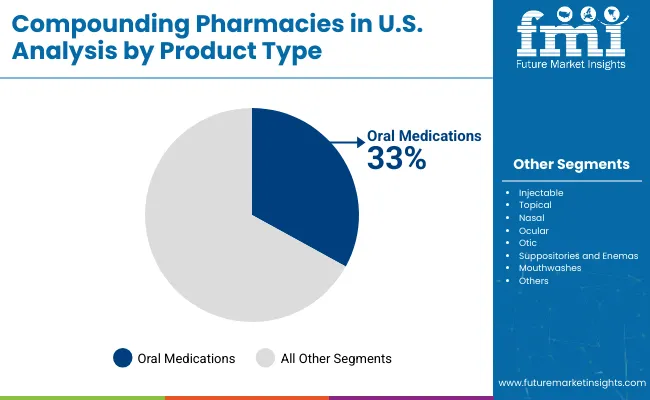
By Product, Oral Medications Account for 33% of the Share

Demand For Compounding Pharmacies In Usa By Product Type

Oral medication formulations are projected to dominate with a 33% value share in 2025, driven by patient familiarity with oral administration routes, healthcare provider comfort with prescribing customized oral preparations, and versatility in addressing diverse therapeutic needs through strength modifications, combination formulations, and allergen-free alternatives.
  • Oral medications are expected to hold a 33% value share in 2025, supported by their widespread acceptance among patients and providers, ability to customize dosages precisely, elimination of problematic excipients or allergens, and cost-effectiveness compared to alternative delivery methods.
  • Injectable and topical formulations continue to serve specialized applications, particularly where oral administration is contraindicated, rapid onset is required, or localized treatment is preferred over systemic exposure.
  • The preference for oral formulations is reinforced by regulatory familiarity among 503A pharmacies, established quality control procedures, and suitability for chronic condition management, where patient compliance and convenience are paramount considerations.

By Application, Adults Account for 45% of the Share

Demand For Compounding Pharmacies In Usa By Application

Adult applications are projected to account for the largest share at 45% in 2025, driven by the largest patient demographic requiring personalized medications, the highest prevalence of chronic conditions necessitating customized treatments, and the greatest healthcare utilization rates among working-age and older adult populations.

  • Adult applications are expected to hold a 45% value share in 2025, supported by complex medication regimens requiring customization, high incidence of drug allergies and intolerances in adult populations, and established reimbursement pathways for medically necessary compounded preparations.
  • Pediatric applications represent a significant growth segment as children frequently require weight-based dosing, palatable formulations, and strengths not commercially available. In contrast, geriatric applications benefit from simplified dosing regimens and combination therapies.
  • Adult applications remain preferred due to established prescribing patterns, broad insurance coverage for medically necessary compounds, and provider experience with customized adult formulations across therapeutic areas.

Consumer Profile Analysis: Healthcare-Driven and Medically-Necessary Consumer Base Drives Growth

The compounding pharmacy category in the USA attracts patients with specific medical needs that cannot be met through commercially manufactured medications, including those with allergies to standard drug components, unique dosing requirements, or discontinued medication needs. While motivations range from allergy management to precise pediatric dosing to combination therapy requirements, demand is concentrated among several key patient segments. Each segment demonstrates distinct utilization behaviors, formulation preferences, and prescription considerations.

Patients referred by healthcare providers represent the largest consumer base, requiring medications unavailable commercially due to dosage variations, ingredient modifications, or discontinued products. These patients actively work with physicians and pharmacists to develop customized formulations that address specific medical conditions while avoiding problematic ingredients or delivery methods.

Chronic disease patients and specialty care recipients show consistent demand for reliable, effective formulations that provide therapeutic benefits not achievable through standard medications. Their utilization decisions are influenced by physician recommendations, insurance coverage considerations, and proven efficacy in managing complex medical conditions requiring personalized treatment approaches.

Pediatric and geriatric patients increasingly rely on compounded medications to address age-specific dosing needs, swallowing difficulties, and medication adherence challenges. Their adoption is driven by caregiver preferences, physician expertise in customized formulations, and improved therapeutic outcomes through personalized medication management.

Veterinary patients and pet owners, representing a growing segment, adopt compounded medications that provide species-specific formulations, palatable flavoring options, and dosing forms suitable for animal administration. These consumers often prioritize effectiveness, safety, and ease of administration for their animals' health conditions.

Collectively, these segments drive demand for compounding pharmacy services in the USA, with utilization patterns shaped by medical necessity, physician recommendations, insurance coverage, and therapeutic outcome requirements.
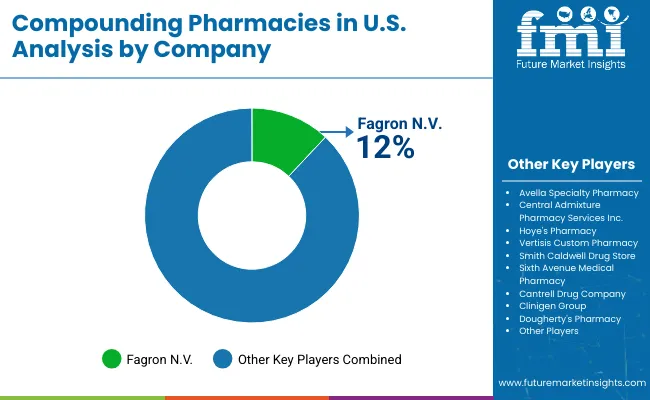
Notable Players and Strategies in USA Compounding Pharmacies

Demand For Compounding Pharmacies In Usa By Company

The competitive environment in the USA compounding pharmacy sector is characterized by a mix of established 503A traditional pharmacies and larger-scale 503B outsourcing facilities. Innovation in sterile compounding capabilities, regulatory compliance, and specialized therapeutic formulations, rather than conventional pharmacy operations alone, remains the decisive success factor: the top providers collectively serve thousands of healthcare facilities and individual patients across all 50 states and account for the majority of customized medication production.

Fagron N.V. is among the most prominent players with an estimated 12% share, leveraging its 503B outsourcing facility status and nationwide distribution network. The company focuses on sterile compounding capabilities, FDA compliance, and strategic positioning to capture both hospital systems and individual healthcare providers seeking reliable, customized medication solutions.

Avella Specialty Pharmacy and Clinigen Group provide comprehensive compounding services with strong quality positioning and specialized therapeutic focus. Their strategies emphasize sterile preparation capabilities, clinical expertise, and targeted expansion into hospital and clinic channels through advanced compounding technology and regulatory compliance.

Central Admixture Pharmacy Services Inc (CAPS) leverages its sterile compounding expertise alongside targeted services to healthcare institutions, focusing on IV admixtures, specialized formulations, and strategic partnerships with hospitals and surgical centers requiring reliable compounded medication supply.

The next tier includes Vertisis Custom Pharmacy, Hoye's Pharmacy, Smith Caldwell Drug Store, Sixth Avenue Medical Pharmacy, Cantrell Drug Company, and Dougherty's Pharmacy. These companies focus on specialized formulations, regional presence, and diverse patient segments, often offering traditional 503A services, specialized therapeutic area expertise, or unique formulation capabilities.

Innovation and strategic partnerships are expected to continue, as expertise in sterile compounding, regulatory compliance, and specialized therapeutic formulations becomes increasingly critical for sustaining healthcare provider trust and expanding presence across hospital, clinic, and retail pharmacy sectors in the USA.

Scope of Report

Items Value
Quantitative Units (2025) USD 5.6 billion
Product Oral Medications (Solid, Liquid and Topical ), Injectable, Topical, Nasal, Ocular, Otic, Suppositories and Enemas, Mouthwashes
Pharmacy Type 503A Pharmacy, 503B Pharmacy
Application Adults, Pediatrics, Geriatrics, Veterinary
Therapeutic Area Hormone Replacement Therapy, Pain Management, Dermatology, Oncology, Hematology, Dental, Others
Regions Covered North America
Country Covered United States
Key Companies Profiled Avella Specialty Pharmacy, Central Admixture Pharmacy Services Inc, Hoye's Pharmacy, Vertisis Custom Pharmacy, Smith Caldwell Drug Store, Sixth Avenue Medical Pharmacy, Cantrell Drug Company, Clinigen Group, Dougherty's Pharmacy, Fagron N.V.
Additional Attributes Dollar sales by pharmacy type and formulation, regional demand trends, competitive landscape, adoption of sterile and non-sterile compounding, integration with specialty therapeutics, innovations in personalized medicine and automated compounding systems

Key Segments

By Product Type:

In terms of product type, the industry is segregated into oral medication [solid medication (capsules, tablets, mixtures, lollipops, and lozenges), liquid medication (syrup, solution/liquid, emulsion, and suspension), topical medication (gels, ointments, creams, and lotions)], injectable, mouthwashes, nasal, ocular, otic, suppositories and enemas.

By Pharmacy Type:

In terms of pharmacy type, the industry is segregated into 503A pharmacy, 503B pharmacy.

By Application:

In terms of application, the industry is segregated into adults, pediatrics, geriatrics and veterinary

By Therapeutic Type:

In terms of therapeutic type, the industry is segregated into hormone replacement therapy, pain management, dermatology, oncology, hematology, dental and others

Table of Content

  1. Executive Summary
    • USA Sales Outlook
    • Demand-side Trends
    • Supply-side Trends
    • Technology Roadmap Analysis
    • Analysis and Recommendations
  2. Sales Overview
    • Sales Coverage / Taxonomy
    • Sales Definition / Scope / Limitations
  3. Sales Background
    • Sales Dynamics
      • Drivers
      • Restraints
      • Opportunity
      • Trends
    • Scenario Forecast
      • Demand in Optimistic Scenario
      • Demand in Likely Scenario
      • Demand in Conservative Scenario
    • Opportunity Map Analysis
    • Product Life Cycle Analysis
    • Supply Chain Analysis
      • Supply Side Participants and their Roles
        • Producers
        • Mid-Level Participants (Traders/ Agents/ Brokers)
        • Wholesalers and Distributors
      • Value Added and Value Created at Node in the Supply Chain
      • List of Raw Material Suppliers
      • List of Existing and Potential Buyer’s
    • Investment Feasibility Matrix
    • Value Chain Analysis
      • Profit Margin Analysis
      • Wholesalers and Distributors
      • Retailers
    • PESTLE and Porter’s Analysis
    • Regulatory Landscape
      • By Key Regions
      • By Key Countries
    • Regional Parent Sales Outlook
    • Production and Consumption Statistics
    • Import and Export Statistics
  4. Sales Analysis 2020 to 2024 and Forecast, 2025 to 2035
    • Historical Sales Size Value (USD Billion) Analysis, 2020 to 2024
    • Current and Future Sales Size Value (USD Billion) Projections, 2025 to 2035
      • Y-o-Y Growth Trend Analysis
      • Absolute $ Opportunity Analysis
  5. Sales Pricing Analysis 2020 to 2024 and Forecast 2025 to 2035
  6. Sales Analysis 2020 to 2024 and Forecast 2025 to 2035, By Product
    • Introduction / Key Findings
    • Historical Sales Size Value (USD Billion) Analysis By Product, 2020 to 2024
    • Current and Future Sales Size Value (USD Billion) Analysis and Forecast By Product, 2025 to 2035
      • Oral Medication
        • Solid Medication
        • Liquid Medication
        • Topical Medication
      • Injectables
      • Mouthwashes
      • Nasal
      • Ocular
      • Otic
      • Suppositories and Enemas
    • Y-o-Y Growth Trend Analysis By Product , 2020 to 2024
    • Absolute $ Opportunity Analysis By Product , 2025 to 2035
  7. Sales Analysis 2020 to 2024 and Forecast 2025 to 2035, By Pharmacy Type
    • Introduction / Key Findings
    • Historical Sales Size Value (USD Billion) Analysis By Pharmacy Type, 2020 to 2024
    • Current and Future Sales Size Value (USD Billion) Analysis and Forecast By Pharmacy Type, 2025 to 2035
      • 503A Pharmacy
      • 503B Pharmacy
    • Y-o-Y Growth Trend Analysis By Pharmacy Type, 2020 to 2024
    • Absolute $ Opportunity Analysis By Pharmacy Type, 2025 to 2035
  8. Sales Analysis 2020 to 2024 and Forecast 2025 to 2035, By Application
    • Introduction / Key Findings
    • Historical Sales Size Value (USD Billion) Analysis By Application, 2020 to 2024
    • Current and Future Sales Size Value (USD Billion) Analysis and Forecast By Application, 2025 to 2035
      • Adults
      • Pediatrics
      • Geriatrics
      • Veterinary
    • Y-o-Y Growth Trend Analysis By Application, 2020 to 2024
    • Absolute $ Opportunity Analysis By Application, 2025 to 2035
  9. Sales Analysis 2020 to 2024 and Forecast 2025 to 2035, By Therapeutic Area
    • Introduction / Key Findings
    • Historical Sales Size Value (USD Billion) Analysis By Therapeutic Area, 2020 to 2024
    • Current and Future Sales Size Value (USD Billion) Analysis and Forecast By Therapeutic Area, 2025 to 2035
      • Hormone Replacement Therapy
      • Pain Management
      • Dermatology
      • Oncology
      • Hematology
      • Dental
      • Others
    • Y-o-Y Growth Trend Analysis By Therapeutic Area, 2020 to 2024
    • Absolute $ Opportunity Analysis By Therapeutic Area, 2025 to 2035
  10. Key Countries Compounding Pharmacies Analysis
    • USA
      • Pricing Analysis
      • Sales Share Analysis, 2024
        • By Product
        • By Pharmacy Type
        • By Application
        • By Therapeutic Area
  11. Sales Structure Analysis
    • Competition Dashboard
    • Competition Benchmarking
    • Sales Share Analysis of Top Players
      • By Regional
      • By Product
      • By Pharmacy Type
      • By Application
      • By Therapeutic Area
  12. Competition Analysis
    • Competition Deep Dive
      • Avella Specialty Pharmacy
        • Overview
        • Product Portfolio
        • Profitability by Sales Segments (Product/Age /Sales Channel/Region)
        • Sales Footprint
        • Strategy Overview
          • Salesing Strategy
          • Product Strategy
          • Channel Strategy
      • Central Admixture Pharmacy Service Inc
        • Overview
        • Product Portfolio
        • Profitability by Sales Segments (Product/Age /Sales Channel/Region)
        • Sales Footprint
        • Strategy Overview
          • Salesing Strategy
          • Product Strategy
          • Channel Strategy
      • Hoye's Pharmacy
        • Overview
        • Product Portfolio
        • Profitability by Sales Segments (Product/Age /Sales Channel/Region)
        • Sales Footprint
        • Strategy Overview
          • Salesing Strategy
          • Product Strategy
          • Channel Strategy
      • Vertisis Custom Pharmacy
        • Overview
        • Product Portfolio
        • Profitability by Sales Segments (Product/Age /Sales Channel/Region)
        • Sales Footprint
        • Strategy Overview
          • Salesing Strategy
          • Product Strategy
          • Channel Strategy
      • Smith Caldwell Drug Store
        • Overview
        • Product Portfolio
        • Profitability by Sales Segments (Product/Age /Sales Channel/Region)
        • Sales Footprint
        • Strategy Overview
          • Salesing Strategy
          • Product Strategy
          • Channel Strategy
      • Sixth Avenue Medical Pharmacy
        • Overview
        • Product Portfolio
        • Profitability by Sales Segments (Product/Age /Sales Channel/Region)
        • Sales Footprint
        • Strategy Overview
          • Salesing Strategy
          • Product Strategy
          • Channel Strategy
      • Cantrell Drug Company
        • Overview
        • Product Portfolio
        • Profitability by Sales Segments (Product/Age /Sales Channel/Region)
        • Sales Footprint
        • Strategy Overview
          • Salesing Strategy
          • Product Strategy
          • Channel Strategy
      • Clinigan Group, Doughtry's Pharmacy
        • Overview
        • Product Portfolio
        • Profitability by Sales Segments (Product/Age /Sales Channel/Region)
        • Sales Footprint
        • Strategy Overview
          • Salesing Strategy
          • Product Strategy
          • Channel Strategy
      • Fagron N.V.
        • Overview
        • Product Portfolio
        • Profitability by Sales Segments (Product/Age /Sales Channel/Region)
        • Sales Footprint
        • Strategy Overview
          • Salesing Strategy
          • Product Strategy
          • Channel Strategy
  13. Assumptions & Acronyms Used
  14. Research Methodology

List of Tables

  • Table 1: Sales Analysis of Value (USD Billion) Forecast by Region, 2020-2035
  • Table 2: Sales Analysis of Value (USD Billion) Forecast by Product, 2020-2035
  • Table 3: Sales Analysis of Value (USD Billion) Forecast by Pharmacy Type, 2020-2035
  • Table 4: Sales Analysis of Value (USD Billion) Forecast by Application, 2020-2035
  • Table 5: Sales Analysis of Value (USD Billion) Forecast by Therapeutic Area, 2020-2035

List of Figures

  • Figure 1: Sales Analysis of Pricing Analysis
  • Figure 2: Sales Analysis of Value (USD Billion) Forecast 2020–2035
  • Figure 3: Sales Analysis of Value Share and BPS Analysis by Product, 2025 and 2035
  • Figure 4: Sales Analysis of Value Share and BPS Analysis by Pharmacy Type, 2025 and 2035
  • Figure 5: Sales Analysis of Value Share and BPS Analysis by Application, 2025 and 2035
  • Figure 6: Sales Analysis of Value Share and BPS Analysis by Therapeutic Type, 2025 and 2035

Frequently Asked Questions

What is the projected value of compounding pharmacies in the USA by 2025?

In 2025, the total value of compounding pharmacies in the USA is expected to be USD 5.6 billion.

What is the outlook for compounding pharmacies in the USA by 2035?

By 2035, the value is projected to reach USD 11.8 billion, reflecting a CAGR of 7.8%.

Which product dominates the compounding pharmacy sector in the USA in 2025?

Oral medications will lead the product segment with a 33% share in 2025.

Which application is projected to lead in the USA?

Adults are anticipated to hold the highest share at 45% dominating the application segment in 2025.

Which companies are leading in the USA compounding pharmacies?

Major players include Fagron N.V., Avella Specialty Pharmacy, Clinigen Group, Central Admixture Pharmacy Services Inc (CAPS), and Vertisis Custom Pharmacy, among others, in the competitive landscape.

Explore Similar Insights

Future Market Insights

Demand for Compounding Pharmacies in USA

Chat With

MaRIA

Hi There, I am MaRIA, Your Market Research Intelligence Assistant. How may I help you?