VOC Minimization Packaging Market Size and Share Forecast Outlook 2025 to 2035

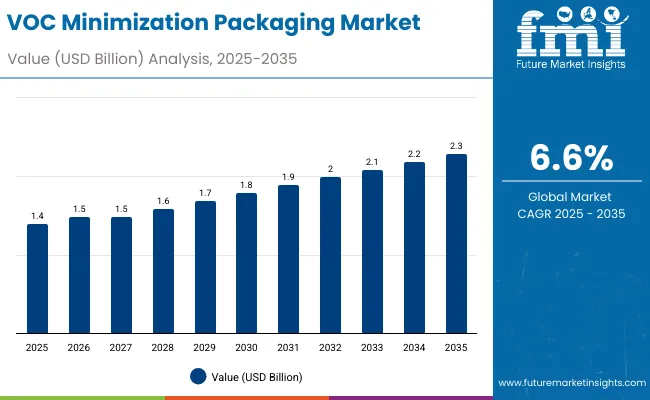
The VOC minimization packaging market will expand from USD 1.4 billion in 2025 to USD 2.7 billion by 2035, advancing at a CAGR of 6.6%. Growth is driven by regulatory pressure to reduce volatile organic compound (VOC) emissions and the increasing use of water-based and solvent-free materials. Solvent-free laminates lead adoption due to reduced environmental impact and superior adhesion.
Quick Stats for VOC Minimization Packaging Market

  • Market Value (2025): USD 1.4 billion
  • Market Forecast Value (2035): USD 2.7 billion
  • Market Forecast CAGR: 6.6%
  • Leading Technology in 2025: Solvent-Free Adhesive Lamination (42.1%)
  • Key Growth Regions: Asia-Pacific, led by South Korea at 7.1% CAGR
  • Top Companies: PacTec, Constantia Flexibles, Ecologic Brands, Ranpak, AptarGroup, Berlin Packaging, YashPakka, Vegware, EcoEnclose, TIPA

Voc Minimization Packaging Market

Metric Value
Industry Size (2025E) USD 1.4 billion
Industry Value (2035F) USD 2.7 billion
CAGR (2025 to 2035) 6.6%

Between 2025 and 2030, the market will add USD 0.5 billion from flexible packaging adoption. From 2030 to 2035, another USD 0.8 billion will be generated from eco-friendly inks and coatings. Asia-Pacific leads expansion, driven by green manufacturing policies and low-VOC technology investments.

From 2020 to 2024, VOC minimization packaging technologies gained traction amid global initiatives to reduce solvent emissions. Food and pharmaceutical packaging manufacturers replaced solvent-based coatings with water-based and UV-curable alternatives.

By 2035, the market will reach USD 2.7 billion, growing at 6.6% CAGR. Solvent-free adhesives and bio-based plastics will dominate the segment. Asia-Pacific will lead innovation through stricter emission laws, while North America and Europe will focus on recyclability and corporate carbon footprint reduction.

Why is the VOC Minimization Packaging Market Growing?

Growth is driven by sustainability goals, emission regulations, and the transition from solvent-based to low-VOC materials. Food, beverage, and healthcare packaging producers adopt water-based inks, solvent-free laminations, and recyclable coatings to meet regulatory standards.

Governments and brands aim for net-zero VOC emissions by 2030, reinforcing demand for sustainable packaging technologies. Adoption of eco-adhesives and low-VOC inks ensures reduced environmental footprint and improved occupational safety.

Segmental Analysis

The market is segmented by material, technology, packaging type, end-use industry, and region. Materials include solvent-free laminates, low-VOC polyethylene, PP, PET, coated paperboard, and bio-based plastics. Technologies include solvent-free lamination, water-based coatings, UV-curable coatings, plasma/corona treatments, and extrusion with VOC capture. Packaging types include flexible pouches, rigid containers, folding cartons, bottles, and wraps.
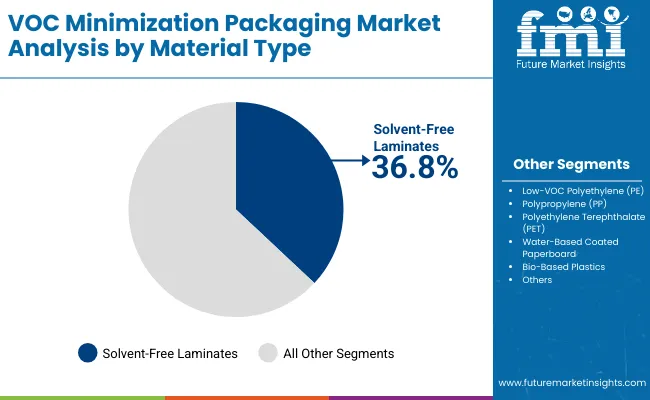
Solvent-Free Laminates Lead by Material

Voc Minimization Packaging Market By Material

Solvent-free laminates will hold 36.8% share in 2025, favored for sustainability, high bond strength, and food safety compliance. They are used extensively in flexible pouches and folding cartons.

Future demand will rise with improved solvent-free adhesive performance and biodegradable film compatibility.
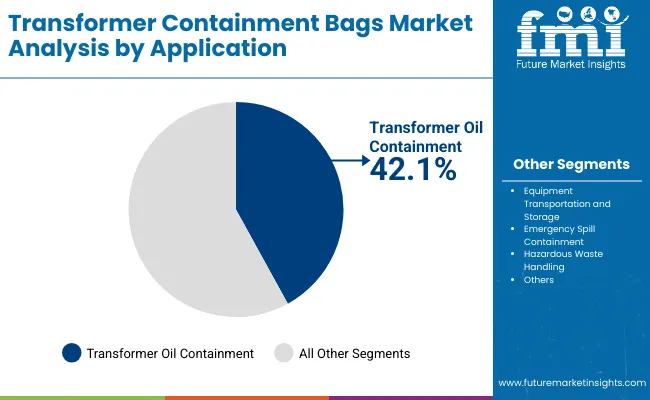
Solvent-Free Adhesive Lamination Dominates Technology

Voc Minimization Packaging Market By Application

This technology will account for 42.1% share in 2025, driven by high-speed lamination, VOC reduction, and consistent bonding strength. It supports food and pharmaceutical packaging where emission control is crucial.

By 2035, advanced resin chemistries and automation will further enhance solvent-free lamination adoption.
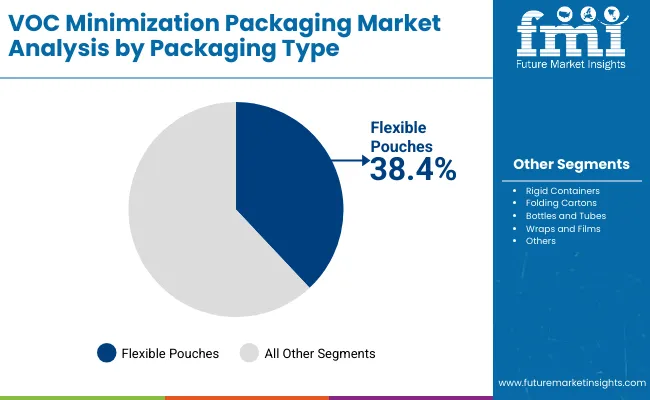
Flexible Pouches Dominate Packaging Type

Voc Minimization Packaging Market By Packaging

Flexible pouches will represent 38.4% share in 2025, supported by lightweight structure, minimal material waste, and adaptability to solvent-free adhesives.

By 2035, these will continue dominating due to recyclability improvements and the expansion of bio-based plastic films.
Food and Beverages Lead End Use

Voc Minimization Packaging Market By End Use

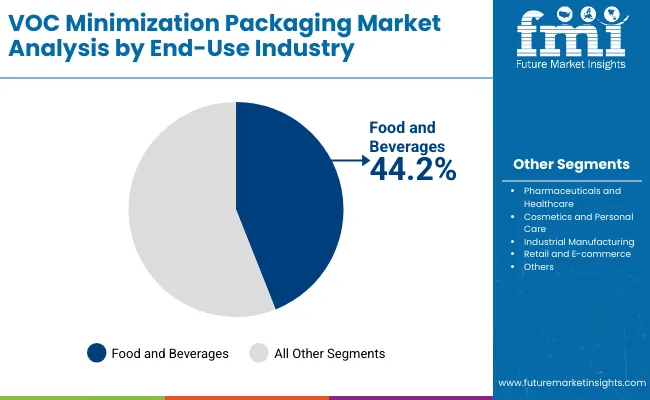
The food and beverages sector will hold 44.2% share in 2025, driven by regulatory requirements for safe, emission-free packaging.

Future growth will benefit from rapid development of eco-inks and laminates for processed and on-the-go products.

Drivers, Restraints, Opportunities, and Key Trends

Strict global emission regulations and rising demand for sustainable packaging drive adoption. Water-based coatings and UV-curable inks replace traditional solvent-based options.

High setup costs and slower curing speeds in water-based systems hinder adoption. Adhesion challenges with certain substrates also limit scalability.

Innovations in bio-based adhesives and hybrid coating technologies create new possibilities. Recyclable flexible packaging offers future potential in FMCG and healthcare.

Emerging trends include VOC capture systems, UV-curable digital printing, and hybrid adhesive chemistries. Digital automation ensures uniform coating and emission control.
Analysis of VOC Minimization Packaging Market by Key Countries

Voc Minimization Packaging Market By Country

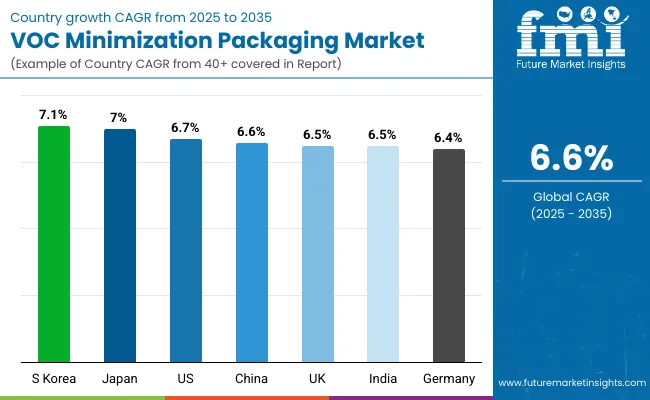
The global VOC minimization packaging market is growing rapidly as sustainability, emission control, and green packaging mandates reshape industry practices. Asia-Pacific leads in adoption, supported by large-scale eco-policy enforcement and rising FMCG production. Europe focuses on certified low-emission materials under strict environmental laws, while North America integrates VOC-free coatings across major food and personal care lines. Global investments in water-based adhesives, solvent-free laminates, and eco-compliant films are driving the shift toward next-generation sustainable packaging.
United States Sales Outlook

Voc Minimization Packaging Market Usa

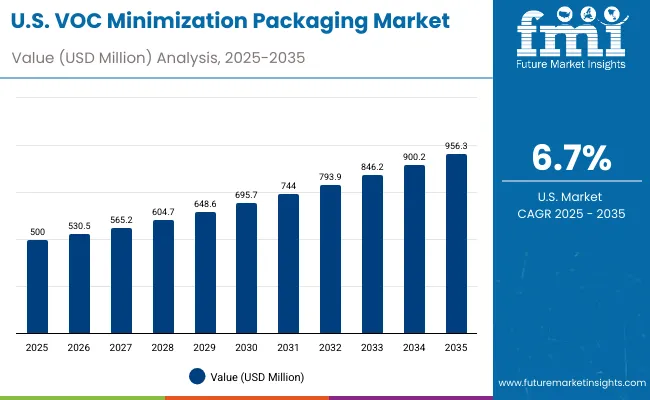
The USA market will grow at a CAGR of 6.7% from 2025 to 2035, driven by VOC-free solutions in food and personal care packaging. Green manufacturing initiatives are fueling adoption of solvent-free coatings and adhesives. FMCG players are replacing conventional laminations with water-based alternatives to meet EPA and sustainability standards. Continuous R&D in low-VOC materials ensures improved safety, compliance, and durability in packaging operations across sectors.
  • Green initiatives enhance adoption.
  • FMCG packaging boosts growth.
  • VOC-free laminations dominate upgrades.

Germany Growth Outlook

Voc Minimization Packaging Market Europe

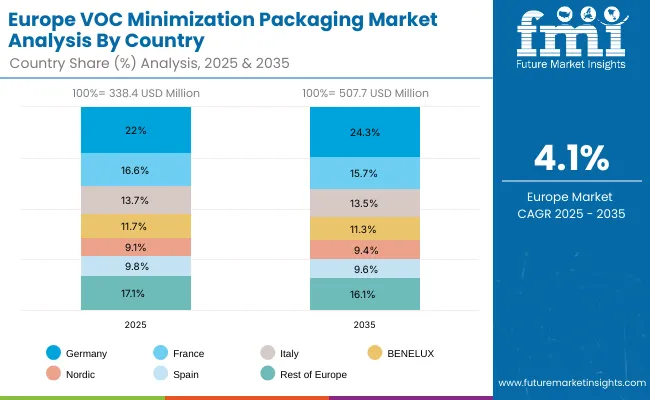
Germany will expand at a CAGR of 6.4%, underpinned by EU emission control regulations and sustainability commitments. Packaging manufacturers are transitioning to water-based and solvent-free adhesives aligned with circular economy goals. High investment in R&D for low-VOC coatings is boosting exports. The integration of smart quality systems ensures compliance with evolving EU directives, making Germany a leader in sustainable packaging material innovation.

  • EU packaging directives accelerate usage.
  • Sustainable coatings gain traction.
  • Adhesive innovation strengthens exports.

United Kingdom Expansion Outlook

The UK market will grow at a CAGR of 6.5%, driven by increased demand for recyclable and bio-based pouch packaging. Retailers and FMCG producers are shifting to VOC-free inks and laminates to meet environmental and retail compliance standards. The government’s packaging waste regulations are reinforcing the shift toward eco-certified products. Local converters are investing in greener coating technologies, positioning the UK as an innovator in recyclable flexible packaging.

  • Recyclable solutions gain preference.
  • Bio-based laminates expand.
  • Retail compliance reinforces growth.

China Sales Outlook

China will grow at a CAGR of 6.6%, supported by strong government-led eco-policy reforms and industrial modernization. Domestic manufacturers are scaling production of low-VOC films and adhesives to replace traditional solvent-based products. Rapid urbanization and e-commerce expansion are creating high demand for sustainable packaging across industries. The government’s push for green factories and emission-free packaging solutions is accelerating adoption nationwide.

  • Green manufacturing scales.
  • VOC-free adhesives dominate output.
  • Industrial packaging fuels demand.

India Growth Outlook

India will grow at a CAGR of 6.5%, propelled by policy-driven sustainability goals and growing FMCG demand. Packaging manufacturers are transitioning to water-based printing inks and solvent-free laminates to meet global compliance standards. Government reforms encouraging cleaner industrial practices are accelerating modernization. SMEs are also adopting low-VOC technologies to meet export requirements, reinforcing India’s position as a key green packaging hub.

  • FMCG packaging expands rapidly.
  • Water-based inks rise in use.
  • Policy reforms accelerate upgrades.

Japan Outlook

Japan will grow at a CAGR of 7.0%, led by increasing adoption of low-emission, recyclable packaging materials. Advanced technology integration supports VOC reduction and recyclability across high-end packaging applications. Manufacturers are introducing lightweight pouches with improved barrier and eco-properties. Japan’s continuous innovation in bio-based coatings and solvent-free adhesives ensures competitiveness in export-driven sectors like healthcare and electronics.

  • VOC control policies expand adoption.
  • Recyclable pouches lead growth.
  • Tech innovation drives exports.

South Korea Expansion Outlook

South Korea will lead with a CAGR of 7.1%, supported by advanced R&D incentives and the rapid adoption of smart eco-packaging systems. The focus on bioplastic laminates and advanced VOC-free coatings aligns with national green certification programs. Integration of digital monitoring in packaging processes is improving quality control. South Korea’s export-oriented industries are accelerating use of VOC-minimized packaging, positioning it as a technology hub for sustainable solutions.

  • Advanced coatings dominate market.
  • Bioplastic laminates expand.
  • Green certification drives adoption.

Japan by Material

Voc Minimization Packaging Market Japan

Japan’s VOC minimization packaging market, valued at USD 200 million in 2025, is dominated by solvent-free laminates with a 35.0% share, owing to their reduced emissions and strong barrier performance. Low-VOC polyethylene accounts for 16.7%, widely used for flexible films in food and healthcare packaging. Polypropylene represents 15.3%, favored for recyclability and cost efficiency. PET contributes 14.0% due to high clarity and heat resistance, while water-based coated paperboard (12.1%) and bio-based plastics (6.8%) support eco-friendly material substitution. Market expansion is driven by Japan’s strict VOC emission standards and the packaging industry’s transition to solventless, low-carbon production technologies.
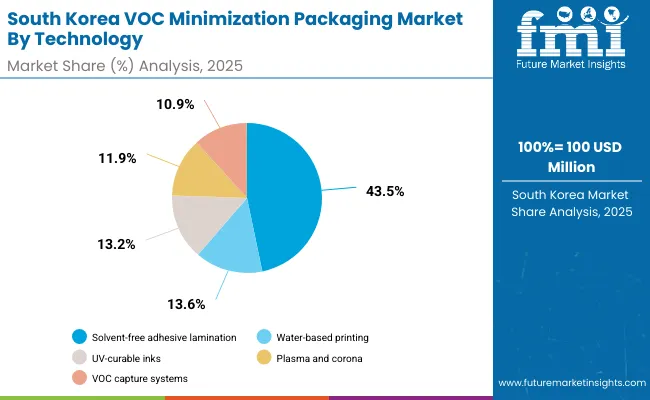
South Korea by Technology

Voc Minimization Packaging Market South Korea

South Korea’s VOC minimization packaging market, estimated at USD 100 million in 2025, is led by solvent-free adhesive lamination with a 43.5% share, reflecting widespread use in flexible packaging lines. Water-based printing and coating account for 13.6%, supporting eco-compliant labeling and decorative finishes. UV-curable inks and coatings represent 13.2%, offering rapid curing and minimal solvent release. Plasma and corona surface treatments contribute 11.9%, enhancing adhesion for recyclable substrates, while extrusion coating with VOC capture systems holds 10.9%. Rising environmental regulations, energy-efficient curing systems, and automation-based upgrades are accelerating Korea’s move toward sustainable packaging technologies.
Competitive Landscape of VOC Minimization Packaging Market

Voc Minimization Packaging Market By Company

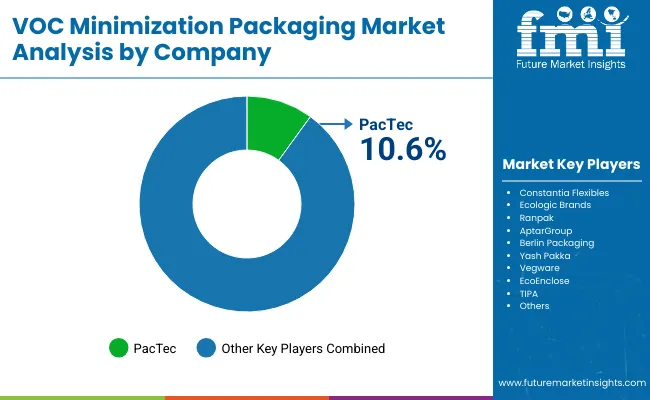
The market is moderately fragmented with key players PacTec, Constantia Flexibles, Ecologic Brands, Ranpak, AptarGroup, Berlin Packaging, YashPakka, Vegware, EcoEnclose, and TIPA. These companies focus on low-VOC technologies, recyclable films, and water-based adhesives.

Constantia Flexibles and TIPA lead solvent-free laminate innovations. YashPakka and Vegware pioneer bio-based packaging solutions. AptarGroup and Berlin Packaging focus on VOC-free coatings for food and pharmaceuticals. Competition centers on sustainability, recyclability, and emission compliance.

Key Developments of VOC Minimization Packaging Market

  • In November 2024, TIPA announced that at Pack Expo 2024, it would unveil an expanded portfolio of zero-waste compostable packaging solutions, including new compostable films, laminates, and closures. This expansion aims to provide sustainable alternatives that reduce plastic waste and potentially minimize volatile organic compound (VOC) emissions associated with conventional materials.
  • On March 4, 2025, Ranpak Holdings Corp. announced it would expand its sustainable packaging portfolio by introducing PaperWrap, a plastic-free pallet wrapping solution designed to replace traditional stretch films.

Key Companies

  • PacTec
  • Constantia Flexibles
  • Ecologic Brands
  • Ranpak
  • AptarGroup
  • Berlin Packaging
  • YashPakka
  • Vegware
  • EcoEnclose
  • TIPA

Scope of the Report

Item Value
Quantitative Units USD 1.4 Billion
By Material Solvent-Free Laminates, Low-VOC PE, PP, PET, Paperboard, Bio-Based Plastics
By Technology Solvent-Free Adhesive Lamination, Water-Based Coatings, UV Inks, Plasma & Corona, Extrusion with VOC Capture
By Packaging Type Flexible Pouches, Rigid Containers, Folding Cartons, Bottles, Wraps
By End-Use Industry Food & Beverages, Pharmaceuticals, Cosmetics, Industrial, E-commerce
Key Companies Profiled PacTec, Constantia Flexibles, Ecologic Brands, Ranpak, AptarGroup, Berlin Packaging, Yash Pakka, Vegware, EcoEnclose, TIPA
Additional Attributes Growth driven by emission control mandates, solvent-free adhesive innovation, and recyclable film development.

Key Segmentation

By Material:

  • Solvent-Free Laminates
  • Low-VOC Polyethylene (PE)
  • Polypropylene (PP)
  • Polyethylene Terephthalate (PET)
  • Water-Based Coated Paperboard
  • Bio-Based Plastics

By Technology:

  • Solvent-Free Adhesive Lamination
  • Water-Based Printing and Coating
  • UV-Curable Inks and Coatings
  • Plasma and Corona Surface Treatment
  • Extrusion Coating with VOC Capture Systems

By Packaging Type:

  • Flexible Pouches
  • Rigid Containers
  • Folding Cartons
  • Bottles and Tubes
  • Wraps and Films

By End-Use Industry:

  • Food and Beverages
  • Pharmaceuticals and Healthcare
  • Cosmetics and Personal Care
  • Industrial Manufacturing
  • Retail and E-commerce

By Region:

  • North America
  • Europe
  • Asia-Pacific
  • Latin America
  • Middle East & Africa

Frequently Asked Questions

How big will the VOC Minimization Packaging Market be in 2025?

The market will be valued at USD 1.4 billion in 2025.

What is the projected size of the VOC Minimization Packaging Market by 2035?

The market will reach USD 2.7 billion by 2035.

What growth rate is expected for the VOC Minimization Packaging Market between 2025 and 2035?

The market will grow at a CAGR of 6.6% during 2025-2035.

Which technology will dominate the VOC Minimization Packaging Market in 2025?

Solvent-free adhesive lamination will dominate with a 42.1% share in 2025.

Which packaging type will lead the VOC Minimization Packaging Market in 2025?

Flexible pouches will lead with a 38.4% share in 2025.

Table of Content

  1. Executive Summary
  2. Industry Introduction, including Taxonomy and Market Definition
  3. VOC Minimization Packaging Market Trends and Success Factors, including Macro-economic Factors, Market Dynamics, and Recent Industry Developments
  4. Global Market Demand Analysis 2020 to 2024 and Forecast 2025 to 2035, including Historical Analysis and Future Projections
  5. Pricing Analysis
  6. Global Market Analysis 2020 to 2024 and Forecast 2025 to 2035
    • Material
    • Technology
    • Packaging Type
    • End-Use Industry
  7. Global Market Analysis 2020 to 2024 and Forecast 2025 to 2035, By Material
    • Solvent-Free Laminates
    • Low-VOC Polyethylene (PE)
    • Polypropylene (PP)
    • Polyethylene Terephthalate (PET)
    • Water-Based Coated Paperboard
    • Bio-Based Plastics
  8. Global Market Analysis 2020 to 2024 and Forecast 2025 to 2035, By Technology
    • Solvent-Free Adhesive Lamination
    • Water-Based Printing and Coating
    • UV-Curable Inks and Coatings
    • Plasma and Corona Surface Treatment
    • Extrusion Coating with VOC Capture Systems
  9. Global Market Analysis 2020 to 2024 and Forecast 2025 to 2035, By Packaging Type
    • Flexible Pouches
    • Rigid Containers
    • Folding Cartons
    • Bottles and Tubes
    • Wraps and Films
  10. Global Market Analysis 2020 to 2024 and Forecast 2025 to 2035, By End-Use Industry
    • Food and Beverages
    • Pharmaceuticals and Healthcare
    • Cosmetics and Personal Care
    • Industrial Manufacturing
    • Retail and E-commerce
  11. Global Market Analysis 2020 to 2024 and Forecast 2025 to 2035, By Region
    • North America
    • Latin America
    • Europe
    • East Asia
    • South Asia
    • Middle East & Africa
  12. North America Sales Analysis 2020 to 2024 and Forecast 2025 to 2035, by Key Segments and Countries
  13. Latin America Sales Analysis 2020 to 2024 and Forecast 2025 to 2035, by Key Segments and Countries
  14. Europe Sales Analysis 2020 to 2024 and Forecast 2025 to 2035, by Key Segments and Countries
  15. East Asia Sales Analysis 2020 to 2024 and Forecast 2025 to 2035, by Key Segments and Countries
  16. South Asia Sales Analysis 2020 to 2024 and Forecast 2025 to 2035, by Key Segments and Countries
  17. Middle East & Africa Sales Analysis 2020 to 2024 and Forecast 2025 to 2035, by Key Segments and Countries
  18. Sales Forecast 2025 to 2035 by Material, Technology, Packaging Type, End-Use Industry for Countries
  19. Competition Outlook, including Market Structure Analysis, Company Share Analysis by Key Players, and Competition Dashboard
  20. Company Profile
    • PacTec
    • Constantia Flexibles
    • Ecologic Brands
    • Ranpak
    • AptarGroup
    • Berlin Packaging
    • Yash Pakka
    • Vegware
    • EcoEnclose
    • TIPA

List of Tables

  • Table 1: Global Market Value (USD Billion) & Units Forecast by Region, 2020-2035
  • Table 2: Global Market Value (USD Billion) & Units Forecast by Material, 2020-2035
  • Table 3: Global Market Value (USD Billion) & Units Forecast by Technology, 2020-2035
  • Table 4: Global Market Value (USD Billion) & Units Forecast by Packaging Type, 2020-2035
  • Table 5: Global Market Value (USD Billion) & Units Forecast by End-Use Industry, 2020-2035
  • Table 6: North America Market Value (USD Billion) & Units Forecast by Country, 2020-2035
  • Table 7: North America Market Value (USD Billion) & Units Forecast by Material, 2020-2035
  • Table 8: North America Market Value (USD Billion) & Units Forecast by Technology, 2020-2035
  • Table 9: North America Market Value (USD Billion) & Units Forecast by Packaging Type, 2020-2035
  • Table 10: North America Market Value (USD Billion) & Units Forecast by End-Use Industry, 2020-2035
  • Table 11: Latin America Market Value (USD Billion) & Units Forecast by Country, 2020-2035
  • Table 12: Latin America Market Value (USD Billion) & Units Forecast by Material, 2020-2035
  • Table 13: Latin America Market Value (USD Billion) & Units Forecast by Technology, 2020-2035
  • Table 14: Latin America Market Value (USD Billion) & Units Forecast by Packaging Type, 2020-2035
  • Table 15: Latin America Market Value (USD Billion) & Units Forecast by End-Use Industry, 2020-2035
  • Table 16: Europe Market Value (USD Billion) & Units Forecast by Country, 2020-2035
  • Table 17: Europe Market Value (USD Billion) & Units Forecast by Material, 2020-2035
  • Table 18: Europe Market Value (USD Billion) & Units Forecast by Technology, 2020-2035
  • Table 19: Europe Market Value (USD Billion) & Units Forecast by Packaging Type, 2020-2035
  • Table 20: Europe Market Value (USD Billion) & Units Forecast by End-Use Industry, 2020-2035
  • Table 21: East Asia Market Value (USD Billion) & Units Forecast by Country, 2020-2035
  • Table 22: East Asia Market Value (USD Billion) & Units Forecast by Material, 2020-2035
  • Table 23: East Asia Market Value (USD Billion) & Units Forecast by Technology, 2020-2035
  • Table 24: East Asia Market Value (USD Billion) & Units Forecast by Packaging Type, 2020-2035
  • Table 25: East Asia Market Value (USD Billion) & Units Forecast by End-Use Industry, 2020-2035
  • Table 26: South Asia Market Value (USD Billion) & Units Forecast by Country, 2020-2035
  • Table 27: South Asia Market Value (USD Billion) & Units Forecast by Material, 2020-2035
  • Table 28: South Asia Market Value (USD Billion) & Units Forecast by Technology, 2020-2035
  • Table 29: South Asia Market Value (USD Billion) & Units Forecast by Packaging Type, 2020-2035
  • Table 30: South Asia Market Value (USD Billion) & Units Forecast by End-Use Industry, 2020-2035
  • Table 31: Middle East & Africa Market Value (USD Billion) & Units Forecast by Country, 2020-2035
  • Table 32: Middle East & Africa Market Value (USD Billion) & Units Forecast by Material, 2020-2035
  • Table 33: Middle East & Africa Market Value (USD Billion) & Units Forecast by Technology, 2020-2035
  • Table 34: Middle East & Africa Market Value (USD Billion) & Units Forecast by Packaging Type, 2020-2035
  • Table 35: Middle East & Africa Market Value (USD Billion) & Units Forecast by End-Use Industry, 2020-2035

List of Figures

  • Figure 1: Global Market Value Share (%), Growth Rate (Y-o-Y), and Value (USD Billion) & Units Projection by Material, 2020-2035
  • Figure 2: Global Market Value Share (%), Growth Rate (Y-o-Y), and Value (USD Billion) & Units Projection by Technology, 2020-2035
  • Figure 3: Global Market Value Share (%), Growth Rate (Y-o-Y), and Value (USD Billion) & Units Projection by Packaging Type, 2020-2035
  • Figure 4: Global Market Value Share (%), Growth Rate (Y-o-Y), and Value (USD Billion) & Units Projection by End-Use Industry, 2020-2035
  • Figure 5: Global Market Value Share (%), Growth Rate (Y-o-Y), and Value (USD Billion) & Units Projection by Region, 2020-2035
  • Figure 6: North America Market Value Share (%), Growth Rate (Y-o-Y), and Value (USD Billion) & Units Projection by Material, 2020-2035
  • Figure 7: North America Market Value Share (%), Growth Rate (Y-o-Y), and Value (USD Billion) & Units Projection by Technology, 2020-2035
  • Figure 8: North America Market Value Share (%), Growth Rate (Y-o-Y), and Value (USD Billion) & Units Projection by Packaging Type, 2020-2035
  • Figure 9: North America Market Value Share (%), Growth Rate (Y-o-Y), and Value (USD Billion) & Units Projection by End-Use Industry, 2020-2035
  • Figure 10: North America Market Value Share (%), Growth Rate (Y-o-Y), and Value (USD Billion) & Units Projection by Country, 2020-2035
  • Figure 11: Latin America Market Value Share (%), Growth Rate (Y-o-Y), and Value (USD Billion) & Units Projection by Material, 2020-2035
  • Figure 12: Latin America Market Value Share (%), Growth Rate (Y-o-Y), and Value (USD Billion) & Units Projection by Technology, 2020-2035
  • Figure 13: Latin America Market Value Share (%), Growth Rate (Y-o-Y), and Value (USD Billion) & Units Projection by Packaging Type, 2020-2035
  • Figure 14: Latin America Market Value Share (%), Growth Rate (Y-o-Y), and Value (USD Billion) & Units Projection by End-Use Industry, 2020-2035
  • Figure 15: Latin America Market Value Share (%), Growth Rate (Y-o-Y), and Value (USD Billion) & Units Projection by Country, 2020-2035
  • Figure 16: Europe Market Value Share (%), Growth Rate (Y-o-Y), and Value (USD Billion) & Units Projection by Material, 2020-2035
  • Figure 17: Europe Market Value Share (%), Growth Rate (Y-o-Y), and Value (USD Billion) & Units Projection by Technology, 2020-2035
  • Figure 18: Europe Market Value Share (%), Growth Rate (Y-o-Y), and Value (USD Billion) & Units Projection by Packaging Type, 2020-2035
  • Figure 19: Europe Market Value Share (%), Growth Rate (Y-o-Y), and Value (USD Billion) & Units Projection by End-Use Industry, 2020-2035
  • Figure 20: Europe Market Value Share (%), Growth Rate (Y-o-Y), and Value (USD Billion) & Units Projection by Country, 2020-2035
  • Figure 21: East Asia Market Value Share (%), Growth Rate (Y-o-Y), and Value (USD Billion) & Units Projection by Material, 2020-2035
  • Figure 22: East Asia Market Value Share (%), Growth Rate (Y-o-Y), and Value (USD Billion) & Units Projection by Technology, 2020-2035
  • Figure 23: East Asia Market Value Share (%), Growth Rate (Y-o-Y), and Value (USD Billion) & Units Projection by Packaging Type, 2020-2035
  • Figure 24: East Asia Market Value Share (%), Growth Rate (Y-o-Y), and Value (USD Billion) & Units Projection by End-Use Industry, 2020-2035
  • Figure 25: East Asia Market Value Share (%), Growth Rate (Y-o-Y), and Value (USD Billion) & Units Projection by Country, 2020-2035
  • Figure 26: South Asia Market Value Share (%), Growth Rate (Y-o-Y), and Value (USD Billion) & Units Projection by Material, 2020-2035
  • Figure 27: South Asia Market Value Share (%), Growth Rate (Y-o-Y), and Value (USD Billion) & Units Projection by Technology, 2020-2035
  • Figure 28: South Asia Market Value Share (%), Growth Rate (Y-o-Y), and Value (USD Billion) & Units Projection by Packaging Type, 2020-2035
  • Figure 29: South Asia Market Value Share (%), Growth Rate (Y-o-Y), and Value (USD Billion) & Units Projection by End-Use Industry, 2020-2035
  • Figure 30: South Asia Market Value Share (%), Growth Rate (Y-o-Y), and Value (USD Billion) & Units Projection by Country, 2020-2035
  • Figure 31: Middle East & Africa Market Value Share (%), Growth Rate (Y-o-Y), and Value (USD Billion) & Units Projection by Material, 2020-2035
  • Figure 32: Middle East & Africa Market Value Share (%), Growth Rate (Y-o-Y), and Value (USD Billion) & Units Projection by Technology, 2020-2035
  • Figure 33: Middle East & Africa Market Value Share (%), Growth Rate (Y-o-Y), and Value (USD Billion) & Units Projection by Packaging Type, 2020-2035
  • Figure 34: Middle East & Africa Market Value Share (%), Growth Rate (Y-o-Y), and Value (USD Billion) & Units Projection by End-Use Industry, 2020-2035
  • Figure 35: Middle East & Africa Market Value Share (%), Growth Rate (Y-o-Y), and Value (USD Billion) & Units Projection by Country, 2020-2035
Dashboard
Dashboard
Dashboard
Dashboard
Dashboard
Dashboard

Full Research Suite comprises of:

Market outlook & trends analysis

Market outlook & trends analysis

Interviews & case studies

Interviews & case studies

Strategic recommendations

Strategic recommendations

Vendor profiles & capabilities analysis

Vendor profiles & capabilities analysis

5-year forecasts

5-year forecasts

8 regions and 60+ country-level data splits

8 regions and 60+ country-level data splits

Market segment data splits

Market segment data splits

12 months of continuous data updates

12 months of continuous data updates

DELIVERED AS:

PDF EXCEL ONLINE

Full Research Suite


$5000

$7500

$10000

Buy Report Now
Similar Industry Reports

Similar Industry Reports

VOC Sensors and Monitors Market

VOC Sensors and Monitors Market Analysis - Size, Growth, and Forecast 2025 to 2035

Avocado Oil Market
Avocado Oil Market

Avocado Oil Market Size and Share Forecast Outlook 2025 to 2035

Levocarnitine Market

Levocarnitine Market Size and Share Forecast Outlook 2025 to 2035

Korea Avocado Oil Market

Korea Avocado Oil Market Analysis - Size, Share & Trends 2025 to 2035

Japan Avocado Oil Market

Japan Avocado Oil Market Analysis - Size, Share & Trends 2025 to 2035

Online Advocacy Platform Market

Online Advocacy Platform Market

Employee Advocacy Software Market

Employee Advocacy Software Market Size and Share Forecast Outlook 2025 to 2035

Customer Advocacy Software Market

Customer Advocacy Software Market - Enhancing Brand Loyalty

Bio-based and Low VOC Paints Market

Bio-based and Low VOC Paints Market Size and Share Forecast Outlook 2025 to 2035

Volatile Organic Compound (VOC) Detector Market

Volatile Organic Compound (VOC) Detector Market Size and Share Forecast Outlook 2025 to 2035

Demand and Trend Analysis of Avocado Oil in Western europe

Demand and Trend Analysis of Avocado Oil in Western europe Size and Share Forecast Outlook 2025 to 2035

Packaging Testing Services Market

Packaging Testing Services Market Size and Share Forecast Outlook 2025 to 2035

Packaging Tubes Market

Packaging Tubes Market Size and Share Forecast Outlook 2025 to 2035

Packaging Jar Market

Packaging Jar Market Forecast and Outlook 2025 to 2035

Packaging Barrier Film Market

Packaging Barrier Film Market Size and Share Forecast Outlook 2025 to 2035

Packaging Films Market

Packaging Films Market Size and Share Forecast Outlook 2025 to 2035

Packaging Laminate Market

Packaging Laminate Market Size and Share Forecast Outlook 2025 to 2035

Packaging Burst Strength Test Market

Packaging Burst Strength Test Market Size and Share Forecast Outlook 2025 to 2035

Packaging Tapes Market

Packaging Tapes Market Analysis - Size, Share, & Forecast Outlook 2025 to 2035

Packaging Materials Market

Packaging Materials Market Size and Share Forecast Outlook 2025 to 2035

Future Market Insights

VOC Minimization Packaging Market

Chat With MaRIA

Chat With

MaRIA

Hi There, I am MaRIA, Your Market Research Intelligence Assistant. How may I help you?