The wealth management platform market is estimated to be valued at USD 4.0 billion in 2025 and is projected to reach USD 10.4 billion by 2035, registering a compound annual growth rate (CAGR) of 10.0% over the forecast period.
Wealth advisors evaluate platform specifications based on portfolio management automation, client portal sophistication, and regulatory reporting capabilities when selecting technology solutions for high-net-worth client servicing, multi-generational planning, and alternative investment tracking across diverse asset categories. System selection involves analyzing custodial integration breadth, performance calculation accuracy, and client communication tools while considering implementation complexity, training requirements, and ongoing support quality necessary for advisor productivity enhancement. Technology investments balance subscription costs against client acquisition potential, considering fee compression pressures, operational efficiency gains, and competitive differentiation opportunities that justify platform adoption through measurable practice growth and profitability improvement.
Implementation operations require comprehensive data migration, workflow customization, and user training protocols that ensure seamless advisor adoption while maintaining client service continuity throughout technology transition periods and system integration phases. Deployment coordination involves managing custodial connections, performance database creation, and client access provisioning while addressing compliance requirements, security protocols, and backup procedures specific to financial services technology. Quality validation encompasses calculation accuracy verification, reporting functionality testing, and security assessment that confirm platform reliability while supporting regulatory examination readiness and client confidentiality protection.
Organizational integration involves portfolio managers, client relationship specialists, and compliance officers collaborating to optimize platform utilization that balances automation benefits with personalized service delivery while addressing specific firm requirements and client expectations. Training programs encompass system navigation, reporting generation, and client communication enhancement while coordinating with existing investment processes, compliance procedures, and business development activities. Performance measurement includes advisor productivity improvement, client satisfaction enhancement, and operational cost reduction that validate platform investment effectiveness throughout wealth management practice evolution.
Service specialization addresses ultra-high-net-worth families requiring comprehensive wealth orchestration, independent advisors seeking practice scalability, and institutional consultants needing sophisticated reporting capabilities that leverage platform advantages for specific wealth management challenges. Technology providers coordinate with custodial banks, investment managers, and regulatory consultants to develop comprehensive wealth management ecosystems addressing client-specific requirements while maintaining competitive positioning and regulatory compliance. Specialized modules encompass trust accounting, charitable giving optimization, and multi-entity reporting that require advanced functionality and specialized expertise for complex wealth structures.
Vendor relationships involve coordination between platform providers, implementation consultants, and ongoing support teams to establish comprehensive technology programs that address advisor training, client onboarding, and system optimization throughout wealth management practice transformation. Service agreements include customization capabilities, integration support, and performance guarantees that protect advisor investments while ensuring successful platform deployment and client satisfaction achievement. Strategic partnerships encompass collaboration with investment research providers, tax planning software, and estate planning tools to deliver integrated wealth management solutions supporting comprehensive client advisory relationships.
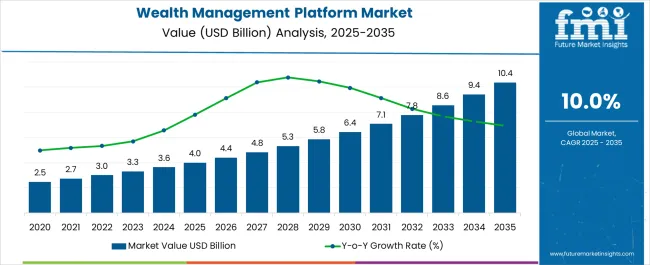
| Metric | Value |
|---|---|
| Wealth Management Platform Market Estimated Value in (2025 E) | USD 4.0 billion |
| Wealth Management Platform Market Forecast Value in (2035 F) | USD 10.4 billion |
| Forecast CAGR (2025 to 2035) | 10.0% |
The wealth management platform market is experiencing strong growth driven by rising demand for digital advisory services, evolving investor expectations, and regulatory requirements for transparency. Increasing adoption of cloud-based technologies and AI-driven tools is transforming portfolio management, risk assessment, and client engagement.
Financial institutions are focusing on offering personalized investment solutions through digital platforms, catering to both high-net-worth and retail clients. Integration of advanced analytics, robo-advisory capabilities, and seamless omnichannel engagement is enhancing platform efficiency and scalability.
The outlook remains positive as regulatory compliance, cybersecurity, and sustainable investment strategies continue to shape the industry. With the growing need for efficiency and tailored investment approaches, wealth management platforms are expected to remain critical in strengthening client relationships and improving financial outcomes.
The market is segmented by Advisory Mode, Application, and End-use and region. By Advisory Mode, the market is divided into Human Advisory, Robo Advisory, Hybrid, Deployment Model, On-premise, and Cloud. In terms of Application, the market is classified into Financial Advice & Management, Portfolio, Accounting & Trading Management, Performance Management, Risk & Compliance Management, and Reporting. Based on End-use, the market is segmented into Banking Investment Management Firms, Trading & Exchange Firms, and Brokerage Firms. Regionally, the market is classified into North America, Latin America, Western Europe, Eastern Europe, Balkan & Baltic Countries, Russia & Belarus, Central Asia, East Asia, South Asia & Pacific, and the Middle East & Africa.
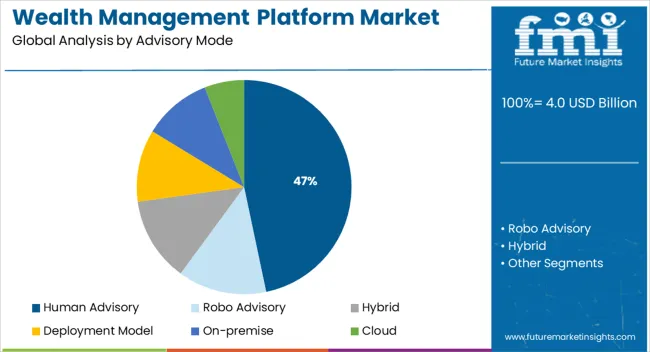
The human advisory segment is projected to hold 46.70% of total revenue by 2025 within the advisory mode category, making it the leading approach. This dominance is attributed to the preference for personalized financial advice and relationship-driven wealth management.
High-net-worth individuals and institutional clients continue to value human expertise for complex financial planning, estate management, and multi-asset portfolio strategies. Trust, accountability, and the ability to provide tailored solutions in volatile markets have reinforced the importance of human advisors.
As hybrid models combining digital tools with expert advisory gain traction, the human advisory segment maintains its leadership through its balance of personal interaction and technology-driven insights.
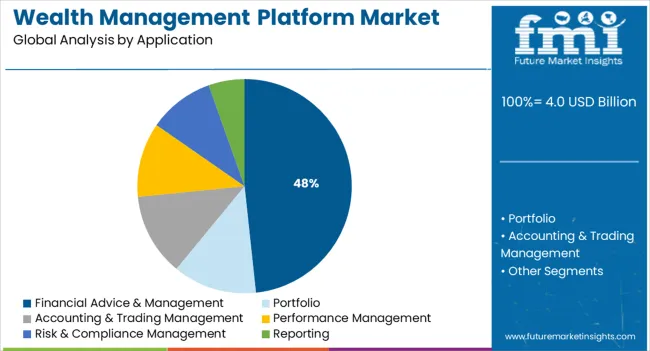
The financial advice and management application is expected to contribute 48.30% of total revenue by 2025 within the application category, establishing it as the dominant segment. This leadership is driven by the rising need for comprehensive investment planning, retirement solutions, and tax optimization strategies.
The shift toward holistic financial wellness and regulatory compliance has accelerated reliance on platforms offering integrated advice and management tools. The segment benefits from increased investor interest in diversified portfolios, ESG investments, and long-term financial security.
As wealth managers adopt platforms that provide a unified view of assets, liabilities, and risk exposure, financial advice and management continues to remain the most influential application in the market.
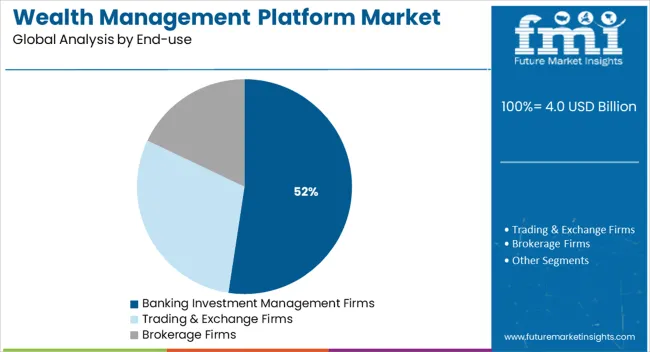
The banking investment management firms segment is expected to represent 52.40% of total revenue by 2025 under the end use category, positioning it as the most prominent segment. This growth is supported by large-scale adoption of wealth management platforms across global banks and investment firms aiming to expand their client base and improve operational efficiency.
With extensive resources and regulatory responsibilities, these institutions have prioritized advanced platforms to strengthen risk management, compliance, and customer engagement. Their scale allows for significant investments in automation, AI integration, and real-time analytics, ensuring premium service delivery.
The trust and established reputation of banking institutions combined with their ability to provide comprehensive financial products further enhance this segment’s leadership in the wealth management platform market.
In contrast to the 13.2% CAGR observed between 2020 and 2025, the demand for the wealth management platforms market is anticipated to register a 10.0% CAGR between 2025 and 2035. In line with corporate policies, the market is seeing the adoption of digitalization and process automation, both of which promise to be profitable.
Many businesses are seeking to hasten digitization, increase operational effectiveness, and strengthen client relationships. As a result, several end-use sectors are likely to speed up the adoption of financial consulting and management solutions.
Wealth management tools are assisting companies to track transactions and manage their assets more effectively. Advancements in AI and Blockchain holds the potential to expand the market during forecasting period. The artificial intelligence system monitors the customer's spending and makes relevant recommendations. The blockchain and AI track client spending patterns, keep track of trends and make estimates based on data.
Interventions of AI Technologies are Stimulating Market Growth
The incorporation of AI is expanding across all industries. Strategically, businesses have emphasized AI in their initiatives to transform business. The idea of wealth management artificial intelligence is revolutionary in terms of AI technology for software and application development.
The platform attracts investment from many businesses due to its wide application and potential advantages. Businesses can profit from improved data analytics, user experience, cost savings, quick development, and more. As a result, it is projected that the market for wealth management may continue to increase due to the growing trend of low-code AI.
Current Trend
Improved Financial Firm Experience is Essential to Meet Growing Demand for Wealth Management Platforms
The main goal of financial firms is to enhance the client experience by providing integrated solutions through unified platforms. To offer a next-generation banking and financial experience, banks have started replacing conventional, internal core banking systems.
Increased client trust in banks results in more robust engagement and great investment willingness thanks to wealth management platforms. As long as administrative and operational costs are kept to a minimum, the platform should be able to accommodate the rising demand for advisory services while improving effectiveness and efficiency across the advisory network. Several banks have introduced wealth management solutions.
For instance, private sector lender, IndusInd Bank launched Pioneer Banking in January 2024. This wealth management platform is primarily targeted at high-net-worth individuals. Based on the bank's research skills, the new service combines wealth management options with a range of personal and business banking products.
Key Restraints
Based on the Advisory Mode, a strong CAGR of 15.00% is predicted for the Robo advisory segment during the projected period. When compared to other ways, robo advisors are more accessible and reliable.
Robo advisers have several advantages, including a considerably simpler onboarding procedure, a low investment threshold, and a variety of automated features. Customers can access the portfolio of business services directly through the software.
In 2025, the human advice segment of the market for wealth management platforms retained a revenue share of over 60%. High-net-worth individuals (HNWIs) are moving away from automated wealth management systems and towards human advisory services due to growing security concerns in the sector.
This advisory model uses specialized data analysis technologies that take into account the customers' diverse financial backgrounds and provide outcomes after being analyzed.
Between 2025 and 2035, the cloud segment is expected to grow at a rate of over 15% for deployment. Financial services firms are increasingly adopting cloud-based wealth management solutions. It offers a less complicated setup, the flexibility required for remote work, and less infrastructure investment.
Wealth management experts may operate from any device and OS thanks to cloud computing. Cloud platforms enable businesses to develop cutting-edge wealth management solutions since they are scalable and cost-effective.
Through 2035, the risk & compliance management applications segment's wealth management platform market is likely to expand at a CAGR of 10%.
There is huge need for good ways to manage risk in the business sector. This might involve combining things like how a business operates, its IT systems, following rules, considering environmental and social impact, and using outside companies. The installation of Know Your Customer (KYC), Know Your Product (KYP), and anti-fraud and anti-money laundering (AML) compliance procedures are anticipated.
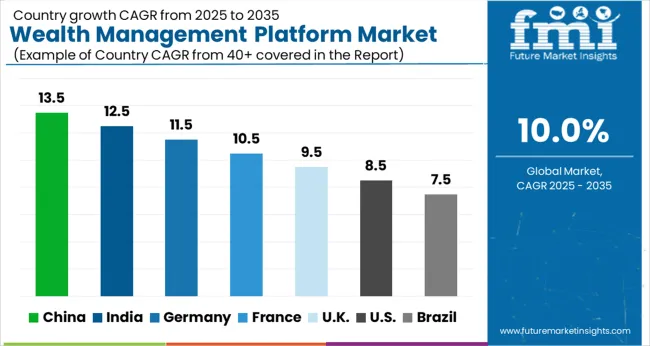
North America contributed USD 4.0 billion to the global market in 2025. In North America, the importance of wealth management services is rising as retailers look to draw in and retain successful customers. For instance, a sizeable portion of the net income of retail banks in the region comes from wealthy mass consumers.
Numerous diversified financial service companies in the area are expanding their wealth management operations. Moreover, the market is expanding due to the presence of leading players in the country.
With a CAGR of 8.4%, the Asia Pacific wealth management platform market demand is predicted to increase at a significant rate during the projected period and reach USD 40.4 billion by 2035.
Asia Pacific regional market is anticipated to expand at a prominent rate due to the increased usage of digital platforms in the region and prospects for private wealth management are expected to develop. Technologically knowledgeable customers can use robo advising solutions to effectively meet their investing needs by combining creative data and cutting-edge algorithms.
Additionally, the region's surging small and medium-sized businesses are expected to assist wealth management software companies in developing nations like China and India.
Wealthy, a wealth management platform, announced a USD 7.5 million funding round led by Alpha Wave Incubation on Wednesday (AWI). AWI is managed by Alpha Wave Global and is backed by Abu Dhabi investment vehicle ADQ's venture platform (formerly Falcon Edge Capital).
The Savrola Group joined the round as a new investor, joining existing backers Venture Highway, Good Capital, and Emphasis Ventures.
Wealthy may use the funds to expand globally, including in the Middle East, according to a statement issued by the Bengaluru-based company.
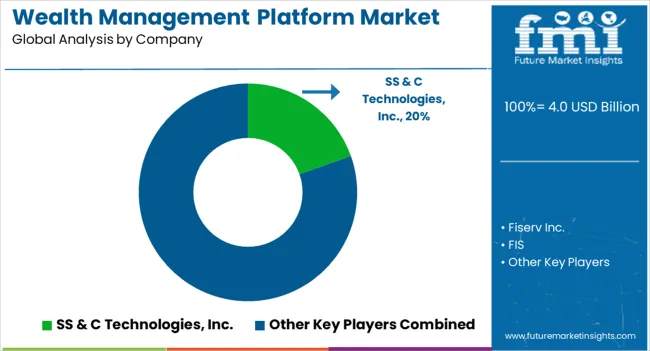
The wealth management platform market is experiencing strong growth as financial institutions accelerate digital transformation to deliver personalized investment experiences and improve operational efficiency. SS&C Technologies Holdings Inc., Fiserv Inc., and FIS (Fidelity National Information Services Inc.) lead the market with integrated, cloud-based wealth management ecosystems that enable automation of portfolio management, client onboarding, and regulatory compliance. Their platforms leverage AI, data analytics, and open APIs to enhance transparency and scalability across advisory and brokerage services.
Broadridge Financial Solutions Inc. and SEI Investments Company focus on digital-first solutions for portfolio rebalancing, risk assessment, and multi-asset class reporting, supporting hybrid advisory models adopted by global banks and wealth managers. Temenos Headquarters SA and Avaloq Group AG bring advanced core banking and wealth management integration, empowering financial institutions with seamless front-to-back digital workflows and strong compliance frameworks.
InvestCloud Inc., Profile Software S.A., and Comarch SA emphasize client engagement through data visualization, interactive dashboards, and personalized goal tracking, catering to the growing demand for user-centric digital experiences. Dorsum Ltd. and InvestEdge Inc. differentiate by offering modular, customizable platforms suited for independent advisors and boutique wealth firms. The market’s evolution underscores rising demand for automation, digital advisory, and sustainable investment management solutions.
| Attribute | Details |
|---|---|
| Growth Rate | CAGR of 10.0% from 2025 to 2035 |
| Base Year of Estimation | 2025 |
| Historical Data | 2020 to 2025 |
| Forecast Period | 2025 to 2035 |
| Quantitative Units | Revenue in USD billion and Volume in Units and F-CAGR from 2025 to 2035 |
| Report Coverage | Revenue Forecast, Volume Forecast, Company Ranking, Competitive Landscape, growth factors, Trends, and Pricing Analysis |
| Key Segments Covered | Advisory Mode, Application, End User, By Region |
| Regions Covered | North America; Latin America; Europe; East Asia; South Asia; The Middle East & Africa; Oceania |
| Key Countries Profiled | United States, Canada, Brazil, Mexico, Germany, Italy, France, United Kingdom, Spain, Russia, China, Japan, India, GCC Countries, Australia |
| Key Companies Profiled |
SS&C Technologies Holdings Inc., Fiserv Inc., FIS (Fidelity National Information Services Inc.), Profile Software S.A., Broadridge Financial Solutions Inc., InvestEdge Inc., Temenos Headquarters SA, InvestCloud Inc., SEI Investments Company, Comarch SA, Dorsum Ltd., Avaloq Group AG |
| Customization & Pricing | Available upon Request |
The global wealth management platform market is estimated to be valued at USD 4.0 billion in 2025.
The market size for the wealth management platform market is projected to reach USD 10.4 billion by 2035.
The wealth management platform market is expected to grow at a 10.0% CAGR between 2025 and 2035.
The key product types in wealth management platform market are human advisory, robo advisory, hybrid, deployment model, on-premise and cloud.
In terms of application, financial advice & management segment to command 48.3% share in the wealth management platform market in 2025.


Full Research Suite comprises of:
Market outlook & trends analysis
Interviews & case studies
Strategic recommendations
Vendor profiles & capabilities analysis
5-year forecasts
8 regions and 60+ country-level data splits
Market segment data splits
12 months of continuous data updates
DELIVERED AS:
PDF EXCEL ONLINE
WealthTech Solutions Market Size and Share Forecast Outlook 2025 to 2035
Tax Management Market Size and Share Forecast Outlook 2025 to 2035
Key Management as a Service Market
Cash Management Supplies Packaging Market Size and Share Forecast Outlook 2025 to 2035
Fuel Management Software Market Size and Share Forecast Outlook 2025 to 2035
Risk Management Market Size and Share Forecast Outlook 2025 to 2035
SBOM Management and Software Supply Chain Compliance Market Analysis - Size, Share, and Forecast Outlook 2025 to 2035
Case Management Software (CMS) Market Size and Share Forecast Outlook 2025 to 2035
Farm Management Software Market Size and Share Forecast Outlook 2025 to 2035
Lead Management Market Size and Share Forecast Outlook 2025 to 2035
Pain Management Devices Market Growth - Trends & Forecast 2025 to 2035
Cash Management Services Market – Trends & Forecast 2025 to 2035
CAPA Management (Corrective Action / Preventive Action) Market
Exam Management Software Market
Data Management Platforms Market Analysis and Forecast 2025 to 2035, By Type, End User, and Region
Light Management System Market Size and Share Forecast Outlook 2025 to 2035
Labor Management System In Retail Market Size and Share Forecast Outlook 2025 to 2035
Waste Management Carbon Credit Market Size and Share Forecast Outlook 2025 to 2035
Waste Management Market Size and Share Forecast Outlook 2025 to 2035
Stool Management System Market Analysis - Size, Share, and Forecast Outlook 2025 to 2035

Thank you!
You will receive an email from our Business Development Manager. Please be sure to check your SPAM/JUNK folder too.
Chat With
MaRIA