Lead Acid Battery Market Size and Share Forecast Outlook 2025 to 2035

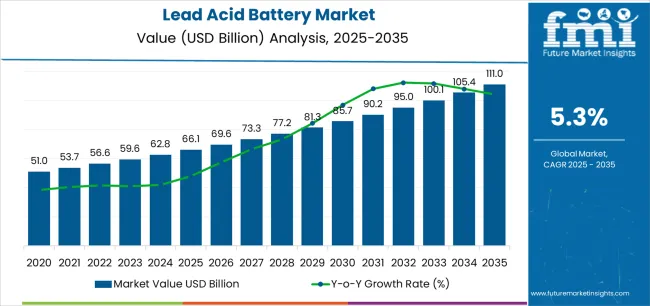
The Lead Acid Battery Market is estimated to be valued at USD 66.1 billion in 2025 and is projected to reach USD 111.0 billion by 2035, registering a compound annual growth rate (CAGR) of 5.3% over the forecast period.

The Lead Acid Battery market is experiencing steady growth driven by its established role as a reliable and cost-effective energy storage solution across multiple industries. The future outlook for this market is influenced by increasing demand from transportation, industrial, and backup power applications.

The widespread adoption of electric vehicles, commercial fleets, and renewable energy systems has reinforced the relevance of lead acid batteries due to their durability, ease of recycling, and lower initial investment compared to alternative battery technologies. Additionally, advancements in battery design and maintenance practices are improving efficiency and lifespan, making them a practical solution for both developed and emerging markets.

The market is also benefiting from the growing focus on sustainability and circular economy initiatives, which emphasize recycling and resource recovery from lead acid batteries As energy storage needs expand globally and regulatory frameworks encourage safer and more reliable battery solutions, lead acid batteries are expected to maintain a strong presence in transportation, industrial, and backup power sectors, with consistent growth opportunities in both existing and new applications.
Quick Stats for Lead Acid Battery Market

  • Lead Acid Battery Market Industry Value (2025): USD 66.1 billion
  • Lead Acid Battery Market Forecast Value (2035): USD 111.0 billion
  • Lead Acid Battery Market Forecast CAGR: 5.3%
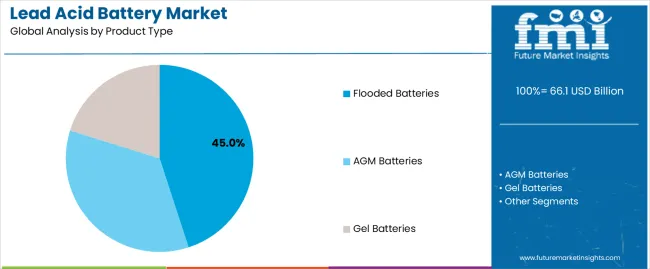
  • Leading Segment in Lead Acid Battery Market in 2025: Flooded Batteries (45.0%)
  • Key Growth Region in Lead Acid Battery Market: North America, Asia-Pacific, Europe
  • Top Key Players in Lead Acid Battery Market: Clarios, Furukawa Electric Co., Ltd, Zhejiang Narada Power Source Co., Ltd, Leoch International Technology Ltd, Yokohama Batteries Sdn. Bhd, EnerSys, Exide Industries Limited, GS Yuasa Corporation, Hoppecke Batterien GmbH & Co. KG, Crown Battery Corporation, C&D Technologies, Inc

Lead Acid Battery Market Market Value Analysis

Metric Value
Lead Acid Battery Market Estimated Value in (2025 E) USD 66.1 billion
Lead Acid Battery Market Forecast Value in (2035 F) USD 111.0 billion
Forecast CAGR (2025 to 2035) 5.3%

Segmental Analysis

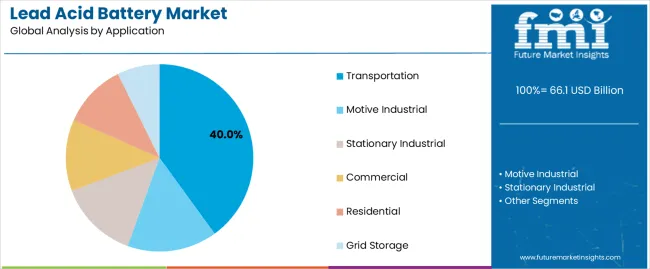
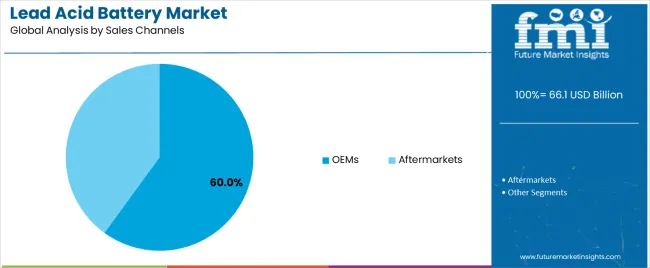
The market is segmented by Product Type, Application, and Sales Channels and region. By Product Type, the market is divided into Flooded Batteries, AGM Batteries, and Gel Batteries. In terms of Application, the market is classified into Transportation, Motive Industrial, Stationary Industrial, Commercial, Residential, and Grid Storage. Based on Sales Channels, the market is segmented into OEMs and Aftermarkets. Regionally, the market is classified into North America, Latin America, Western Europe, Eastern Europe, Balkan & Baltic Countries, Russia & Belarus, Central Asia, East Asia, South Asia & Pacific, and the Middle East & Africa.
Insights into the Flooded Batteries Product Type Segment

Lead Acid Battery Market Analysis By Product Type

The flooded batteries product type segment is projected to hold 45.0% of the Lead Acid Battery market revenue share in 2025, making it the leading product type. This dominance is driven by their proven reliability, robust performance under varying load conditions, and relatively low cost compared to other battery types.

Flooded batteries are preferred in applications where maintenance is manageable and operational environments demand high tolerance to overcharging and deep discharging. The ease of recycling and long-standing supply chain infrastructure further support their adoption.

Additionally, improvements in battery design, electrolyte management, and ventilation systems have enhanced safety and efficiency, reinforcing their relevance The segment’s growth is supported by consistent demand from transportation and industrial sectors, where durability, scalability, and cost-effectiveness are critical factors for energy storage solutions.
Insights into the Transportation Application Segment

Lead Acid Battery Market Analysis By Application

The transportation application segment is expected to account for 40.0% of the Lead Acid Battery market revenue share in 2025, establishing it as the leading application. This growth is driven by the extensive use of lead acid batteries in commercial vehicles, electric mobility solutions, and backup systems for transportation fleets.

Their ability to deliver reliable power, withstand harsh operating conditions, and provide cost-efficient energy storage has made them a preferred choice for fleet operators and vehicle manufacturers. Furthermore, the compatibility of lead acid batteries with existing vehicle electrical systems and the availability of maintenance and recycling infrastructure contribute to their widespread adoption.

The increasing demand for electrification in transportation and the need for dependable energy storage in commercial fleets continue to strengthen the prominence of this application segment.
Insights into the OEMs Sales Channel Segment

Lead Acid Battery Market Analysis By Sales Channels

The OEMs sales channel segment is anticipated to hold 60.0% of the Lead Acid Battery market revenue in 2025, making it the dominant distribution channel. This is primarily due to the strong integration of lead acid batteries within original equipment manufacturing processes, ensuring compatibility, reliability, and warranty compliance for end users.

OEM partnerships facilitate direct supply and technical support, which enhances customer trust and operational efficiency. The segment has benefited from growing collaborations between battery manufacturers and vehicle, industrial, and renewable energy equipment producers.

Additionally, OEM distribution allows for standardized quality control and optimized supply chain management, reinforcing the adoption of lead acid batteries across various applications The consistent demand from transportation and industrial sectors, combined with ongoing manufacturing partnerships, ensures the continued dominance of the OEMs channel in market revenue share.

Semi-annual Market Update

The table below presents a comparative assessment of the variation in CAGR over six months for the base year (2025) and current year (2025) for the global industry.

This analysis reveals crucial shifts in performance and indicates revenue realization patterns, thereby providing stakeholders with a better vision of the growth trajectory over the year. The first half of the year, or H1, spans from January to June. The second half, H2, includes the months from July to December.

The table below presents the expected CAGRs for Pb-acid batteries, driven by increasing demand from the automotive industry and renewable energy applications. In the first half (H1) of 2025 to 2035, the business is predicted to surge at a CAGR of 5.1%, followed by a higher growth rate of 5.7% in the second half (H2) of the same period.

Particular Value CAGR
H1 5.1% (2025 to 2035)
H2 5.7% (2025 to 2035)
H1 5.3% (2025 to 2035)
H2 5.8% (2025 to 2035 )

Moving into the subsequent period, from H1 2025 to H2 2035, the CAGR is projected to drop slightly to 5.3% in the first half and relatively grow to 5.8% in the second half. In the first half (H1), the industry witnessed an increase of 20 BPS while in the second half (H2), there was a slight surge of 10 BPS.

Key Industry Highlights

High Demand for Easily Recyclable Materials Augments Sales

Lead acid batteries offer significant environmental advantages over lithium-ion batteries due to their superior recyclability. Around 97% of a lead acid battery's components, including lead and sulfuric acid, can be recycled. This high recycling rate helps to minimize environmental impact and reduce the demand for new raw materials.

According to the International Lead Association, due to its fundamental properties, lead is considered one of the most recycled materials in the world. It is also attributed to the fact that lead-based products are easily identifiable and economical to recycle.

Recycled lead provides 60% of the world’s lead use, with about 80% utilized in battery manufacturing. Globally, lead acid battery recycling is a USD 24 billion industry, per annum, while in Australia, it is worth about USD 250 million, per annum.

Sales of SLI Batteries Rise Globally Amid Astonishing Demand for HEVs

The demand for SLI batteries is estimated to be driven by the growing consumer automotive segment, which is considered the most significant revenue grosser. Demand is also spurred by both original equipment manufacturers (OEMs) and aftermarkets. These help in augmenting new sales as well as replacement activities.

With improvements in the economy, automobile sales are booming, which is boding well for the SLI lead acid battery industry since these are the preferred choices for powering internal combustion engine-based automobiles. Hence, increasing demand for vehicles is anticipated to surge the need for Pb-acid batteries.

A few leading automobile manufacturers plan to boost the production of hybrid electric vehicles (HEVs). Hence, they are relying on lead-acid batteries for cost-effectiveness and reliability.

Similarly, rising sales of conventional internal combustion engine (ICE) vehicles continue to require SLI batteries. As more consumers adopt HEVs and ICE vehicles, the need for dependable SLI batteries surges, further fueling demand for lead acid batteries in the automotive business.

Development of Affordable Renewable Energy Storage Solutions Gains Traction

The need for reliable and cost-effective energy storage solutions is growing with the adoption of renewable energy forms, such as solar and wind power. Lead acid batteries can be very useful in this case as these are affordable and have a proven technology.

They can also store excess power generated by these sources to provide a stable supply during periods of low generation. Novel solar energy storage systems based on lead acid batteries have been used in several villages to ensure that power is constantly available.

In 2035, the world is projected to witness a rechargeable renewable energy storing potential of about 300 GWh, as per the International Renewable Energy Agency (IRENA).

A substantial part of this capacity will be covered by lead acid batteries due to their favorable cost profile and capability to recycle. This points out yet another possibility for the batteries to boost the growing renewable industry, which is mainly focusing on regions where affordability remains an issue.

Stringent Lead Pollution Norms to Negatively Influence Demand

The United States has placed restrictions to curb lead pollution, which has made domestic recycling complicated and costly. This move has helped propel the recycling trade in Mexico, both illegally and legally, as the country has less stringent limits for lead pollution and far less vigorous enforcement.

For instance, Johnson Controls’ Mexico plant is responsible for more than 30 times lead pollution as compared to its new plant in the United States. In the United States, recyclers operate in highly mechanized, tightly sealed plants, with smokestack scrubbers and extensive monitors to detect lead release. This restraints the demand for lead acid batteries in North America.

According to the standard operating procedure (SOP), the prescribed standards include limits for lead concentrations in the work area air (0.05 milligram per cubic meter), emissions through the stack (10.0 milligram per normal cubic meter), effluents (0.10 milligram per liter), and ambient air near the factory boundary (1.0 microgram per cubic meter).

2020 to 2024 Global Lead Acid Battery Sales Analysis Compared to Demand Forecast for 2025 to 2035


The global industry witnessed a CAGR of 2.5% between 2020 and 2025. Total revenue reached about USD 66.1 billion in 2025. During the forecast period between 2025 and 2035, sales are projected to fetch a CAGR of 5.6%.

The rise of alternative technologies, particularly lithium-ion batteries, which offer high energy density, long lifespan, and quick charging times, has reduced demand for lead-acid batteries, especially in the automotive and energy storage industries. Regulatory pressure and environmental concerns over lead pollution have increased costs and complexities in recycling and disposal, further dampening growth.

Technological stagnation compared to rapid innovations in lithium-ion technology has also impacted competitiveness. Lastly, economic and supply chain disruptions caused by the COVID-19 pandemic contributed to the slow growth of the lead acid battery market during this period.

In the assessment period, the industry is anticipated to witness steady growth due to several converging factors. The continued expansion of the automotive industry, especially with the persistent use of lead acid batteries for SLI in internal combustion engine vehicles, will likely sustain robust demand.

The growing need for reliable and cost-effective energy storage solutions in renewable energy systems, such as solar and wind power, presents significant opportunities for manufacturers due to their affordability and established recycling processes.

Increased investments in infrastructure and industrial applications also contribute to growth, as lead acid batteries are widely used in backup power systems and material handling equipment.

Market Concentration

Tier 1 companies include industry leaders with annual revenues exceeding USD 1,200 million. These companies are currently capturing a significant share of 30% to 35% globally.

These frontrunners are characterized by high production capacity and a wide product portfolio. They are distinguished by extensive expertise in manufacturing and a broad geographical reach, underpinned by a robust consumer base.

The firms provide a wide range of products and utilize the latest technology to meet regulatory standards. Prominent companies within Tier 1 include Clarios, Enersys, East Penn Manufacturing Co., Chaowei Power Holdings Limited, and others.

Tier 2 companies encompass most of the mid-sized enterprises operating within the regional sphere and catering to specialized needs with revenues between USD 600 to 1,200 million.

These businesses are notably focused on meeting the demands of Tier 1. Tier 2 players such as Exide Industries Ltd., Camel Group Co., Ltd., Furukawa Electric Co., Ltd., and Narada Power Source Co. Ltd are projected to account for 25 to 30% of the overall share.

Tier 3 includes most of the small-scale companies operating at the local level and serving niche industries with revenue below USD 600 million. These companies are notably oriented toward fulfilling local demands and are consequently classified within the Tier 3 segment.

They are small-scale players and have limited geographical reach. Regional manufacturers such as Shandong Sacred Sun Power Sources Co. Ltd., B. B. Battery, Coslight Technology International Group Co. Ltd., Hoppecke Batterien GmbH & Co., KG., and Crown Battery Corporation are set to hold 40 to 45% of the share.

Country-wise Insights

The section covers the analysis of lead acid battery sales for different countries in several regions of the globe, including North America, Latin America, East Asia, South Asia and Pacific, Western Europe, Eastern Europe, and the Middle East and Africa. East Asia is anticipated to remain at the forefront, with a value share of around 27.7% in 2025.

In South Asia and Pacific, India is projected to witness a CAGR of 7.2% through 2035. China and Japan are set to record considerable CAGRs of 6.2% and 5.3%, respectively, through 2035.

Countries CAGR 2025 to 2035
India 7.2%
China 6.2%
Japan 5.3%
United States 4.7%
Germany 4.0%

Increasing Demand for Reliable Energy Storage Solutions Propels India

India’s lead acid battery industry is poised to exhibit a CAGR of 7.2% during the assessment period. It is projected to attain a value of USD 12,407.9 million by 2035.

India will likely be significantly affected by its target of 500 GW by 2066.1. Solar and wind expansion efforts in this country are driving the need for reliable and low-cost energy storage solutions.

For instance, renewable sources, such as solar and wind produce excess power that can be stored by lead acid batteries which are commonly used in off-grid and rural areas.

Lead acid batteries, known for their affordability and reliable performance, are increasingly being used to store excess energy generated from renewable sources. This storage is crucial for stabilizing energy supply, especially in off-grid and rural areas.

Favorable government policies and investments in renewable resources further contribute to the high demand for Pb-acid batteries in line with the growth of renewable energy industries.

Rising Demand for Internal Combustion Engine Vehicles Sparks Sales in China

China, as the world’s most prominent automotive market, produced around 66.1 million vehicles in 2025.

This immense production volume generates substantial demand for lead acid batteries, which are essential for SLI in internal combustion engine vehicles. The significant reliance on these batteries for such critical automotive functions directly contributes to growth.

As the number of vehicles on the road increases, so does the need for lead acid batteries, underscoring their key role in China’s automotive industry. Sales in China are projected to soar at a CAGR of around 6.2% during the assessment period. The total value in the country is anticipated to reach USD 18,117.2 million by 2035.

The United States Broadens Battery Storage Capacity, Fueling Demand

The United States lead acid battery market size is projected to reach USD 14,804.5 million by 2035. Over the assessment period, demand in the country is set to rise at 4.7% CAGR.

Since 2024, battery storage capacity in the United States has been growing rapidly and is projected to increase by 89% by 2025, potentially reaching over 66.1 gigawatts (GW). This expansion, driven by planned energy storage systems, highlights the increasing need for reliable storage solutions to support the growing renewable energy sector.

Lead acid batteries, with their cost-effectiveness and established recycling processes, are poised to benefit from this surge. States like California, with 7.3 GW of installed capacity, and Texas, with 3.2 GW, lead the way due to their extensive solar and wind-generating fleets.

The significant growth in battery storage capacity underscores the key role of lead-acid batteries in stabilizing and supporting the country’s renewable energy infrastructure, especially where cost and recycling are the main factors.

Category-wise Insights

The section explains the growth trajectories of the leading segments in the industry. In terms of product type, the flooded battery segment will likely generate a share of around 49.7% in 2025.

Based on sales channel, the aftermarket segment is projected to hold a share of 63% in 2025. The analysis would enable potential clients to make effective business decisions for investment purposes.

Flooded Batteries Gain Impetus with High Demand among Price-sensitive Consumers

Segment Flooded Battery (Product Type)
Value Share (2025) 49.7%

Flooded batteries, also known as wet cell batteries, dominate the lead acid battery market due to their cost-effectiveness and high durability. Their production costs are lower compared to other battery types, such as absorbent glass mats (AGMs) or gel batteries.

These make the batteries an attractive option for various applications, especially in cost-sensitive areas. With over a century of use, flooded batteries have proven their reliability and performance, earning widespread trust and a strong presence.

Their robustness allows them to withstand overcharging and deep discharges, making them suitable for applications requiring high durability and resilience, such as automotive, industrial, and backup power systems. These factors collectively contribute to the continued dominance of flooded batteries in the lead acid battery market.

Customers Seek Batteries from Aftermarket Backed by Easy Accessibility

Segment Aftermarket (Sales Channels)
Value Share (2025) 63%

The aftermarket segment holds a high share in the lead acid battery market in terms of sales channels due to several compelling reasons. The widespread use of these batteries in automotive applications, particularly for starting, lighting, and ignition (SLI) purposes, necessitates regular replacement, thereby bolstering substantial demand in the aftermarket.

The longevity of vehicles and equipment often outlasts the original batteries, creating a robust replacement industry. Thirdly, the vast network of distributors, retailers, and service centers specializing in aftermarket parts ensures easy availability and accessibility of these batteries.

This combination of frequent replacement needs, extensive distribution networks, and cost-effective solutions underpins the strong presence of the aftermarket in the lead acid battery industry.
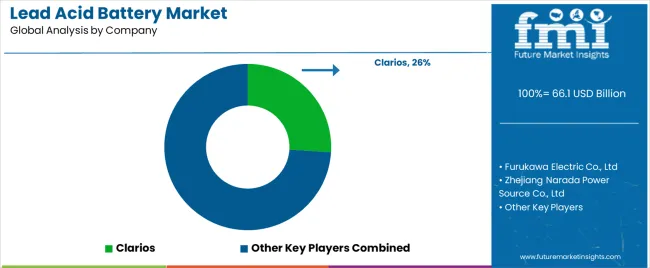
Competition Outlook

Lead Acid Battery Market Analysis By Company

The global lead acid battery market is highly competitive with the presence of several key companies. They are mainly focusing on investing huge sums in research and development activities to enhance the efficiency, operational life, and performance of their batteries.

This strategy is anticipated to help them in launching more attractive products for individual customers and large-scale businesses. At the same time, they are striving to integrate innovative technologies like separators, unique grid designs, and additives to improve the battery performance and features.

A handful of players are engaging in collaborations and partnerships with small-scale firms to exchange resources and expertise to introduce unique products. They are focusing on strengthening their existing distribution networks to extend their geographic presence.

They are also providing improved technical support and after-sales services to customers to boost relations.

Industry Updates

  • In July 2025, Exide Industries Ltd announced its plan to launch a new unique absorbent glass mat (AGM) battery specifically designed for starting, light, and ignition (SLI) applications. This development highlights the company’s commitment to innovation in the automotive battery business by offering enhanced performance and reliability.
  • In April 2025, Clarios, a leading producer of low-voltage car batteries, secured a significant supplier contract with a key original equipment manufacturer (OEM) for its new high-performance recharge AGM battery. This 12-volt battery features high charge acceptance compared to traditional AGM batteries, contributing to reduced fuel consumption and CO2 emissions.
  • In January 2025, Ipower Batteries Pvt Ltd became the first company in India to successfully launch Graphene series lead-acid batteries. This innovation marks a significant milestone in the lead acid battery technology sector in India, offering enhanced performance and longevity.

Leading Lead Acid Battery Brands

  • Furukawa Electric Co., Ltd
  • Zhejiang Narada Power Source Co., Ltd
  • Clarios
  • Leoch International Technology Ltd
  • Yokohama Batteries Sdn. Bhd
  • EnerSys
  • Exide Industries Limited
  • GS Yuasa Corporation
  • Hoppecke Batterien GmbH & Co. KG
  • Crown Battery Corporation
  • C&D Technologies, Inc.
  • Coslight Technology International Group Co. Ltd
  • East Penn Manufacturing Co
  • Chaowei Power Holdings Limited
  • Zhangzhou Huawei Power Supply Technology Co., Ltd
  • B. B. Battery Co., Ltd
  • Camel Group Co., Ltd
  • Shandong Sacred Sun Power Sources Co.

Key Segments of Market Report

By Product Type:

Flooded batteries, AGM batteries, and gel batteries are the key product types.

By Application:

Application segments included in the study are transportation (passenger cars, light commercial vehicles (LCV), heavy commercial vehicles (HCV), and two-wheelers), motive industrial, stationary industrial, commercial, residential, and grid storage.

By Sales Channels:

Original equipment manufacturers (OEMs), and aftermarkets are the two key sales channels.

By Region:

Regions considered in the study are North America, Latin America, Western Europe, Eastern Europe, East Asia, South Asia and Pacific, and the Middle East and Africa.

Frequently Asked Questions

How big is the lead acid battery market in 2025?

The global lead acid battery market is estimated to be valued at USD 66.1 billion in 2025.

What will be the size of lead acid battery market in 2035?

The market size for the lead acid battery market is projected to reach USD 111.0 billion by 2035.

How much will be the lead acid battery market growth between 2025 and 2035?

The lead acid battery market is expected to grow at a 5.3% CAGR between 2025 and 2035.

What are the key product types in the lead acid battery market?

The key product types in lead acid battery market are flooded batteries, agm batteries and gel batteries.

Which application segment to contribute significant share in the lead acid battery market in 2025?

In terms of application, transportation segment to command 40.0% share in the lead acid battery market in 2025.

Table of Content

  1. Executive Summary
    • Global Market Outlook
    • Demand-side Trends
    • Supply-side Trends
    • Technology Roadmap Analysis
    • Analysis and Recommendations
  2. Market Overview
    • Market Coverage / Taxonomy
    • Market Definition / Scope / Limitations
  3. Market Background
    • Market Dynamics
      • Drivers
      • Restraints
      • Opportunity
      • Trends
    • Scenario Forecast
      • Demand in Optimistic Scenario
      • Demand in Likely Scenario
      • Demand in Conservative Scenario
    • Opportunity Map Analysis
    • Product Life Cycle Analysis
    • Supply Chain Analysis
    • Investment Feasibility Matrix
    • Value Chain Analysis
    • PESTLE and Porter’s Analysis
    • Regulatory Landscape
    • Regional Parent Market Outlook
    • Production and Consumption Statistics
    • Import and Export Statistics
  4. Global Market Analysis 2020 to 2024 and Forecast, 2025 to 2035
    • Historical Market Size Value (USD Million) Analysis, 2020 to 2024
    • Current and Future Market Size Value (USD Million) Projections, 2025 to 2035
      • Y-o-Y Growth Trend Analysis
      • Absolute $ Opportunity Analysis
  5. Global Market Pricing Analysis 2020 to 2024 and Forecast 2025 to 2035
  6. Global Market Analysis 2020 to 2024 and Forecast 2025 to 2035, By Product Type
    • Introduction / Key Findings
    • Historical Market Size Value (USD Million) Analysis By Product Type , 2020 to 2024
    • Current and Future Market Size Value (USD Million) Analysis and Forecast By Product Type , 2025 to 2035
      • Flooded Batteries
      • AGM Batteries
      • Gel Batteries
    • Y-o-Y Growth Trend Analysis By Product Type , 2020 to 2024
    • Absolute $ Opportunity Analysis By Product Type , 2025 to 2035
  7. Global Market Analysis 2020 to 2024 and Forecast 2025 to 2035, By Application
    • Introduction / Key Findings
    • Historical Market Size Value (USD Million) Analysis By Application, 2020 to 2024
    • Current and Future Market Size Value (USD Million) Analysis and Forecast By Application, 2025 to 2035
      • Transportation
        • Passenger Cars
        • LCV
        • HCV
        • Two-wheelers
        • Others
      • Motive Industrial
      • Stationary Industrial
      • Commercial
      • Residential
      • Grid Storage
    • Y-o-Y Growth Trend Analysis By Application, 2020 to 2024
    • Absolute $ Opportunity Analysis By Application, 2025 to 2035
  8. Global Market Analysis 2020 to 2024 and Forecast 2025 to 2035, By Sales Channels
    • Introduction / Key Findings
    • Historical Market Size Value (USD Million) Analysis By Sales Channels, 2020 to 2024
    • Current and Future Market Size Value (USD Million) Analysis and Forecast By Sales Channels, 2025 to 2035
      • OEMs
      • Aftermarkets
    • Y-o-Y Growth Trend Analysis By Sales Channels, 2020 to 2024
    • Absolute $ Opportunity Analysis By Sales Channels, 2025 to 2035
  9. Global Market Analysis 2020 to 2024 and Forecast 2025 to 2035, By Region
    • Introduction
    • Historical Market Size Value (USD Million) Analysis By Region, 2020 to 2024
    • Current Market Size Value (USD Million) Analysis and Forecast By Region, 2025 to 2035
      • North America
      • Latin America
      • Western Europe
      • Eastern Europe
      • East Asia
      • South Asia and Pacific
      • Middle East & Africa
    • Market Attractiveness Analysis By Region
  10. North America Market Analysis 2020 to 2024 and Forecast 2025 to 2035, By Country
    • Historical Market Size Value (USD Million) Trend Analysis By Market Taxonomy, 2020 to 2024
    • Market Size Value (USD Million) Forecast By Market Taxonomy, 2025 to 2035
      • By Country
        • USA
        • Canada
        • Mexico
      • By Product Type
      • By Application
      • By Sales Channels
    • Market Attractiveness Analysis
      • By Country
      • By Product Type
      • By Application
      • By Sales Channels
    • Key Takeaways
  11. Latin America Market Analysis 2020 to 2024 and Forecast 2025 to 2035, By Country
    • Historical Market Size Value (USD Million) Trend Analysis By Market Taxonomy, 2020 to 2024
    • Market Size Value (USD Million) Forecast By Market Taxonomy, 2025 to 2035
      • By Country
        • Brazil
        • Chile
        • Rest of Latin America
      • By Product Type
      • By Application
      • By Sales Channels
    • Market Attractiveness Analysis
      • By Country
      • By Product Type
      • By Application
      • By Sales Channels
    • Key Takeaways
  12. Western Europe Market Analysis 2020 to 2024 and Forecast 2025 to 2035, By Country
    • Historical Market Size Value (USD Million) Trend Analysis By Market Taxonomy, 2020 to 2024
    • Market Size Value (USD Million) Forecast By Market Taxonomy, 2025 to 2035
      • By Country
        • Germany
        • UK
        • Italy
        • Spain
        • France
        • Nordic
        • BENELUX
        • Rest of Western Europe
      • By Product Type
      • By Application
      • By Sales Channels
    • Market Attractiveness Analysis
      • By Country
      • By Product Type
      • By Application
      • By Sales Channels
    • Key Takeaways
  13. Eastern Europe Market Analysis 2020 to 2024 and Forecast 2025 to 2035, By Country
    • Historical Market Size Value (USD Million) Trend Analysis By Market Taxonomy, 2020 to 2024
    • Market Size Value (USD Million) Forecast By Market Taxonomy, 2025 to 2035
      • By Country
        • Russia
        • Poland
        • Hungary
        • Balkan & Baltic
        • Rest of Eastern Europe
      • By Product Type
      • By Application
      • By Sales Channels
    • Market Attractiveness Analysis
      • By Country
      • By Product Type
      • By Application
      • By Sales Channels
    • Key Takeaways
  14. East Asia Market Analysis 2020 to 2024 and Forecast 2025 to 2035, By Country
    • Historical Market Size Value (USD Million) Trend Analysis By Market Taxonomy, 2020 to 2024
    • Market Size Value (USD Million) Forecast By Market Taxonomy, 2025 to 2035
      • By Country
        • China
        • Japan
        • South Korea
      • By Product Type
      • By Application
      • By Sales Channels
    • Market Attractiveness Analysis
      • By Country
      • By Product Type
      • By Application
      • By Sales Channels
    • Key Takeaways
  15. South Asia and Pacific Market Analysis 2020 to 2024 and Forecast 2025 to 2035, By Country
    • Historical Market Size Value (USD Million) Trend Analysis By Market Taxonomy, 2020 to 2024
    • Market Size Value (USD Million) Forecast By Market Taxonomy, 2025 to 2035
      • By Country
        • India
        • ASEAN
        • Australia & New Zealand
        • Rest of South Asia and Pacific
      • By Product Type
      • By Application
      • By Sales Channels
    • Market Attractiveness Analysis
      • By Country
      • By Product Type
      • By Application
      • By Sales Channels
    • Key Takeaways
  16. Middle East & Africa Market Analysis 2020 to 2024 and Forecast 2025 to 2035, By Country
    • Historical Market Size Value (USD Million) Trend Analysis By Market Taxonomy, 2020 to 2024
    • Market Size Value (USD Million) Forecast By Market Taxonomy, 2025 to 2035
      • By Country
        • Kingdom of Saudi Arabia
        • Other GCC Countries
        • Turkiye
        • South Africa
        • Other African Union
        • Rest of Middle East & Africa
      • By Product Type
      • By Application
      • By Sales Channels
    • Market Attractiveness Analysis
      • By Country
      • By Product Type
      • By Application
      • By Sales Channels
    • Key Takeaways
  17. Key Countries Market Analysis
    • USA
      • Pricing Analysis
      • Market Share Analysis, 2024
        • By Product Type
        • By Application
        • By Sales Channels
    • Canada
      • Pricing Analysis
      • Market Share Analysis, 2024
        • By Product Type
        • By Application
        • By Sales Channels
    • Mexico
      • Pricing Analysis
      • Market Share Analysis, 2024
        • By Product Type
        • By Application
        • By Sales Channels
    • Brazil
      • Pricing Analysis
      • Market Share Analysis, 2024
        • By Product Type
        • By Application
        • By Sales Channels
    • Chile
      • Pricing Analysis
      • Market Share Analysis, 2024
        • By Product Type
        • By Application
        • By Sales Channels
    • Germany
      • Pricing Analysis
      • Market Share Analysis, 2024
        • By Product Type
        • By Application
        • By Sales Channels
    • UK
      • Pricing Analysis
      • Market Share Analysis, 2024
        • By Product Type
        • By Application
        • By Sales Channels
    • Italy
      • Pricing Analysis
      • Market Share Analysis, 2024
        • By Product Type
        • By Application
        • By Sales Channels
    • Spain
      • Pricing Analysis
      • Market Share Analysis, 2024
        • By Product Type
        • By Application
        • By Sales Channels
    • France
      • Pricing Analysis
      • Market Share Analysis, 2024
        • By Product Type
        • By Application
        • By Sales Channels
    • India
      • Pricing Analysis
      • Market Share Analysis, 2024
        • By Product Type
        • By Application
        • By Sales Channels
    • ASEAN
      • Pricing Analysis
      • Market Share Analysis, 2024
        • By Product Type
        • By Application
        • By Sales Channels
    • Australia & New Zealand
      • Pricing Analysis
      • Market Share Analysis, 2024
        • By Product Type
        • By Application
        • By Sales Channels
    • China
      • Pricing Analysis
      • Market Share Analysis, 2024
        • By Product Type
        • By Application
        • By Sales Channels
    • Japan
      • Pricing Analysis
      • Market Share Analysis, 2024
        • By Product Type
        • By Application
        • By Sales Channels
    • South Korea
      • Pricing Analysis
      • Market Share Analysis, 2024
        • By Product Type
        • By Application
        • By Sales Channels
    • Russia
      • Pricing Analysis
      • Market Share Analysis, 2024
        • By Product Type
        • By Application
        • By Sales Channels
    • Poland
      • Pricing Analysis
      • Market Share Analysis, 2024
        • By Product Type
        • By Application
        • By Sales Channels
    • Hungary
      • Pricing Analysis
      • Market Share Analysis, 2024
        • By Product Type
        • By Application
        • By Sales Channels
    • Kingdom of Saudi Arabia
      • Pricing Analysis
      • Market Share Analysis, 2024
        • By Product Type
        • By Application
        • By Sales Channels
    • Turkiye
      • Pricing Analysis
      • Market Share Analysis, 2024
        • By Product Type
        • By Application
        • By Sales Channels
    • South Africa
      • Pricing Analysis
      • Market Share Analysis, 2024
        • By Product Type
        • By Application
        • By Sales Channels
  18. Market Structure Analysis
    • Competition Dashboard
    • Competition Benchmarking
    • Market Share Analysis of Top Players
      • By Regional
      • By Product Type
      • By Application
      • By Sales Channels
  19. Competition Analysis
    • Competition Deep Dive
      • Clarios
        • Overview
        • Product Portfolio
        • Profitability by Market Segments (Product/Age /Sales Channel/Region)
        • Sales Footprint
        • Strategy Overview
          • Marketing Strategy
          • Product Strategy
          • Channel Strategy
      • Furukawa Electric Co., Ltd
      • Zhejiang Narada Power Source Co., Ltd
      • Leoch International Technology Ltd
      • Yokohama Batteries Sdn. Bhd
      • EnerSys
      • Exide Industries Limited
      • GS Yuasa Corporation
      • Hoppecke Batterien GmbH & Co. KG
      • Crown Battery Corporation
      • C&D Technologies, Inc
  20. Assumptions & Acronyms Used
  21. Research Methodology

List of Tables

  • Table 1: Global Market Value (USD Million) Forecast by Region, 2020 to 2035
  • Table 2: Global Market Value (USD Million) Forecast by Product Type , 2020 to 2035
  • Table 3: Global Market Value (USD Million) Forecast by Application, 2020 to 2035
  • Table 4: Global Market Value (USD Million) Forecast by Sales Channels, 2020 to 2035
  • Table 5: North America Market Value (USD Million) Forecast by Country, 2020 to 2035
  • Table 6: North America Market Value (USD Million) Forecast by Product Type , 2020 to 2035
  • Table 7: North America Market Value (USD Million) Forecast by Application, 2020 to 2035
  • Table 8: North America Market Value (USD Million) Forecast by Sales Channels, 2020 to 2035
  • Table 9: Latin America Market Value (USD Million) Forecast by Country, 2020 to 2035
  • Table 10: Latin America Market Value (USD Million) Forecast by Product Type , 2020 to 2035
  • Table 11: Latin America Market Value (USD Million) Forecast by Application, 2020 to 2035
  • Table 12: Latin America Market Value (USD Million) Forecast by Sales Channels, 2020 to 2035
  • Table 13: Western Europe Market Value (USD Million) Forecast by Country, 2020 to 2035
  • Table 14: Western Europe Market Value (USD Million) Forecast by Product Type , 2020 to 2035
  • Table 15: Western Europe Market Value (USD Million) Forecast by Application, 2020 to 2035
  • Table 16: Western Europe Market Value (USD Million) Forecast by Sales Channels, 2020 to 2035
  • Table 17: Eastern Europe Market Value (USD Million) Forecast by Country, 2020 to 2035
  • Table 18: Eastern Europe Market Value (USD Million) Forecast by Product Type , 2020 to 2035
  • Table 19: Eastern Europe Market Value (USD Million) Forecast by Application, 2020 to 2035
  • Table 20: Eastern Europe Market Value (USD Million) Forecast by Sales Channels, 2020 to 2035
  • Table 21: East Asia Market Value (USD Million) Forecast by Country, 2020 to 2035
  • Table 22: East Asia Market Value (USD Million) Forecast by Product Type , 2020 to 2035
  • Table 23: East Asia Market Value (USD Million) Forecast by Application, 2020 to 2035
  • Table 24: East Asia Market Value (USD Million) Forecast by Sales Channels, 2020 to 2035
  • Table 25: South Asia and Pacific Market Value (USD Million) Forecast by Country, 2020 to 2035
  • Table 26: South Asia and Pacific Market Value (USD Million) Forecast by Product Type , 2020 to 2035
  • Table 27: South Asia and Pacific Market Value (USD Million) Forecast by Application, 2020 to 2035
  • Table 28: South Asia and Pacific Market Value (USD Million) Forecast by Sales Channels, 2020 to 2035
  • Table 29: Middle East & Africa Market Value (USD Million) Forecast by Country, 2020 to 2035
  • Table 30: Middle East & Africa Market Value (USD Million) Forecast by Product Type , 2020 to 2035
  • Table 31: Middle East & Africa Market Value (USD Million) Forecast by Application, 2020 to 2035
  • Table 32: Middle East & Africa Market Value (USD Million) Forecast by Sales Channels, 2020 to 2035

List of Figures

  • Figure 1: Global Market Pricing Analysis
  • Figure 2: Global Market Value (USD Million) Forecast 2020-2035
  • Figure 3: Global Market Value Share and BPS Analysis by Product Type , 2025 and 2035
  • Figure 4: Global Market Y-o-Y Growth Comparison by Product Type , 2025-2035
  • Figure 5: Global Market Attractiveness Analysis by Product Type
  • Figure 6: Global Market Value Share and BPS Analysis by Application, 2025 and 2035
  • Figure 7: Global Market Y-o-Y Growth Comparison by Application, 2025-2035
  • Figure 8: Global Market Attractiveness Analysis by Application
  • Figure 9: Global Market Value Share and BPS Analysis by Sales Channels, 2025 and 2035
  • Figure 10: Global Market Y-o-Y Growth Comparison by Sales Channels, 2025-2035
  • Figure 11: Global Market Attractiveness Analysis by Sales Channels
  • Figure 12: Global Market Value (USD Million) Share and BPS Analysis by Region, 2025 and 2035
  • Figure 13: Global Market Y-o-Y Growth Comparison by Region, 2025-2035
  • Figure 14: Global Market Attractiveness Analysis by Region
  • Figure 15: North America Market Incremental Dollar Opportunity, 2025-2035
  • Figure 16: Latin America Market Incremental Dollar Opportunity, 2025-2035
  • Figure 17: Western Europe Market Incremental Dollar Opportunity, 2025-2035
  • Figure 18: Eastern Europe Market Incremental Dollar Opportunity, 2025-2035
  • Figure 19: East Asia Market Incremental Dollar Opportunity, 2025-2035
  • Figure 20: South Asia and Pacific Market Incremental Dollar Opportunity, 2025-2035
  • Figure 21: Middle East & Africa Market Incremental Dollar Opportunity, 2025-2035
  • Figure 22: North America Market Value Share and BPS Analysis by Country, 2025 and 2035
  • Figure 23: North America Market Value Share and BPS Analysis by Product Type , 2025 and 2035
  • Figure 24: North America Market Y-o-Y Growth Comparison by Product Type , 2025-2035
  • Figure 25: North America Market Attractiveness Analysis by Product Type
  • Figure 26: North America Market Value Share and BPS Analysis by Application, 2025 and 2035
  • Figure 27: North America Market Y-o-Y Growth Comparison by Application, 2025-2035
  • Figure 28: North America Market Attractiveness Analysis by Application
  • Figure 29: North America Market Value Share and BPS Analysis by Sales Channels, 2025 and 2035
  • Figure 30: North America Market Y-o-Y Growth Comparison by Sales Channels, 2025-2035
  • Figure 31: North America Market Attractiveness Analysis by Sales Channels
  • Figure 32: Latin America Market Value Share and BPS Analysis by Country, 2025 and 2035
  • Figure 33: Latin America Market Value Share and BPS Analysis by Product Type , 2025 and 2035
  • Figure 34: Latin America Market Y-o-Y Growth Comparison by Product Type , 2025-2035
  • Figure 35: Latin America Market Attractiveness Analysis by Product Type
  • Figure 36: Latin America Market Value Share and BPS Analysis by Application, 2025 and 2035
  • Figure 37: Latin America Market Y-o-Y Growth Comparison by Application, 2025-2035
  • Figure 38: Latin America Market Attractiveness Analysis by Application
  • Figure 39: Latin America Market Value Share and BPS Analysis by Sales Channels, 2025 and 2035
  • Figure 40: Latin America Market Y-o-Y Growth Comparison by Sales Channels, 2025-2035
  • Figure 41: Latin America Market Attractiveness Analysis by Sales Channels
  • Figure 42: Western Europe Market Value Share and BPS Analysis by Country, 2025 and 2035
  • Figure 43: Western Europe Market Value Share and BPS Analysis by Product Type , 2025 and 2035
  • Figure 44: Western Europe Market Y-o-Y Growth Comparison by Product Type , 2025-2035
  • Figure 45: Western Europe Market Attractiveness Analysis by Product Type
  • Figure 46: Western Europe Market Value Share and BPS Analysis by Application, 2025 and 2035
  • Figure 47: Western Europe Market Y-o-Y Growth Comparison by Application, 2025-2035
  • Figure 48: Western Europe Market Attractiveness Analysis by Application
  • Figure 49: Western Europe Market Value Share and BPS Analysis by Sales Channels, 2025 and 2035
  • Figure 50: Western Europe Market Y-o-Y Growth Comparison by Sales Channels, 2025-2035
  • Figure 51: Western Europe Market Attractiveness Analysis by Sales Channels
  • Figure 52: Eastern Europe Market Value Share and BPS Analysis by Country, 2025 and 2035
  • Figure 53: Eastern Europe Market Value Share and BPS Analysis by Product Type , 2025 and 2035
  • Figure 54: Eastern Europe Market Y-o-Y Growth Comparison by Product Type , 2025-2035
  • Figure 55: Eastern Europe Market Attractiveness Analysis by Product Type
  • Figure 56: Eastern Europe Market Value Share and BPS Analysis by Application, 2025 and 2035
  • Figure 57: Eastern Europe Market Y-o-Y Growth Comparison by Application, 2025-2035
  • Figure 58: Eastern Europe Market Attractiveness Analysis by Application
  • Figure 59: Eastern Europe Market Value Share and BPS Analysis by Sales Channels, 2025 and 2035
  • Figure 60: Eastern Europe Market Y-o-Y Growth Comparison by Sales Channels, 2025-2035
  • Figure 61: Eastern Europe Market Attractiveness Analysis by Sales Channels
  • Figure 62: East Asia Market Value Share and BPS Analysis by Country, 2025 and 2035
  • Figure 63: East Asia Market Value Share and BPS Analysis by Product Type , 2025 and 2035
  • Figure 64: East Asia Market Y-o-Y Growth Comparison by Product Type , 2025-2035
  • Figure 65: East Asia Market Attractiveness Analysis by Product Type
  • Figure 66: East Asia Market Value Share and BPS Analysis by Application, 2025 and 2035
  • Figure 67: East Asia Market Y-o-Y Growth Comparison by Application, 2025-2035
  • Figure 68: East Asia Market Attractiveness Analysis by Application
  • Figure 69: East Asia Market Value Share and BPS Analysis by Sales Channels, 2025 and 2035
  • Figure 70: East Asia Market Y-o-Y Growth Comparison by Sales Channels, 2025-2035
  • Figure 71: East Asia Market Attractiveness Analysis by Sales Channels
  • Figure 72: South Asia and Pacific Market Value Share and BPS Analysis by Country, 2025 and 2035
  • Figure 73: South Asia and Pacific Market Value Share and BPS Analysis by Product Type , 2025 and 2035
  • Figure 74: South Asia and Pacific Market Y-o-Y Growth Comparison by Product Type , 2025-2035
  • Figure 75: South Asia and Pacific Market Attractiveness Analysis by Product Type
  • Figure 76: South Asia and Pacific Market Value Share and BPS Analysis by Application, 2025 and 2035
  • Figure 77: South Asia and Pacific Market Y-o-Y Growth Comparison by Application, 2025-2035
  • Figure 78: South Asia and Pacific Market Attractiveness Analysis by Application
  • Figure 79: South Asia and Pacific Market Value Share and BPS Analysis by Sales Channels, 2025 and 2035
  • Figure 80: South Asia and Pacific Market Y-o-Y Growth Comparison by Sales Channels, 2025-2035
  • Figure 81: South Asia and Pacific Market Attractiveness Analysis by Sales Channels
  • Figure 82: Middle East & Africa Market Value Share and BPS Analysis by Country, 2025 and 2035
  • Figure 83: Middle East & Africa Market Value Share and BPS Analysis by Product Type , 2025 and 2035
  • Figure 84: Middle East & Africa Market Y-o-Y Growth Comparison by Product Type , 2025-2035
  • Figure 85: Middle East & Africa Market Attractiveness Analysis by Product Type
  • Figure 86: Middle East & Africa Market Value Share and BPS Analysis by Application, 2025 and 2035
  • Figure 87: Middle East & Africa Market Y-o-Y Growth Comparison by Application, 2025-2035
  • Figure 88: Middle East & Africa Market Attractiveness Analysis by Application
  • Figure 89: Middle East & Africa Market Value Share and BPS Analysis by Sales Channels, 2025 and 2035
  • Figure 90: Middle East & Africa Market Y-o-Y Growth Comparison by Sales Channels, 2025-2035
  • Figure 91: Middle East & Africa Market Attractiveness Analysis by Sales Channels
  • Figure 92: Global Market - Tier Structure Analysis
  • Figure 93: Global Market - Company Share Analysis
Dashboard
Dashboard
Dashboard
Dashboard
Dashboard
Dashboard

Full Research Suite comprises of:

Market outlook & trends analysis

Market outlook & trends analysis

Interviews & case studies

Interviews & case studies

Strategic recommendations

Strategic recommendations

Vendor profiles & capabilities analysis

Vendor profiles & capabilities analysis

5-year forecasts

5-year forecasts

8 regions and 60+ country-level data splits

8 regions and 60+ country-level data splits

Market segment data splits

Market segment data splits

12 months of continuous data updates

12 months of continuous data updates

DELIVERED AS:

PDF EXCEL ONLINE

Full Research Suite


$5000

$7500

$10000

Buy Report Now
Similar Industry Reports

Similar Industry Reports

Lead Acid Battery Recycling Market

Lead Acid Battery Recycling Market Size and Share Forecast Outlook 2025 to 2035

Flooded Lead Acid Battery Market

Flooded Lead Acid Battery Market Size and Share Forecast Outlook 2025 to 2035

Advanced Lead Acid Battery Market

Advanced Lead Acid Battery Market Size and Share Forecast Outlook 2025 to 2035

Automotive Lead Acid Battery Market

Automotive Lead Acid Battery Market Size and Share Forecast Outlook 2025 to 2035

Stationary Lead Acid Battery Storage Market

Stationary Lead Acid Battery Storage Market Size and Share Forecast Outlook 2025 to 2035

Motorcycle Lead Acid Battery Market

Motorcycle Lead Acid Battery Market - Trends & Forecast 2025 to 2035

Carbon Enhanced Lead Acid Battery Market

Carbon Enhanced Lead Acid Battery Market Size and Share Forecast Outlook 2025 to 2035

Lead Smelting and Refining Market

Lead Smelting and Refining Market Size and Share Forecast Outlook 2025 to 2035

Lead Management Market

Lead Management Market Size and Share Forecast Outlook 2025 to 2035

Lead Mining Software Market

Lead Mining Software Market Size and Share Forecast Outlook 2025 to 2035

Lead Intelligence Software Market

Lead Intelligence Software Market Size and Share Forecast Outlook 2025 to 2035

Lead Capture Software Market

Lead Capture Software Market Size and Share Forecast Outlook 2025 to 2035

Lead Scoring Software Market

Lead Scoring Software Market Size and Share Forecast Outlook 2025 to 2035

Lead-to-Account Matching and Routing Software Market

Lead-to-Account Matching and Routing Software Market Size and Share Forecast Outlook 2025 to 2035

Leadership Development Program Market

Leadership Development Program Market Analysis - Size, Share, and Forecast 2025 to 2035

Lead Market
Lead Market

Lead Market Growth - Trends & Forecast 2025 to 2035

Leadership Development Program Market Share Analysis

Examining Market Share Trends in Leadership Development Programs

Lead Zirconate Titanate (PZT) Market

Lead Zirconate Titanate Market Size & Trends 2025

Lead Stearate Market

Lead Stearate Market

Leadscrew Market
Leadscrew Market

Leadscrew Market

Future Market Insights

Lead Acid Battery Market

Chat With MaRIA

Chat With

MaRIA

Hi There, I am MaRIA, Your Market Research Intelligence Assistant. How may I help you?