3D Cell Culture Market Size and Share Forecast Outlook 2025 to 2035

The global 3D Cell Culture Market is estimated to be valued at USD 1,494.2 million in 2025 and is projected to reach USD 3,805.7 million by 2035, registering a CAGR of 9.8% over the forecast period.

Quick Stats for 3D Cell Culture Market

  • Industry Value (2025): USD 1,494.2 million
  • Forecast Value (2035): USD 3,805.7 million
  • Forecast CAGR: 9.8%
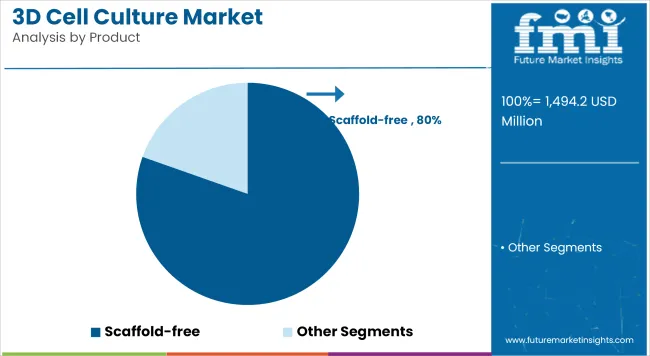
  • Leading Segment in 2025: Scaffold-Based 3D Cell Culture (80.4% share)
  • Key Growth Regions: North America (USA), Europe (Germany, UK), Asia-Pacific (China, Japan)
  • Top Key Players:
    • Thermo Fisher Scientific
    • Corning Incorporated
    • Merck KGaA
    • Lonza Group AG
    • Greiner Bio-One
Metric Value
Industry Size (2025E) USD 1,494.2 million
Industry Value (2035F) USD 3,805.7 million
CAGR (2025 to 2035) 9.8%

The 3D cell culture market has advanced rapidly as the pharmaceutical, biotechnology, and academic sectors have prioritized physiologically relevant in vitro models to improve translational research and reduce late-stage drug attrition.

Traditional two-dimensional cultures have shown limitations in recapitulating the complex cell-cell and cell-matrix interactions critical to disease modeling, driving accelerated adoption of scaffold-based and scaffold-free 3D systems.

Industry investments in organoids, microfluidics, and hydrogel-based technologies have supported higher throughput screening while preserving cellular phenotypes and functionality. Regulatory authorities and funding agencies have underscored the value of predictive 3D models to enhance preclinical workflows and refine animal study requirements.
Analyzing 3D Cell Culture Market by Top Investment Segments

Scaffold-Based 3D Cell Culture Dominates Adoption Due to Versatile Materials, High Compatibility, and Robust Validation Across Applications

3d Cell Culture Market Analysis By Product

Scaffold-Based 3D Cell Culture

A revenue share of 80.4% has been attributed to scaffold-based 3D cell culture systems, underscoring their widespread adoption across preclinical and translational workflows. The growth of this segment has been driven by the availability of a diverse range of scaffold materials, including hydrogels, polymer matrices, and biocompatible composites that support cell proliferation, differentiation, and extracellular matrix formation.

Researchers have preferred scaffold-based platforms for their reproducibility, scalability, and ease of integration into automated screening pipelines. Sustained investments in scaffold innovation have facilitated the development of tissue-mimetic environments critical to oncology, neuroscience, and regenerative studies. Over the forecast years, this segment is expected to maintain strong momentum, propelled by increasing demand for advanced models in immuno-oncology and personalized medicine research.
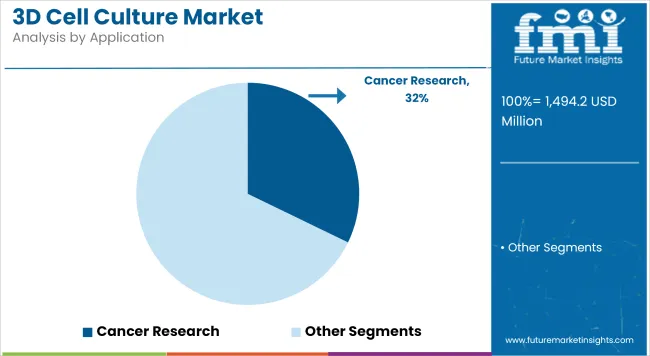
Cancer Research Remains the Leading Application Owing to High Demand for Predictive Tumor Models and Investment in Oncology Pipelines

3d Cell Culture Market Analysis By Application

Cancer Research contributes a revenue share of 32.2% which has been attributed to the urgent need for biologically relevant tumor models that replicate microenvironmental complexity. This segment’s growth has been driven by pharmaceutical and academic efforts to improve predictive accuracy in drug discovery and evaluate combination therapies in vitro.

Scaffold-based and organoid platforms have been widely adopted to study cancer stem cell behavior, metastatic processes, and therapeutic resistance mechanisms. Investments in 3D co-culture systems and tumor-on-a-chip technologies have further reinforced the segment’s leadership. In the coming years, sustained oncology pipeline growth and regulatory encouragement for advanced preclinical models are expected to continue supporting this segment’s prominence.
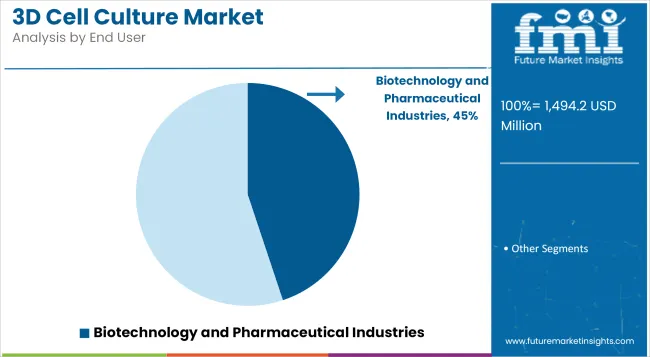
Biotechnology and Pharmaceutical Companies Lead Adoption Due to Robust R&D Investments and the Push for Predictive Drug Development Models

3d Cell Culture Market Analysis By End User

Biotechnology and Pharmaceutical Industries accounts for a revenue share of 44.9% in 2025. The segment’s leadership has been driven by the imperative to improve early-stage screening outcomes, reduce late-stage failures, and accelerate time to market for novel therapeutics.

Companies have prioritized integration of 3D models into discovery and preclinical pipelines to enhance target validation and toxicity assessment. Strategic collaborations with academic institutions and technology developers have further expanded access to cutting-edge biomimetic platforms. Rising R&D expenditure and the growing emphasis on disease-relevant models are expected to sustain adoption in the pharmaceutical sector.

Challenges and Opportunities

Lack of Standard Protocols and Reproducibility Concerns Hinder Large-Scale Adoption.

One of the major challenges hindering the large-scale adoption of 3D cell culture technologies is the lack of standardized protocols and concerns regarding reproducibility. Unlike traditional 2D cell culture methods, which follow well-established procedures, 3D cell culture techniques vary significantly based on the type of model used, including scaffold-based, spheroid, and organoid cultures.

This variability leads to inconsistencies in experimental outcomes, making it difficult for researchers and industries to replicate results across different laboratories. Moreover, differences in cell behavior, media composition, and culture conditions further complicate standardization. Regulatory agencies also face challenges in evaluating the reliability of 3D models for drug testing and personalized medicine. Addressing these concerns requires industry-wide collaboration to develop validated, reproducible, and scalable methodologies.

Growth in Cancer Immunotherapy and Tissue Engineering Is Expanding Use Cases for Organoid And Spheroid Models.

The expanding applications of 3D cell culture in cancer immunotherapy and tissue engineering present significant market opportunities, particularly through the use of organoid and spheroid models. Organoids, which closely mimic in vivo tumor microenvironments, are increasingly being utilized in immuno-oncology research for testing novel cancer therapies, including checkpoint inhibitors and CAR-T cell therapies.

These models enhance the efficiency of drug screening and facilitate personalized treatment approaches. Similarly, spheroids are gaining traction in tissue engineering for regenerative medicine, offering more physiologically relevant cell interactions compared to 2D cultures. The growing emphasis on precision medicine and regenerative therapies, coupled with advancements in bioprinting and microfluidics, further boosts the demand for these 3D models, creating new opportunities for research institutions and biotech firms.

Industry-Specific Highlights

Microfluidics and organ-on-chip technologies are revolutionizing 3D cell culture.

Microfluidics and organ-on-chip technologies are revolutionizing 3D cell culture by enabling the creation of lab-on-chip devices that simulate dynamic physiological conditions. These systems integrate precisely controlled fluidic environments, allowing continuous nutrient supply, waste removal, and mechanical stimuli, closely mimicking in vivo conditions.

This enhances cell viability, functionality, and intercellular interactions, making these models highly relevant for drug screening, disease modeling, and toxicity testing. The ability to monitor cell responses in real-time improves the predictive accuracy of preclinical studies, reducing the reliance on animal models.

Additionally, microfluidic platforms facilitate high-throughput screening, making them valuable for pharmaceutical and biotech industries. As demand for personalized medicine grows, organ-on-chip devices are gaining traction in applications such as cancer research and regenerative medicine.

Emerging Trends

The Integration of 3D Bioprinting with Cell Culture Is Emerging as A Transformative Trend.

The integration of 3D bioprinting with cell culture is emerging as a transformative trend, enabling the fabrication of complex, physiologically relevant tissue models for drug development, regenerative medicine, and disease research. Unlike conventional 3D cell culture methods, bioprinting enables the precise spatial arrangement of cells, biomaterials, and growth factors to mimic the native tissue architecture.

This enhances cell-cell interactions, improves tissue functionality, and facilitates the creation of organoids with greater structural accuracy. In drug discovery, 3D bioprinted tissues are being utilized to assess drug efficacy and toxicity in a human-relevant environment, thereby reducing dependence on animal models. Additionally, advancements in bioinks and printing technologies are accelerating the development of engineered tissues for transplantation, offering significant potential in personalized medicine and tissue engineering.
Country Wise Analysis

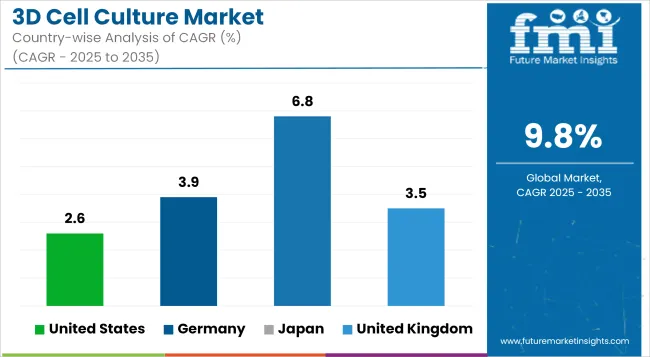
3d Cell Culture Market Cagr Analysis By Country

United States

Market Outlook

The United States dominates the 3D cell culture market, driven by significant investments in biotechnology, pharmaceutical research and development, and advanced research infrastructure. The presence of major market players, extensive funding from the National Institutes of Health (NIH), and increasing adoption of organ-on-a-chip models for drug discovery contribute to market expansion.

The USA FDA’s push for alternative testing models, particularly in reducing reliance on animal studies, is accelerating adoption. Additionally, biopharmaceutical firms and academic institutions are extensively leveraging 3D bioprinting and microfluidics for precision medicine and regenerative therapies. The rising burden of chronic diseases, including cancer and neurological disorders, further fuels demand for physiologically relevant cell culture models, making the USA a key hub for innovation in this sector.

Market Growth Factors

  • High R&D Spending in Life Sciences: Strong funding from both government (e.g., NIH) and private sectors for 3D in vitro models.
  • Widespread Use in Drug Screening & Toxicology: 3D cultures offer better predictability than traditional 2D models.
  • Rapid Adoption of Personalized Medicine and Precision Oncology: Tumor Organoids and Scaffold-Free Systems Support Patient-Specific Studies.
  • Presence of Leading Biotech and Tool Providers: Companies such as Thermo Fisher, Corning, and Lonza dominate the market.
  • Growth in 3D Bioprinting and Organoid Platforms: The USA is a global leader in printing tissue-like structures for research and therapeutic applications.

Market Forecast

Country CAGR (2025 to 2035)
United States 2.6%

Germany

Market Outlook

Germany holds a significant share in the 3D cell culture market, driven by its robust pharmaceutical industry, well-established biotech sector, and strong academic research collaborations. The country’s leadership in regenerative medicine and tissue engineering has positioned it at the forefront of 3D bioprinting and organoid research.

The German government and European Union actively promote alternatives to animal testing, increasing the adoption of 3D culture systems for drug screening and toxicology studies. Moreover, Germany's focus on developing human-relevant models for cancer research and immunotherapy is propelling market growth. With a growing emphasis on personalized medicine and substantial investments in life sciences, the country remains a critical player in the European 3D cell culture landscape.

Market Growth Factors

  • Government Support for Alternative Testing Models: Strong alignment with EU directives promoting in vitro over in vivo studies.
  • Advanced Biotech and Tissue Engineering Ecosystem: Universities and private firms lead in scaffold development and microenvironment research.
  • Increased Demand from the Cosmetics & Chemical Industries: Non-animal testing mandates fuel the use of 3D tissue models.
  • Focus on Standardized, Reproducible Models: Essential for Drug Validation and Regulatory Compliance.
  • Rising Investment in Oncology & Neuroscience Research: Cancer spheroids and brain organoids are gaining traction.

Market Forecast

Country CAGR (2025 to 2035)
Germany 3.9%

Japan

Market Outlook

Japan is a rapidly expanding market for 3D cell culture, driven by advancements in stem cell research, tissue engineering, and regenerative medicine. The country has been a pioneer in induced pluripotent stem cell (iPSC) technology, which is increasingly being integrated with 3D culture models for disease modeling and drug discovery. Japanese pharmaceutical companies are actively investing in organoid and organ-on-chip technologies to enhance drug screening efficiency.

Government initiatives promoting next-generation healthcare solutions, along with collaborations between academia and industry, are boosting the market. Additionally, Japan’s aging population and increasing prevalence of chronic diseases, such as cancer, are fueling demand for more physiologically relevant in vitro models to improve therapeutic research outcomes.

Market Growth Factors

  • Strong Government Investment in Regenerative Medicine: Focus on stem cell-derived 3D models and tissue regeneration.
  • Integration with High-Resolution Imaging Systems: Enhancing analysis of complex 3D cellular structures.
  • Growing Application in Neurodegenerative Disease Studies: Organoids are used to model Parkinson’s, Alzheimer’s, and ALS.
  • Innovations in Scaffold-Free Cultures & Hydrogels: Supporting natural cell behavior and function.
  • Collaborative R&D Ecosystem: Academia-industry partnerships are accelerating innovation and adoption.

Market Forecast

Country CAGR (2025 to 2035)
Japan 6.8%

United Kingdom

Market Outlook

The United Kingdom plays a crucial role in the 3D cell culture market, with a strong emphasis on biotechnology innovation, pharmaceutical research, and government-backed initiatives supporting human-relevant testing models. The UK’s progressive stance on reducing animal testing, driven by the Medicines and Healthcare products Regulatory Agency (MHRA) and regulatory bodies, has spurred the adoption of 3D organoid and spheroid models.

Universities and research institutions are actively collaborating with biotech firms to advance applications in oncology, neurodegenerative diseases, and regenerative medicine. Additionally, significant investments in artificial intelligence (AI)-assisted cell culture analysis and bioprinting technologies are strengthening the market. The UK's focus on translational research and personalized medicine further contributes to its market expansion.

Market Growth Factors

  • Government and Private Sector Funding for Life Sciences: Boosting infrastructure for high-throughput 3D screening platforms.
  • Increased Use in Precision Medicine Programs (e.g., Genomics England): 3D models used in tailoring treatments based on genetic profiles.
  • Ethical Push Away from Animal Testing: 3D human tissue models are increasingly used for preclinical validation.
  • Rising Adoption in Academic Research Labs & CROs: Contract research organizations are offering 3D culture-based services.
  • Growth in Startup Innovation: UK-based startups are innovating in 3D cell scaffolding, matrices, and microfluidics.

Market Forecast

Country CAGR (2025 to 2035)
United Kingdom 3.5%

China

Market Outlook

China is emerging as one of the fastest-growing markets for 3D cell culture, fueled by increasing government funding, rapid pharmaceutical sector growth, and expanding biotechnology research. The country is heavily investing in stem cell research, personalized medicine, and drug discovery, driving the adoption of advanced in vitro models.

With a strong push for biopharmaceutical innovation, Chinese companies and research institutes are exploring applications of 3D culture in cancer therapy, organoid development, and high-throughput drug screening. However, challenges such as regulatory standardization and the high costs of advanced 3D cell culture systems remain. Nonetheless, China’s expanding contract research organization (CRO) network and integration of automation in cell culture techniques are expected to accelerate market growth.

Market Growth Factors

  • Massive Government Investment in Biotech Innovation: Part of China’s broader healthcare and pharma development goals.
  • Expansion of Oncology & Stem Cell Research Infrastructure: 3D cultures help model tumor environments more accurately.
  • Rising Use in Drug Screening by Domestic Pharma Firms: Demand for predictive, human-relevant data to support regulatory approvals.
  • Development of National Research Platforms: Universities and research parks are integrating 3D cell culture into translational medicine.
  • Increased Collaboration with Global Firms: Joint ventures bring advanced 3D culture technologies to China.

Market Forecast

Country CAGR (2025 to 2035)
China 7.7%

Competition Outlook

The competitive landscape has been shaped by companies investing in organoid platforms, synthetic hydrogels, and microfluidic 3D bioreactors. Leading players have formed strategic alliances with research institutions to accelerate validation and application development across oncology and regenerative medicine.

Expansion of product portfolios with ready-to-use kits and custom services has differentiated offerings and driven market penetration. Additionally, investment in training and digital support tools has improved researcher adoption and workflow integration. These activities are expected to sustain competition and propel innovation across the 3D cell culture market in the coming years.

Key Development:

In 2025, PHC Corporation and Cyfuse Biomedical announced a breakthrough in regenerative and cell therapy. Their joint research resulted in a new production technology enabling real-time quality monitoring of 3D cell products, paving the way for commercialization in this innovative field.

In 2024, Bioserve India has launched REPROCELL's advanced stem cell products in India. This move supports innovation in scientific research and drug development, driving advancements in regenerative medicine and therapeutic discovery within the rapidly growing Indian stem cell market.

University of Georgia startup CytoNest Inc. launched its first commercial product, the CytoSurge 3D fiber scaffold, in 2024. This innovative scaffold optimizes cell manufacturing and tissue engineering, with applications spanning cell research, biopharmaceuticals, cell therapeutics, and cultured meat/seafood development. UGA leads USA universities in commercial products from its research

Companies

  • Thermo Fisher Scientific Inc.
  • Merck KGaA
  • Becton, Dickinson and Company
  • Lonza
  • Corning Incorporated
  • Synthecon, Inc.
  • 3D Biotek LLC
  • Nanofiber Solutions, Inc.
  • Greiner Group A
  • Lena Biosciences
  • REPROCELL
  • MicroTissues, Inc.

Key Segments 

By Product:

Scaffold-free and Scaffold-based

By Application:

Drug Discovery, Tissue Regeneration & Regenerative Methods, Cancer Research, Stem Cell Technology and Others.

By End User:

Biotechnology and Pharmaceutical Industries, Hospital Laboratories, Academic Research and Institutes and Contract Research Organizations.

By Region:

North America, Latin America, Western Europe, Eastern Europe, East Asia, South Asia & Pacific, Middle East & Africa

Table of Content

  1. Executive Summary
  2. Industry Introduction, including Taxonomy and Market Definition
  3. Market Trends and Success Factors, including Macro-Economic Factors, Market Dynamics, and Recent Industry Developments
  4. Global Market Demand (Value in USD) and Volume (Units) Analysis 2020 to 2024 and Forecast 2025 to 2035, including Historical Analysis and Future Projections
  5. Global Market - Pricing Analysis
  6. Global Market Analysis 2020 to 2024 and Forecast 2025 to 2035
    • By Product
    • By Application
    • By End User
    • By Region
  7. Global Market Analysis 2020 to 2024 and Forecast 2025 to 2035, By Product
    • Scaffold-free
    • Scaffold-based
  8. Global Market Analysis 2020 to 2024 and Forecast 2025 to 2035, By Application
    • Drug Discovery
    • Tissue Regeneration & Regenerative Methods
    • Cancer Research
    • Stem Cell Technology
    • Others
  9. Global Market Analysis 2020 to 2024 and Forecast 2025 to 2035, By End User
    • Biotechnology and Pharmaceutical Industries
    • Hospital Laboratories
    • Academic Research and Institutes
    • Contract Research Organizations
  10. Global Market Analysis 2020 to 2024 and Forecast 2025 to 2035, By Region
    • North America
    • Latin America
    • Western Europe
    • Eastern Europe
    • South Asia & Pacific
    • East Asia
    • Middle East & Africa
  11. North America Sales Analysis 2020 to 2024 and Forecast 2025 to 2035, by Key Segments and Countries
  12. Latin America Sales Analysis 2020 to 2024 and Forecast 2025 to 2035, by Key Segments and Countries
  13. Western Europe Sales Analysis 2020 to 2024 and Forecast 2025 to 2035, by Key Segments and Countries
  14. Eastern Europe Sales Analysis 2020 to 2024 and Forecast 2025 to 2035, by Key Segments and Countries
  15. South Asia & Pacific Sales Analysis 2020 to 2024 and Forecast 2025 to 2035, by Key Segments and Countries
  16. East Asia Sales Analysis 2020 to 2024 and Forecast 2025 to 2035, by Key Segments and Countries
  17. Middle East and Africa Sales Analysis 2020 to 2024 and Forecast 2025 to 2035, by Key Segments and Countries
  18. Sales Forecast 2025 to 2035 By Product, By Application and by End User for 30 Countries
  19. Competition Outlook, including Market Structure Analysis, Company Share Analysis by Key Players, and Competition Dashboard
  20. Company Profile
    • Thermo Fisher Scientific
    • Corning Incorporated
    • Merck KGaA
    • Lonza Group AG
    • 3D Biotek LLC
    • InSphero AG
    • Greiner Bio-One
    • Mimetas BV
    • CN Bio Innovations
    • Advanced Biomatrix
    • Others

List of Tables

  • Table 1: Global Market Value (USD Million) Forecast by Region, 2020 to 2035
  • Table 2: Global Market Value (USD Million) Forecast by Product, 2020 to 2035
  • Table 3: Global Market Value (USD Million) Forecast by Application, 2020 to 2035
  • Table 4: Global Market Value (USD Million) Forecast by End User, 2020 to 2035
  • Table 5: North America Market Value (USD Million) Forecast by Country, 2020 to 2035
  • Table 6: North America Market Value (USD Million) Forecast by Product, 2020 to 2035
  • Table 7: North America Market Value (USD Million) Forecast by Application, 2020 to 2035
  • Table 8: North America Market Value (USD Million) Forecast by End User, 2020 to 2035
  • Table 9: Latin America Market Value (USD Million) Forecast by Country, 2020 to 2035
  • Table 10: Latin America Market Value (USD Million) Forecast by Product, 2020 to 2035
  • Table 11: Latin America Market Value (USD Million) Forecast by Application, 2020 to 2035
  • Table 12: Latin America Market Value (USD Million) Forecast by End User, 2020 to 2035
  • Table 13: Western Europe Market Value (USD Million) Forecast by Country, 2020 to 2035
  • Table 14: Western Europe Market Value (USD Million) Forecast by Product, 2020 to 2035
  • Table 15: Western Europe Market Value (USD Million) Forecast by Application, 2020 to 2035
  • Table 16: Western Europe Market Value (USD Million) Forecast by End User, 2020 to 2035
  • Table 17: Eastern Europe Market Value (USD Million) Forecast by Country, 2020 to 2035
  • Table 18: Eastern Europe Market Value (USD Million) Forecast by Product, 2020 to 2035
  • Table 19: Eastern Europe Market Value (USD Million) Forecast by Application, 2020 to 2035
  • Table 20: Eastern Europe Market Value (USD Million) Forecast by End User, 2020 to 2035
  • Table 21: South Asia and Pacific Market Value (USD Million) Forecast by Country, 2020 to 2035
  • Table 22: South Asia and Pacific Market Value (USD Million) Forecast by Product, 2020 to 2035
  • Table 23: South Asia and Pacific Market Value (USD Million) Forecast by Application, 2020 to 2035
  • Table 24: South Asia and Pacific Market Value (USD Million) Forecast by End User, 2020 to 2035
  • Table 25: East Asia Market Value (USD Million) Forecast by Country, 2020 to 2035
  • Table 26: East Asia Market Value (USD Million) Forecast by Product, 2020 to 2035
  • Table 27: East Asia Market Value (USD Million) Forecast by Application, 2020 to 2035
  • Table 28: East Asia Market Value (USD Million) Forecast by End User, 2020 to 2035
  • Table 29: Middle East and Africa Market Value (USD Million) Forecast by Country, 2020 to 2035
  • Table 30: Middle East and Africa Market Value (USD Million) Forecast by Product, 2020 to 2035
  • Table 31: Middle East and Africa Market Value (USD Million) Forecast by Application, 2020 to 2035
  • Table 32: Middle East and Africa Market Value (USD Million) Forecast by End User, 2020 to 2035

List of Figures

  • Figure 1: Global Market Value (USD Million) by Product, 2025 to 2035
  • Figure 2: Global Market Value (USD Million) by Application, 2025 to 2035
  • Figure 3: Global Market Value (USD Million) by End User, 2025 to 2035
  • Figure 4: Global Market Value (USD Million) by Region, 2025 to 2035
  • Figure 5: Global Market Value (USD Million) Analysis by Region, 2020 to 2035
  • Figure 6: Global Market Value Share (%) and BPS Analysis by Region, 2025 to 2035
  • Figure 7: Global Market Y-o-Y Growth (%) Projections by Region, 2025 to 2035
  • Figure 8: Global Market Value (USD Million) Analysis by Product, 2020 to 2035
  • Figure 9: Global Market Value Share (%) and BPS Analysis by Product, 2025 to 2035
  • Figure 10: Global Market Y-o-Y Growth (%) Projections by Product, 2025 to 2035
  • Figure 11: Global Market Value (USD Million) Analysis by Application, 2020 to 2035
  • Figure 12: Global Market Value Share (%) and BPS Analysis by Application, 2025 to 2035
  • Figure 13: Global Market Y-o-Y Growth (%) Projections by Application, 2025 to 2035
  • Figure 14: Global Market Value (USD Million) Analysis by End User, 2020 to 2035
  • Figure 15: Global Market Value Share (%) and BPS Analysis by End User, 2025 to 2035
  • Figure 16: Global Market Y-o-Y Growth (%) Projections by End User, 2025 to 2035
  • Figure 17: Global Market Attractiveness by Product, 2025 to 2035
  • Figure 18: Global Market Attractiveness by Application, 2025 to 2035
  • Figure 19: Global Market Attractiveness by End User, 2025 to 2035
  • Figure 20: Global Market Attractiveness by Region, 2025 to 2035
  • Figure 21: North America Market Value (USD Million) by Product, 2025 to 2035
  • Figure 22: North America Market Value (USD Million) by Application, 2025 to 2035
  • Figure 23: North America Market Value (USD Million) by End User, 2025 to 2035
  • Figure 24: North America Market Value (USD Million) by Country, 2025 to 2035
  • Figure 25: North America Market Value (USD Million) Analysis by Country, 2020 to 2035
  • Figure 26: North America Market Value Share (%) and BPS Analysis by Country, 2025 to 2035
  • Figure 27: North America Market Y-o-Y Growth (%) Projections by Country, 2025 to 2035
  • Figure 28: North America Market Value (USD Million) Analysis by Product, 2020 to 2035
  • Figure 29: North America Market Value Share (%) and BPS Analysis by Product, 2025 to 2035
  • Figure 30: North America Market Y-o-Y Growth (%) Projections by Product, 2025 to 2035
  • Figure 31: North America Market Value (USD Million) Analysis by Application, 2020 to 2035
  • Figure 32: North America Market Value Share (%) and BPS Analysis by Application, 2025 to 2035
  • Figure 33: North America Market Y-o-Y Growth (%) Projections by Application, 2025 to 2035
  • Figure 34: North America Market Value (USD Million) Analysis by End User, 2020 to 2035
  • Figure 35: North America Market Value Share (%) and BPS Analysis by End User, 2025 to 2035
  • Figure 36: North America Market Y-o-Y Growth (%) Projections by End User, 2025 to 2035
  • Figure 37: North America Market Attractiveness by Product, 2025 to 2035
  • Figure 38: North America Market Attractiveness by Application, 2025 to 2035
  • Figure 39: North America Market Attractiveness by End User, 2025 to 2035
  • Figure 40: North America Market Attractiveness by Country, 2025 to 2035
  • Figure 41: Latin America Market Value (USD Million) by Product, 2025 to 2035
  • Figure 42: Latin America Market Value (USD Million) by Application, 2025 to 2035
  • Figure 43: Latin America Market Value (USD Million) by End User, 2025 to 2035
  • Figure 44: Latin America Market Value (USD Million) by Country, 2025 to 2035
  • Figure 45: Latin America Market Value (USD Million) Analysis by Country, 2020 to 2035
  • Figure 46: Latin America Market Value Share (%) and BPS Analysis by Country, 2025 to 2035
  • Figure 47: Latin America Market Y-o-Y Growth (%) Projections by Country, 2025 to 2035
  • Figure 48: Latin America Market Value (USD Million) Analysis by Product, 2020 to 2035
  • Figure 49: Latin America Market Value Share (%) and BPS Analysis by Product, 2025 to 2035
  • Figure 50: Latin America Market Y-o-Y Growth (%) Projections by Product, 2025 to 2035
  • Figure 51: Latin America Market Value (USD Million) Analysis by Application, 2020 to 2035
  • Figure 52: Latin America Market Value Share (%) and BPS Analysis by Application, 2025 to 2035
  • Figure 53: Latin America Market Y-o-Y Growth (%) Projections by Application, 2025 to 2035
  • Figure 54: Latin America Market Value (USD Million) Analysis by End User, 2020 to 2035
  • Figure 55: Latin America Market Value Share (%) and BPS Analysis by End User, 2025 to 2035
  • Figure 56: Latin America Market Y-o-Y Growth (%) Projections by End User, 2025 to 2035
  • Figure 57: Latin America Market Attractiveness by Product, 2025 to 2035
  • Figure 58: Latin America Market Attractiveness by Application, 2025 to 2035
  • Figure 59: Latin America Market Attractiveness by End User, 2025 to 2035
  • Figure 60: Latin America Market Attractiveness by Country, 2025 to 2035
  • Figure 61: Western Europe Market Value (USD Million) by Product, 2025 to 2035
  • Figure 62: Western Europe Market Value (USD Million) by Application, 2025 to 2035
  • Figure 63: Western Europe Market Value (USD Million) by End User, 2025 to 2035
  • Figure 64: Western Europe Market Value (USD Million) by Country, 2025 to 2035
  • Figure 65: Western Europe Market Value (USD Million) Analysis by Country, 2020 to 2035
  • Figure 66: Western Europe Market Value Share (%) and BPS Analysis by Country, 2025 to 2035
  • Figure 67: Western Europe Market Y-o-Y Growth (%) Projections by Country, 2025 to 2035
  • Figure 68: Western Europe Market Value (USD Million) Analysis by Product, 2020 to 2035
  • Figure 69: Western Europe Market Value Share (%) and BPS Analysis by Product, 2025 to 2035
  • Figure 70: Western Europe Market Y-o-Y Growth (%) Projections by Product, 2025 to 2035
  • Figure 71: Western Europe Market Value (USD Million) Analysis by Application, 2020 to 2035
  • Figure 72: Western Europe Market Value Share (%) and BPS Analysis by Application, 2025 to 2035
  • Figure 73: Western Europe Market Y-o-Y Growth (%) Projections by Application, 2025 to 2035
  • Figure 74: Western Europe Market Value (USD Million) Analysis by End User, 2020 to 2035
  • Figure 75: Western Europe Market Value Share (%) and BPS Analysis by End User, 2025 to 2035
  • Figure 76: Western Europe Market Y-o-Y Growth (%) Projections by End User, 2025 to 2035
  • Figure 77: Western Europe Market Attractiveness by Product, 2025 to 2035
  • Figure 78: Western Europe Market Attractiveness by Application, 2025 to 2035
  • Figure 79: Western Europe Market Attractiveness by End User, 2025 to 2035
  • Figure 80: Western Europe Market Attractiveness by Country, 2025 to 2035
  • Figure 81: Eastern Europe Market Value (USD Million) by Product, 2025 to 2035
  • Figure 82: Eastern Europe Market Value (USD Million) by Application, 2025 to 2035
  • Figure 83: Eastern Europe Market Value (USD Million) by End User, 2025 to 2035
  • Figure 84: Eastern Europe Market Value (USD Million) by Country, 2025 to 2035
  • Figure 85: Eastern Europe Market Value (USD Million) Analysis by Country, 2020 to 2035
  • Figure 86: Eastern Europe Market Value Share (%) and BPS Analysis by Country, 2025 to 2035
  • Figure 87: Eastern Europe Market Y-o-Y Growth (%) Projections by Country, 2025 to 2035
  • Figure 88: Eastern Europe Market Value (USD Million) Analysis by Product, 2020 to 2035
  • Figure 89: Eastern Europe Market Value Share (%) and BPS Analysis by Product, 2025 to 2035
  • Figure 90: Eastern Europe Market Y-o-Y Growth (%) Projections by Product, 2025 to 2035
  • Figure 91: Eastern Europe Market Value (USD Million) Analysis by Application, 2020 to 2035
  • Figure 92: Eastern Europe Market Value Share (%) and BPS Analysis by Application, 2025 to 2035
  • Figure 93: Eastern Europe Market Y-o-Y Growth (%) Projections by Application, 2025 to 2035
  • Figure 94: Eastern Europe Market Value (USD Million) Analysis by End User, 2020 to 2035
  • Figure 95: Eastern Europe Market Value Share (%) and BPS Analysis by End User, 2025 to 2035
  • Figure 96: Eastern Europe Market Y-o-Y Growth (%) Projections by End User, 2025 to 2035
  • Figure 97: Eastern Europe Market Attractiveness by Product, 2025 to 2035
  • Figure 98: Eastern Europe Market Attractiveness by Application, 2025 to 2035
  • Figure 99: Eastern Europe Market Attractiveness by End User, 2025 to 2035
  • Figure 100: Eastern Europe Market Attractiveness by Country, 2025 to 2035
  • Figure 101: South Asia and Pacific Market Value (USD Million) by Product, 2025 to 2035
  • Figure 102: South Asia and Pacific Market Value (USD Million) by Application, 2025 to 2035
  • Figure 103: South Asia and Pacific Market Value (USD Million) by End User, 2025 to 2035
  • Figure 104: South Asia and Pacific Market Value (USD Million) by Country, 2025 to 2035
  • Figure 105: South Asia and Pacific Market Value (USD Million) Analysis by Country, 2020 to 2035
  • Figure 106: South Asia and Pacific Market Value Share (%) and BPS Analysis by Country, 2025 to 2035
  • Figure 107: South Asia and Pacific Market Y-o-Y Growth (%) Projections by Country, 2025 to 2035
  • Figure 108: South Asia and Pacific Market Value (USD Million) Analysis by Product, 2020 to 2035
  • Figure 109: South Asia and Pacific Market Value Share (%) and BPS Analysis by Product, 2025 to 2035
  • Figure 110: South Asia and Pacific Market Y-o-Y Growth (%) Projections by Product, 2025 to 2035
  • Figure 111: South Asia and Pacific Market Value (USD Million) Analysis by Application, 2020 to 2035
  • Figure 112: South Asia and Pacific Market Value Share (%) and BPS Analysis by Application, 2025 to 2035
  • Figure 113: South Asia and Pacific Market Y-o-Y Growth (%) Projections by Application, 2025 to 2035
  • Figure 114: South Asia and Pacific Market Value (USD Million) Analysis by End User, 2020 to 2035
  • Figure 115: South Asia and Pacific Market Value Share (%) and BPS Analysis by End User, 2025 to 2035
  • Figure 116: South Asia and Pacific Market Y-o-Y Growth (%) Projections by End User, 2025 to 2035
  • Figure 117: South Asia and Pacific Market Attractiveness by Product, 2025 to 2035
  • Figure 118: South Asia and Pacific Market Attractiveness by Application, 2025 to 2035
  • Figure 119: South Asia and Pacific Market Attractiveness by End User, 2025 to 2035
  • Figure 120: South Asia and Pacific Market Attractiveness by Country, 2025 to 2035
  • Figure 121: East Asia Market Value (USD Million) by Product, 2025 to 2035
  • Figure 122: East Asia Market Value (USD Million) by Application, 2025 to 2035
  • Figure 123: East Asia Market Value (USD Million) by End User, 2025 to 2035
  • Figure 124: East Asia Market Value (USD Million) by Country, 2025 to 2035
  • Figure 125: East Asia Market Value (USD Million) Analysis by Country, 2020 to 2035
  • Figure 126: East Asia Market Value Share (%) and BPS Analysis by Country, 2025 to 2035
  • Figure 127: East Asia Market Y-o-Y Growth (%) Projections by Country, 2025 to 2035
  • Figure 128: East Asia Market Value (USD Million) Analysis by Product, 2020 to 2035
  • Figure 129: East Asia Market Value Share (%) and BPS Analysis by Product, 2025 to 2035
  • Figure 130: East Asia Market Y-o-Y Growth (%) Projections by Product, 2025 to 2035
  • Figure 131: East Asia Market Value (USD Million) Analysis by Application, 2020 to 2035
  • Figure 132: East Asia Market Value Share (%) and BPS Analysis by Application, 2025 to 2035
  • Figure 133: East Asia Market Y-o-Y Growth (%) Projections by Application, 2025 to 2035
  • Figure 134: East Asia Market Value (USD Million) Analysis by End User, 2020 to 2035
  • Figure 135: East Asia Market Value Share (%) and BPS Analysis by End User, 2025 to 2035
  • Figure 136: East Asia Market Y-o-Y Growth (%) Projections by End User, 2025 to 2035
  • Figure 137: East Asia Market Attractiveness by Product, 2025 to 2035
  • Figure 138: East Asia Market Attractiveness by Application, 2025 to 2035
  • Figure 139: East Asia Market Attractiveness by End User, 2025 to 2035
  • Figure 140: East Asia Market Attractiveness by Country, 2025 to 2035
  • Figure 141: Middle East and Africa Market Value (USD Million) by Product, 2025 to 2035
  • Figure 142: Middle East and Africa Market Value (USD Million) by Application, 2025 to 2035
  • Figure 143: Middle East and Africa Market Value (USD Million) by End User, 2025 to 2035
  • Figure 144: Middle East and Africa Market Value (USD Million) by Country, 2025 to 2035
  • Figure 145: Middle East and Africa Market Value (USD Million) Analysis by Country, 2020 to 2035
  • Figure 146: Middle East and Africa Market Value Share (%) and BPS Analysis by Country, 2025 to 2035
  • Figure 147: Middle East and Africa Market Y-o-Y Growth (%) Projections by Country, 2025 to 2035
  • Figure 148: Middle East and Africa Market Value (USD Million) Analysis by Product, 2020 to 2035
  • Figure 149: Middle East and Africa Market Value Share (%) and BPS Analysis by Product, 2025 to 2035
  • Figure 150: Middle East and Africa Market Y-o-Y Growth (%) Projections by Product, 2025 to 2035
  • Figure 151: Middle East and Africa Market Value (USD Million) Analysis by Application, 2020 to 2035
  • Figure 152: Middle East and Africa Market Value Share (%) and BPS Analysis by Application, 2025 to 2035
  • Figure 153: Middle East and Africa Market Y-o-Y Growth (%) Projections by Application, 2025 to 2035
  • Figure 154: Middle East and Africa Market Value (USD Million) Analysis by End User, 2020 to 2035
  • Figure 155: Middle East and Africa Market Value Share (%) and BPS Analysis by End User, 2025 to 2035
  • Figure 156: Middle East and Africa Market Y-o-Y Growth (%) Projections by End User, 2025 to 2035
  • Figure 157: Middle East and Africa Market Attractiveness by Product, 2025 to 2035
  • Figure 158: Middle East and Africa Market Attractiveness by Application, 2025 to 2035
  • Figure 159: Middle East and Africa Market Attractiveness by End User, 2025 to 2035
  • Figure 160: Middle East and Africa Market Attractiveness by Country, 2025 to 2035

Frequently Asked Questions

What is the future of global 3D Cell Culture industry?

The global 3D Cell Culture industry is projected to witness CAGR of 9.8% between 2025 and 2035.

What was the worth of the global 3D Cell Culture industry in 2024?

The global 3D Cell Culture industry stood at USD 1,351.8 million in 2024.

What will the worth of global 3D Cell Culture industry by 2035 end?

The global rare neurological disease treatment industry is anticipated to reach USD 3,805.7 million by 2035 end.

What is the expected CAGR for China during forecast period?

China is expected to show a CAGR of 7.7% in the assessment period.

Who are the key manufacturer of global 3D Cell Culture industry?

The key players operating in the global 3D Cell Culture industry are Merck KGaA, Lonza Group AG, 3D Biotek LLC, InSphero AG, Greiner Bio-One, Mimetas BV, CN Bio Innovations, Advanced Biomatrix and Others.

Explore Similar Insights

Future Market Insights

3D Cell Culture Market