Reports
- Global Locations -
Headquarters
Future Market Insights, Inc.
Christiana Corporate, 200
Continental Drive, Suite 401,
Newark, Delaware - 19713,
United States
Americas
Future Market Insights, Inc.
616 Corporate Way, Suite 2-9018,
Valley Cottage, NY 10989, United States
MEA
Future Market Insights
1602-6 Jumeirah Bay X2 Tower, Plot No: JLT-PH2-X2A,
Jumeirah Lakes Towers, Dubai,
United Arab Emirates
Europe
Future Market Insights
3rd Floor, 207 Regent Street,
W1B 3HH London
United Kingdom
Asia Pacific
Future Market Insights
Office No. 401-A, 4th Floor,
VANTAGE 9, S.No. 36/1/1,
Baner, Pune 411045, India
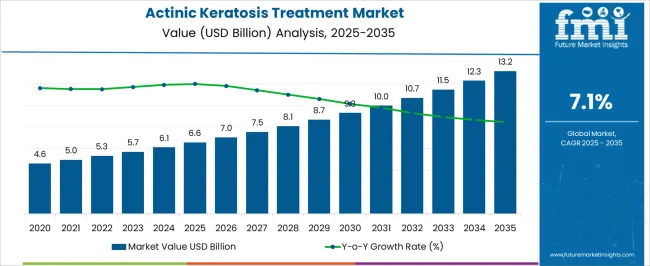
[275 Pages Report] The global Actinic Keratosis Treatment Market was valued at US$ 5.0 Billion in 2021 and is expected to reach US$ 8.0 Billion by 2028, finds Future Market Insights (FMI) in a recent market survey.
Data Points | Market Insights |
---|---|
Market Value 2022 | USD 5.4 Billion |
Market Value 2028 | USD 8.0 Billion |
CAGR 2022 to 2028 | 7.0% |
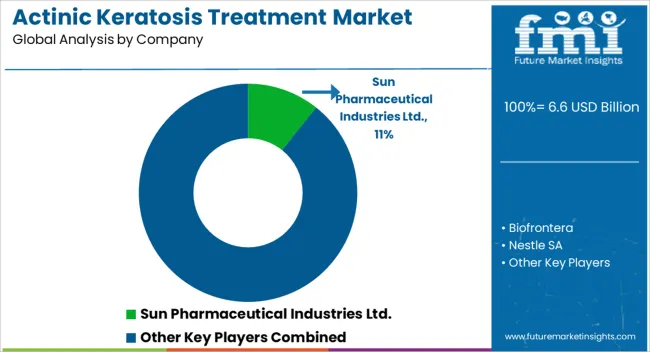
Key Players | The key players are Sun Pharmaceutical Industries Ltd., Biofrontera, Nestle SA, Bausch Health Companies Inc., Novartis AG, GlaxoSmithKline plc., Almirall, LLC, LEO Pharma Inc., Cipher Pharmaceuticals Inc. and Pierre Fabre Pharmaceuticals, Inc. |
Share of Top 5 Countries | 61.3% |
Growing prevalence of actinic keratosis, increase in need for actinic keratosis treatment products, potential drugs in pipeline, and preferable use of topical therapeutics are the primary factors fueling the development of the actinic keratosis treatment market. In addition, the growing incidences of skin cancer, together with the increasing demand for minimally invasive surgeries, is supporting the actinic keratosis treatment market growth.
Also, together with considerable investment in research and development (R&D) activities to manufacture novel therapies with convenient dosage, improved efficacy, and reduced costs, is creating favorable opportunities for the players in the actinic keratosis treatment market.
Actinic Keratosis Treatment market holds nearly 16.6% market value share of the US$ 30 Bn Dermatology Market in 2021. The surgical procedure is expected to be the most preferred for actinic keratosis due to availability of minimally invasive surgeries.
Moreover, new product launches are projected to increase in the forthcoming years as huge number of products are in pipeline for approval for treatment of actinic keratosis.
For instance, in June 2020, Sun Pharmaceutical Industries Ltd. launched Levulan Kerastick, a topical solution for the treatment of mild to moderate actinic keratosis of the scalp, face, and upper extremities
Driven by this, sales of actinic keratosis treatments are expected to rise at a 7.0% CAGR through 2028.
Don't pay for what you don't need
Customize your report by selecting specific countries or regions and save 30%!
Particulars | Details |
---|---|
H1, 2021 | 7.02% |
H1, 2022 Projected | 6.89% |
H1, 2022 Outlook | 6.79% |
BPS Change - H1, 2022 (O) - H1, 2022 (P) | (-) 10 ↓ |
BPS Change - H1, 2022 (O) - H1, 2021 | (-) 23 ↓ |
A comparative analysis related to the market growth rates and development prospects in the global actinic keratosis treatment market is presented by Future Market Insights. The market is highly influenced by the regulatory approvals and innovation factors under the impact of macro and industry factors.
The market is subject to developments like, acquisitions and collaborations, wherein the collaborations are mainly done to expand the skin and cosmetic product portfolio.
According to Future Market Insight analysis, the global actinic keratosis treatment market expects to drop by 23 Basis Point Share (BPS) in H1-2022 as compared to H1- 2021. Whereas in comparison to H1-2022 Projected value, the market during H1-2022 outlook period will show a dip of 10 BPS.
The advent of the COVID-19 pandemic imposed restrictions upon the general population to be rendered indoors. Owing to this, the lowered exposure to sun has led to a reduction in the occurrence of actinic keratosis, with online distribution channels flourishing as means of proliferation of essential goods.
In developing regions, dearth of skilled professionals and lower treatment adoption rate contribute in negatively impacting the market growth. The lack of awareness in developing regions as well as traditional treatment methods like application of apple cider vinegar can further hamper the market growth.
The actinic keratosis market has the potential to grow during the coming years owing to increasing research & development (R&D) activities to fast track the new drug approvals for the actinic keratosis treatment. Also, the increased risk of developing actinic keratosis associated skin cancer has led to rise in diagnosis & treatment rate.
Sales of actinic keratosis treatment grew at a CAGR of 6.6% between 2013 and 2021.
Rising prevalence of actinic keratosis together with rising awareness regarding treatment of the disease and growing adoption of minimally invasive treatments is expected to boost the demand for the actinic keratosis treatment market.
Increasing awareness regarding the adverse effect of actinic keratosis is driving the demand for actinic keratosis treatment. Moreover, awareness campaigns being conducted by government agencies and non-profit organizations is adding considerably to the market development.
For instance, a campaign was launched in 2019 by the Skin Cancer Foundation titled, “Ray Awareness – Preventing Skin Cancer” to boost awareness regarding the tanning beds on the skin as an effect of exposure to UV radiations from the sun while emphasizing actinic keratosis treatment as a primary measure in order to prevent non-melanoma cancer.
The increasing research & development (R&D) activities are anticipated to surge the new drug approvals for the actinic keratosis treatment over the forecast period. Also, the increased risk of developing actinic keratosis associated skin cancer has led to rise in diagnosis & treatment rate.
Considering this, FMI expects the global actinic keratosis treatment market to grow at a CAGR of 7.0% through 2028.
The lack of skilled professionals and low penetration of treatment in developing markets are the major factors hindering the growth of the actinic keratosis treatment market.
Skilled professionals and surgeons are needed for performing actinic keratosis treatment such as chemical peel, cryotherapy, and photodynamic therapy. But, a considerable shortage in the amount of general surgeons is projected to hamper actinic keratosis market development. As per the recent WHO study, there is expected a shortage of around 13 million healthcare professionals across the world by the end of 2035.
In addition, less awareness regarding the health condition in emerging nations and higher treatment costs are expected to restrain growth of the market. Availability of alternative natural treatments is also anticipated to hamper the market growth.
The coronavirus is continuously marching across the world, disrupting almost all businesses worldwide. This pandemic outbreak affected industries and several economies because of travel bans, lockdowns, and business closures.
As a consequence of pandemic related lockdowns in several nations and disturbances in the supply chain of medical equipment, the actinic keratosis treatment market observed a drop in sales in 2020.
In 2020, the detection and treatment rates have been decreased considerably because of the limitations on non-essential doctor visits and strict lockdown in many countries. For example, in 2020, about 12.7 million treatments such as topical drugs, photodynamic therapy, and surgical for actinic keratosis were carried out in the U.S. while, in 2019, there were about 15.1 million treatments performed for actinic keratosis.
The U.S. is estimated to account for around 91.5% of the North America Actinic Keratosis Treatment market in 2022.
High prevalence of disease, proactive government measures, rising consumer awareness, and technological advancements are factors contributing to the growth of the market in U.S. As per the American Academy of Dermatology Association, over 40 million Americans suffer from actinic keratosis (AKs) every year. In addition, the availability of well-developed healthcare infrastructure and growing healthcare spending is expected to lead to increase in demand for actinic keratosis treatment in U.S.
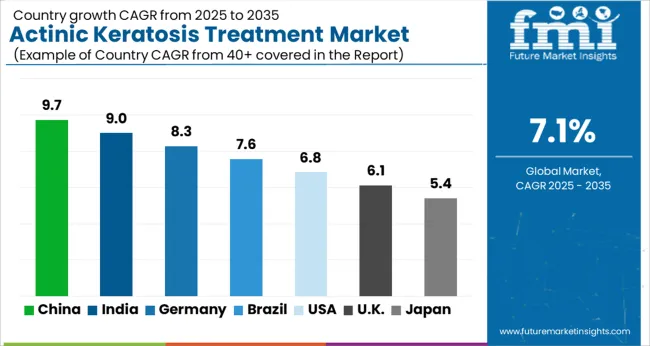
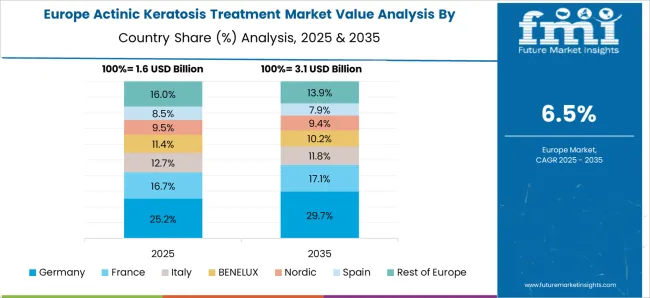
U.K. is estimated to account for 27.0% of the Europe actinic keratosis treatment market in Europe in 2022.
The development of the market in U.K. is owing to the high prevalence of actinic keratosis and growing adoption of minimally invasive procedures. In addition, minimally invasive surgeries are first line of treatment for most of the actinic keratosis. Low cost treatment for actinic keratosis together with favorable reimbursements by Medicaid and Medicare are some of the other factors anticipated to boost the demand for the actinic keratosis treatment market and drive the development of the market.
The actinic keratosis treatment market in Japan is estimated to be worth US$ 145.7 Mn in 2022 in the global market.
Strong reimbursement policies in Japan and large population base over age 40 years are some of the major factors responsible for the growth of the market in Japan. Moreover, high adoption of combination therapies such as topical and cryotherapy are expected to propel the growth of Japan actinic keratosis treatment market.
Actinic keratosis could be eliminated by freezing them together with liquid nitrogen. When the substance is applied, the skin starts healing, as the skin heals, the damaged cells get removed, permitting new skin to appear. Cryotherapy is the most common treatment. Moreover, increasing dermatology visits as growing awareness regarding skin disorder are expected to propel the growth of Japan actinic keratosis market.
Demand for actinic keratosis treatment in India is expected to rise at around 7.7% CAGR over the forecast period.
The growing patient pool affected from actinic keratosis, increasing per capita healthcare expenditure and increasing R&D funding for novel therapies is expected to be the primary factors fueling the development of the actinic keratosis treatment market in India. Moreover, rising geriatric population India that is highly prone to actinic keratosis is one of the major factors driving the market.
Get the data you need at a Fraction of the cost
Personalize your report by choosing insights you need
and save 40%!
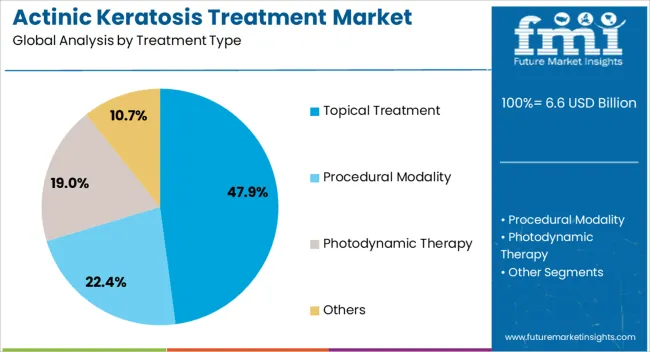
By treatment type, topical treatment is anticipated to hold the maximum share of 46.9% in 2022, expanding at rate of nearly 6.2% during the forecast period.
Growing adoption of self-administered treatment and easy availability of home-based therapy options is expected to drive the growth of the segment. Topical creams comprising fluorouracil that is a chemotherapy drug, and other medicines such as Imiquimod (INN) gels and diclofenac which is an analgesic, are mostly prescribed as topical treatment for actinic keratosis. The combined treatment of cryotherapy and fluorouracil with the help of cryosurgery units is also adopted due to its great success rate in treatment of actinic keratosis.
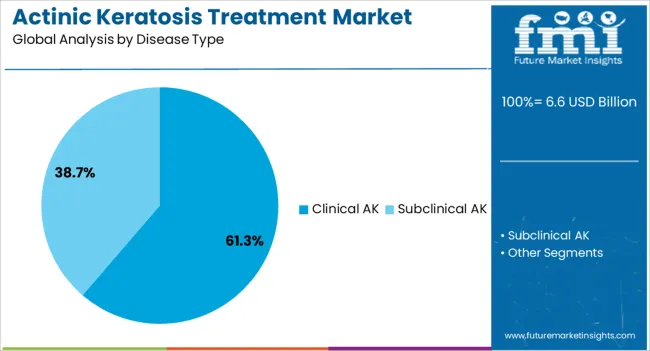
By disease type, clinical actinic keratosis will lead the market and is projected to account for 95.2% of the total market revenue share in 2022.
The growing prevalence of clinical actinic keratosis is the primary factor driving the segment growth. While the occurrence of actinic keratosis is growing, awareness regarding the risk of disease leading to the development of a cancer is convincing dermatologists for more clinical diagnosis. Rising awareness regarding the risk of clinical actinic keratosis lesions is expected to add to the development of the segment over the forecast period.
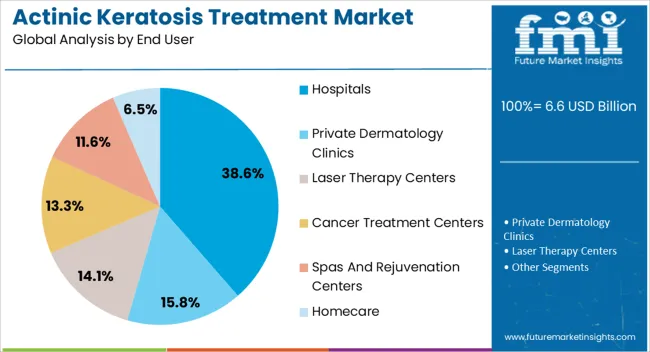
By end user, the hospitals segment is anticipated to hold the maximum share of 34.0% in 2022, expanding at rapid rate of 6.4% CAGR during the forecast period.
The ease of accessibility of patient pool in hospitals owing to the availability of required therapies and medications at a single place is a primary factor adding towards the highest share of the segment. In addition, developing healthcare infrastructure, high adoption of surgical procedures and growing adoption of photodynamic therapy is expected to drive the growth of the actinic keratosis treatment market.
Companies operating in the actinic keratosis treatment market are consolidated and competitive by nature, with a presence of few players. These players are involved in a number of strategic alliances. The product launch and acquisition accelerates the manufacturer’s strategy to capitalize on the market share and capture the significant share of market. Some of the recent instances include:
Attribute | Details |
---|---|
Forecast Period | 2013 to 2021 |
Historical Data Available for | 2022 to 2028 |
Market Analysis | USD Million for Value |
Key Countries Covered | USA, Canada, Brazil, Mexico, Germany, UK, France, Italy, Spain, Russia, Poland, China, Japan, India, Thailand, Malaysia, Indonesia, Australia, New Zealand, GCC Countries, South Africa |
Key Segments Covered | Treatment Type, Disease Type, End User and Region |
Key Companies Profiled |
|
Report Coverage | Market Forecast, Competition Intelligence, DROT Analysis, Market Dynamics and Challenges, Strategic Growth Initiatives |
Customization & Pricing | Available upon Request |
By Treatment Type:
By Disease Type:
By End User:
By Region:
1. Executive Summary 1.1. Market Overview 1.2. Market Analysis 1.3. FMI Analysis and Recommendations 1.4. Wheel of Fortune 2. Market Introduction 2.1. Market Taxonomy 2.2. Market Definition 2.3. Exclusion and Inclusion 3. Global Economic Outlook 3.1. Gross Domestic Product by Region & Country, 2006 – 2021 3.2. Global Healthcare Market Indicators 4. Market Opportunity Analysis 4.1. Macro-Economic Factors 4.2. Opportunity Analysis 5. Market Dynamics 5.1. Drivers 5.1.1. Supply Side Drivers 5.1.2. Demand Side Drivers 5.2. Restraints 5.3. Trends 6. Market Data Call Out 6.1. Parent Market Analysis 6.2. Disease Epidemiology 6.3. Treatment Regimen 6.4. Procedure Volume of Cosmetic Therapies 6.5. Key Regulations 6.6. Reimbursement Scenario and Payer Mix Analysis 6.7. Treatment Cost by Region 7. North America Actinic Keratosis Treatment Market Analysis 2013–2021 and Forecast 2022–2028 7.1. Introduction 7.2. Historical Market Size (US$ Mn) Analysis By Country, 2013–2021 7.2.1. U.S. 7.2.2. Canada 7.3. Market Size (US$ Mn) Forecast By Country, 2022–2028 7.4. Historical Market Size (US$ Mn) Trend Analysis By Treatment Type, 2013–2021 7.4.1. Topical Treatment 7.4.1.1. 5-fluorouracil Cream 7.4.1.2. Diclofenac Gel 7.4.1.3. Imiquimod Cream 7.4.1.4. Ingenol mebutate Gel 7.4.2. Procedural Modality 7.4.2.1. Chemical Peels 7.4.2.2. Cryotherapy 7.4.3. Photodynamic Therapy 7.4.4. Others 7.5. Market Size (US$ Mn) Forecast By Treatment Type, 2022–2028 7.6. Historical Market Size (US$ Mn) Trend Analysis By Disease Type, 2013–2021 7.6.1. Clinical AK 7.6.2. Subclinical AK 7.7. Market Size (US$ Mn) Forecast By Disease Type, 2022–2028 7.8. Historical Market Size (US$ Mn) Trend Analysis By End User, 2013–2021 7.8.1. Hospitals 7.8.2. Private Dermatology Clinics 7.8.3. Laser Therapy Centers 7.8.4. Cancer Treatment Centers 7.8.5. Spas and Rejuvenation Centers 7.8.6. Homecare 7.9. Market Size (US$ Mn) Forecast By End User, 2022–2028 7.10. Market Attractiveness Analysis 7.10.1. By Country 7.10.2. By Treatment Type 7.10.3. By Disease Type 7.10.4. By End User 7.11. Drivers and Restraints: Impact Analysis 7.12. Key Market Participants – Intensity Mapping 8. Latin America Actinic Keratosis Treatment Market Analysis 2013–2021 and Forecast 2022–2028 8.1. Introduction 8.2. Regional Market Trends 8.3. Historical Market Size (US$ Mn) Analysis By Country, 2013–2021 8.3.1. Brazil 8.3.2. Mexico 8.3.3. Rest of Latin America 8.4. Market Size (US$ Mn) Forecast By Country, 2022–2028 8.5. Historical Market Size (US$ Mn) Trend Analysis By Treatment Type, 2013–2021 8.5.1. Topical Treatment 8.5.1.1. 5-fluorouracil Cream 8.5.1.2. Diclofenac Gel 8.5.1.3. Imiquimod Cream 8.5.1.4. Ingenol mebutate Gel 8.5.2. Procedural Modality 8.5.2.1. Chemical Peels 8.5.2.2. Cryotherapy 8.5.3. Photodynamic Therapy 8.5.4. Others 8.6. Market Size (US$ Mn) Forecast By Treatment Type, 2022–2028 8.7. Historical Market Size (US$ Mn) Trend Analysis By Disease Type, 2013–2021 8.7.1. Clinical AK 8.7.2. Subclinical AK 8.8. Market Size (US$ Mn) Forecast By Disease Type, 2022–2028 8.9. Historical Market Size (US$ Mn) Trend Analysis By End User, 2013–2021 8.9.1. Hospitals 8.9.2. Private Dermatology Clinics 8.9.3. Laser Therapy Centers 8.9.4. Cancer Treatment Centers 8.9.5. Spas and Rejuvenation Centers 8.9.6. Homecare 8.10. Market Size (US$ Mn) Forecast By End User, 2022–2028 8.11. Market Attractiveness Analysis 8.11.1. By Country 8.11.2. By Treatment Type 8.11.3. By Disease Type 8.11.4. By End User 8.12. Drivers and Restraints: Impact Analysis 8.13. Key Market Participants – Intensity Mapping 9. Western Europe Actinic Keratosis Treatment Market Analysis 2013–2021 and Forecast 2022–2028 9.1. Introduction 9.2. Historical Market Size (US$ Mn) Analysis By Country, 2013–2021 9.2.1. Germany 9.2.2. U.K 9.2.3. France 9.2.4. Italy 9.2.5. Spain 9.2.6. Rest of Western Europe 9.3. Market Size (US$ Mn) Forecast By Country, 2022–2028 9.4. Historical Market Size (US$ Mn) Trend Analysis By Treatment Type, 2013–2021 9.4.1. Topical Treatment 9.4.1.1. 5-fluorouracil Cream 9.4.1.2. Diclofenac Gel 9.4.1.3. Imiquimod Cream 9.4.1.4. Ingenol mebutate Gel 9.4.2. Procedural Modality 9.4.2.1. Chemical Peels 9.4.2.2. Cryotherapy 9.4.3. Photodynamic Therapy 9.4.4. Others 9.5. Market Size (US$ Mn) Forecast By Treatment Type, 2022–2028 9.6. Historical Market Size (US$ Mn) Trend Analysis By Disease Type, 2013–2021 9.6.1. Clinical AK 9.6.2. Subclinical AK 9.7. Market Size (US$ Mn) Forecast By Disease Type, 2022–2028 9.8. Historical Market Size (US$ Mn) Trend Analysis By End User, 2013–2021 9.8.1. Hospitals 9.8.2. Private Dermatology Clinics 9.8.3. Laser Therapy Centers 9.8.4. Cancer Treatment Centers 9.8.5. Spas and Rejuvenation Centers 9.8.6. Homecare 9.9. Market Size (US$ Mn) Forecast By End User, 2022–2028 9.10. Market Attractiveness Analysis 9.10.1. By Country 9.10.2. By Treatment Type 9.10.3. By Disease Type 9.10.4. By End User 9.11. Drivers and Restraints: Impact Analysis 9.12. Key Market Participants – Intensity Mapping 10. Eastern Europe Actinic Keratosis Treatment Market Analysis 2013–2021 and Forecast 2022–2028 10.1. Introduction 10.2. Historical Market Size (US$ Mn) Analysis By Country, 2013–2021 10.2.1. Russia 10.2.2. Poland 10.2.3. Rest of Eastern Europe 10.3. Market Size (US$ Mn) Forecast By Country, 2022–2028 10.4. Historical Market Size (US$ Mn) Trend Analysis By Treatment Type, 2013–2021 10.4.1. Topical Treatment 10.4.1.1. 5-fluorouracil Cream 10.4.1.2. Diclofenac Gel 10.4.1.3. Imiquimod Cream 10.4.1.4. Ingenol mebutate Gel 10.4.2. Procedural Modality 10.4.2.1. Chemical Peels 10.4.2.2. Cryotherapy 10.4.3. Photodynamic Therapy 10.4.4. Others 10.5. Market Size (US$ Mn) Forecast By Treatment Type, 2022–2028 10.6. Historical Market Size (US$ Mn) Trend Analysis By Disease Type, 2013–2021 10.6.1. Clinical AK 10.6.2. Subclinical AK 10.7. Market Size (US$ Mn) Forecast By Disease Type, 2022–2028 10.8. Historical Market Size (US$ Mn) Trend Analysis By End User, 2013–2021 10.8.1. Hospitals 10.8.2. Private Dermatology Clinics 10.8.3. Laser Therapy Centers 10.8.4. Cancer Treatment Centers 10.8.5. Spas and Rejuvenation Centers 10.8.6. Homecare 10.9. Market Size (US$ Mn) Forecast By End User, 2022–2028 10.10. Market Attractiveness Analysis 10.10.1. By Country 10.10.2. By Treatment Type 10.10.3. By Disease Type 10.10.4. By End User 10.11. Drivers and Restraints: Impact Analysis 10.12. Key Market Participants – Intensity Mapping 11. Asia Pacific Excluding Japan Actinic Keratosis Treatment Market Analysis 2013–2021 and Forecast 2022–2028 11.1. Introduction 11.2. Historical Market Size (US$ Mn) Analysis By Country, 2013–2021 11.2.1. India 11.2.2. Australia and New Zealand 11.2.3. China 11.2.4. ASEAN 11.2.5. Rest of APECJ 11.3. Market Size (US$ Mn) Forecast By Country, 2022–2028 11.4. Historical Market Size (US$ Mn) Trend Analysis By Treatment Type, 2013–2021 11.4.1. Topical Treatment 11.4.1.1. 5-fluorouracil Cream 11.4.1.2. Diclofenac Gel 11.4.1.3. Imiquimod Cream 11.4.1.4. Ingenol mebutate Gel 11.4.2. Procedural Modality 11.4.2.1. Chemical Peels 11.4.2.2. Cryotherapy 11.4.3. Photodynamic Therapy 11.4.4. Others 11.5. Market Size (US$ Mn) Forecast By Treatment Type, 2022–2028 11.6. Historical Market Size (US$ Mn) Trend Analysis By Disease Type, 2013–2021 11.6.1. Clinical AK 11.6.2. Subclinical AK 11.7. Market Size (US$ Mn) Forecast By Disease Type, 2022–2028 11.8. Historical Market Size (US$ Mn) Trend Analysis By End User, 2013–2021 11.8.1. Hospitals 11.8.2. Private Dermatology Clinics 11.8.3. Laser Therapy Centers 11.8.4. Cancer Treatment Centers 11.8.5. Spas and Rejuvenation Centers 11.8.6. Homecare 11.9. Market Size (US$ Mn) Forecast By End User, 2022–2028 11.10. Market Attractiveness Analysis 11.10.1. By Country 11.10.2. By Treatment Type 11.10.3. By Disease Type 11.10.4. By End User 11.11. Drivers and Restraints: Impact Analysis 11.12. Key Market Participants – Intensity Mapping 12. Japan Actinic Keratosis Treatment Market Analysis 2013–2021 and Forecast 2022–2028 12.1. Introduction 12.2. Historical Market Size (US$ Mn) Trend Analysis By Treatment Type, 2013–2021 12.2.1. Topical Treatment 12.2.1.1. 5-fluorouracil Cream 12.2.1.2. Diclofenac Gel 12.2.1.3. Imiquimod Cream 12.2.1.4. Ingenol mebutate Gel 12.2.2. Procedural Modality 12.2.2.1. Chemical Peels 12.2.2.2. Cryotherapy 12.2.3. Photodynamic Therapy 12.2.4. Others 12.3. Market Size (US$ Mn) Forecast By Treatment Type, 2022–2028 12.4. Historical Market Size (US$ Mn) Trend Analysis By Disease Type, 2013–2021 12.4.1. Clinical AK 12.4.2. Subclinical AK 12.5. Market Size (US$ Mn) Forecast By Disease Type, 2022–2028 12.6. Historical Market Size (US$ Mn) Trend Analysis By End User, 2013–2021 12.6.1. Hospitals 12.6.2. Private Dermatology Clinics 12.6.3. Laser Therapy Centers 12.6.4. Cancer Treatment Centers 12.6.5. Spas and Rejuvenation Centers 12.6.6. Homecare 12.7. Market Size (US$ Mn) Forecast By End User, 2022–2028 12.8. Market Attractiveness Analysis 12.8.1. By Country 12.8.2. By Treatment Type 12.8.3. By Disease Type 12.8.4. By End User 12.9. Drivers and Restraints: Impact Analysis 12.10. Key Market Participants – Intensity Mapping 13. Middle East and Africa Actinic Keratosis Treatment Market Analysis 2013–2021 and Forecast 2022–2028 13.1. Introduction 13.2. Historical Market Size (US$ Mn) Analysis By Country, 2013–2021 13.2.1. GCC Countries 13.2.2. South Africa 13.2.3. Rest of Middle East and Africa 13.3. Market Size (US$ Mn) Forecast By Country, 2022–2028 13.4. Historical Market Size (US$ Mn) Trend Analysis By Treatment Type, 2013–2021 13.4.1. Topical Treatment 13.4.1.1. 5-fluorouracil Cream 13.4.1.2. Diclofenac Gel 13.4.1.3. Imiquimod Cream 13.4.1.4. Ingenol mebutate Gel 13.4.2. Procedural Modality 13.4.2.1. Chemical Peels 13.4.2.2. Cryotherapy 13.4.3. Photodynamic Therapy 13.4.4. Others 13.5. Market Size (US$ Mn) Forecast By Treatment Type, 2022–2028 13.6. Historical Market Size (US$ Mn) Trend Analysis By Disease Type, 2013–2021 13.6.1. Clinical AK 13.6.2. Subclinical AK 13.7. Market Size (US$ Mn) Forecast By Disease Type, 2022–2028 13.8. Historical Market Size (US$ Mn) Trend Analysis By End User, 2013–2021 13.8.1. Hospitals 13.8.2. Private Dermatology Clinics 13.8.3. Laser Therapy Centers 13.8.4. Cancer Treatment Centers 13.8.5. Spas and Rejuvenation Centers 13.8.6. Homecare 13.9. Market Size (US$ Mn) Forecast By End User, 2022–2028 13.10. Market Attractiveness Analysis 13.10.1. By Country 13.10.2. By Treatment Type 13.10.3. By Disease Type 13.10.4. By End User 13.11. Drivers and Restraints: Impact Analysis 13.12. Key Market Participants – Intensity Mapping 14. Forecast Factors: Relevance and Impact 15. Forecast Assumptions 16. Market Structure Analysis 16.1. Market Structure by Tier 16.2. Brand Share Analysis (2021) for Photodynamic Therapy 16.3. Product Intensity Mapping by Manufacturer 17. Competition Analysis 17.1. Competition Dashboard 17.2. Competitors Deep Dive 17.2.1. Sun Pharmaceutical Industries Ltd. 17.2.2. Biofrontera 17.2.3. Nestle SA 17.2.4. Bausch Health Companies Inc. 17.2.5. Novartis AG 17.2.6. GlaxoSmithKline plc. 17.2.7. Almirall, LLC 17.2.8. LEO Pharma Inc. 17.2.9. Cipher Pharmaceuticals Inc 17.2.10. Pierre Fabre Pharmaceuticals, Inc. 18. Global Actinic Keratosis Treatment Market Analysis 2013–2021 and Forecast 2022–2028 By Region 18.1. Introduction / Key Findings 18.2. Historical Market Size (US$ Mn) Analysis By Region 18.2.1. North America 18.2.2. Latin America 18.2.3. Western Europe 18.2.4. Eastern Europe 18.2.5. Asia Pacific Excluding Japan 18.2.6. Japan 18.2.7. Middle East and Africa 18.3. Market Size (US$ Mn) Forecast By Region 18.4. Market Attractiveness Analysis By Region 19. Global Actinic Keratosis Treatment Market Analysis 2013–2021 and Forecast 2022–2028, By Treatment Type 19.1. Introduction/Key Finding 19.2. Historical Market Size (US$ Mn) Analysis By Treatment Type, 2013–2021 19.2.1. Topical Treatment 19.2.1.1. 5-fluorouracil Cream 19.2.1.2. Diclofenac Gel 19.2.1.3. Imiquimod Cream 19.2.1.4. Ingenol mebutate Gel 19.2.2. Procedural Modality 19.2.2.1. Chemical Peels 19.2.2.2. Cryotherapy 19.2.3. Photodynamic Therapy 19.2.4. Others 19.3. Market Size (US$ Mn) Forecast By Treatment Type, 2022–2028 19.4. Market Attractiveness Analysis By Treatment Type 20. Global Actinic Keratosis Treatment Market Analysis 2013–2021 and Forecast 2022–2028, By End User 20.1. Introduction/Key Finding 20.2. Historical Market Size (US$ Mn) Analysis By End User, 2013–2021 20.2.1. Clinical AK 20.2.2. Subclinical AK 20.3. Market Size (US$ Mn) Forecast By End User, 2022–2028 20.4. Market Attractiveness Analysis By End User 21. Global Actinic Keratosis Treatment Market Analysis 2013–2021 and Forecast 2022–2028, By End User 21.1. Introduction/Key Finding 21.2. Historical Market Size (US$ Mn) Analysis By End User, 2013–2021 21.2.1. Hospitals 21.2.2. Private Dermatology Clinics 21.2.3. Laser Therapy Centers 21.2.4. Cancer Treatment Centers 21.2.5. Spas and Rejuvenation Centers 21.2.6. Homecare 21.3. Market Size (US$ Mn) Forecast By End User, 2022–2028 21.4. Market Attractiveness Analysis By End User 22. Global Actinic Keratosis Treatment Market Analysis 2013–2021 and Forecast 2022–2028 22.1. Market Value Analysis (US$ Mn) 22.2. Absolute $ Opportunity 23. Assumptions and Acronyms Used 24. Research Methodology
Don't pay for what you don't need
Customize your report by selecting specific countries or regions and save 30%!
Table 01: Expenditure on Health, (% of GDP), by Country, 2016 – 2021 (1/2) Table 02: Expenditure on Health, (% of GDP), by Country, 2016 – 2021 (2/2) Table 03: Prescription Pattern for Actinic Keratosis Treatment Table 04: Outlook of Interval and Combination Therapies in Actinic Keratosis Treatment (1/2) Table 05: Outlook of Interval and Combination Therapies in Actinic Keratosis Treatment (2/2) Table 06: Procedure Volume of Non-invasive/Minimally Invasive Cosmetic Therapies By Major Countries (2016) (1/2) Table 07: Procedure Volume of Non-invasive/Minimally Invasive Cosmetic Therapies By Major Countries (2016) (2/2) Table 08: CPT code for Actinic Keratosis Treatment (1/4) Table 09: CPT code for Actinic Keratosis Treatment (2/4) Table 10: CPT code for Actinic Keratosis Treatment (3/4) Table 11: CPT code for Actinic Keratosis Treatment (4/4) Table 12: HCPCS code for Actinic Keratosis Treatment Table 13: North America Actinic Keratosis Treatment Market Value (US$ Mn) Analysis 2013–2021 and Forecast 2022–2028, By Country Table 14: North America Actinic Keratosis Treatment Market Value (US$ Mn) Analysis 2013–2021 and Forecast 2022–2028, By Treatment Type Table 15: North America Actinic Keratosis Treatment Market Value (US$ Mn) Analysis 2013–2021 and Forecast 2022–2028, By Disease Type Table 16: North America Actinic Keratosis Treatment Market Value (US$ Mn) Analysis 2013–2021 and Forecast 2022–2028, By End User Table 17: Latin America Actinic Keratosis Treatment Market Value (US$ Mn) Analysis 2013–2021 and Forecast 2022–2028, By Country Table 18: Latin America Actinic Keratosis Treatment Market Value (US$ Mn) Analysis 2013–2021 and Forecast 2022–2028, By Treatment Type Table 19: Latin America Actinic Keratosis Treatment Market Value (US$ Mn) Analysis 2013–2021 and Forecast 2022–2028, By Disease Type Table 20: Latin America Actinic Keratosis Treatment Market Value (US$ Mn) Analysis 2013–2021 and Forecast 2022–2028, By End User Table 21: Western Europe Actinic Keratosis Treatment Market Value (US$ Mn) Analysis 2013–2021 and Forecast 2022–2028, By Country Table 22: Western Europe Actinic Keratosis Treatment Market Value (US$ Mn) Analysis 2013–2021 and Forecast 2022–2028, By Treatment Type Table 23: Western Europe Actinic Keratosis Treatment Market Value (US$ Mn) Analysis 2013–2021 and Forecast 2022–2028, By Disease Type Table 24: Western Europe Actinic Keratosis Treatment Market Value (US$ Mn) Analysis 2013–2021 and Forecast 2022–2028, By End User Table 25: Eastern Europe Actinic Keratosis Treatment Market Value (US$ Mn) Analysis 2013–2021 and Forecast 2022–2028, By Country Table 26: Eastern Europe Actinic Keratosis Treatment Market Value (US$ Mn) Analysis 2013–2021 and Forecast 2022–2028, By Treatment Type Table 27: Eastern Europe Actinic Keratosis Treatment Market Value (US$ Mn) Analysis 2013–2021 and Forecast 2022–2028, By Disease Type Table 28: Eastern Europe Actinic Keratosis Treatment Market Value (US$ Mn) Analysis 2013–2021 and Forecast 2022–2028, By End User Table 29: APEJ Actinic Keratosis Treatment Market Value (US$ Mn) Analysis 2013–2021 and Forecast 2022–2028, By Country Table 30: APEJ Actinic Keratosis Treatment Market Value (US$ Mn) Analysis 2013–2021 and Forecast 2022–2028, By Treatment Type Table 31: APEJ Actinic Keratosis Treatment Market Value (US$ Mn) Analysis 2013–2021 and Forecast 2022–2028, By Disease Type Table 32: APEJ Actinic Keratosis Treatment Market Value (US$ Mn) Analysis 2013–2021 and Forecast 2022–2028, By End User Table 33: Japan Actinic Keratosis Treatment Market Value (US$ Mn) Analysis 2013–2021 and Forecast 2022–2028, By Treatment Type Table 34: Japan Actinic Keratosis Treatment Market Value (US$ Mn) Analysis 2013–2021 and Forecast 2022–2028, By Disease Type Table 35: Japan Actinic Keratosis Treatment Market Value (US$ Mn) Analysis 2013–2021 and Forecast 2022–2028, By End User Table 36: MEA Actinic Keratosis Treatment Market Value (US$ Mn) Analysis 2013–2021 and Forecast 2022–2028, By Country Table 37: APEJ Actinic Keratosis Treatment Market Value (US$ Mn) Analysis 2013–2021 and Forecast 2022–2028, By Treatment Type Table 38: MEA Actinic Keratosis Treatment Market Value (US$ Mn) Analysis 2013–2021 and Forecast 2022–2028, By Disease Type Table 39: MEA Actinic Keratosis Treatment Market Value (US$ Mn) Analysis 2013–2021 and Forecast 2022–2028, By End User Table 40: Global Actinic Keratosis Treatment Market Value (US$ Mn) Analysis- and Opportunity Assessment 2013–2028, By Region Table 41: Global Actinic Keratosis Treatment Market Value (US$ Mn) Analysis- and Opportunity Assessment 2013–2028, By Treatment Type Table 42: Global Actinic Keratosis Treatment Market Value (US$ Mn) Analysis- and Opportunity Assessment 2013–2028, By Disease Type Table 43: Global Actinic Keratosis Treatment Market Value (US$ Mn) Analysis- and Opportunity Assessment 2013–2028, By End User
Figure 01: Global Healthcare Expenditure in US$ Tn (2013–2020) Figure 02: Prevalence Of Actinic Keratosis Among Male in Different Degree of Latitude Figure 03: Prevalence Of Actinic Keratosis Among Female in Different Degree of Latitude Figure 04: Global Dermatology Market Overview Figure 05: Payer Mix Analysis – U.S. Figure 06: Photo Dynamic Therapy Per Session Cost (US$), By Region (2021) Figure 07: Chemical Peel Procedure Per Session Cost (US$), By Region (2021) Figure 08: Cryotherapy Procedure Cost (US$), By Region (2021) Figure 09: Topical Treatment Cost (US$), By Region (2021) Figure 10: North America Actinic Keratosis Treatment Market Value Share By Treatment Type (2022 E) Figure 11 : North America Actinic Keratosis Treatment Market Value Share By Disease Type (2022 E) Figure 12: North America Actinic Keratosis Treatment Market Value Share By End User (2022 E) Figure 13: North America Actinic Keratosis Treatment Market Value Share By Country (2022 E) Figure 14: North America Actinic Keratosis Treatment Market Value Analysis Figure 15: North America Actinic Keratosis Treatment Market Value Forecast (US$ Mn), 2022–2028 Figure 16: U.S. Actinic Keratosis Treatment Market Value Analysis (US$ Mn), 2013–2021 Figure 17: U.S. Actinic Keratosis Treatment Market Value Forecast (US$ Mn), 2022–2028 Figure 18: Canada Actinic Keratosis Treatment Market Value Analysis (US$ Mn), 2013–2021 Figure 19: Canada Actinic Keratosis Treatment Market Value Forecast (US$ Mn), 2022–2028 Figure 20: North America Actinic Keratosis Treatment Market Value (US$ Mn) Analysis 2013–2021 and Forecast 2022–2028, By Treatment Type Figure 21: North America Actinic Keratosis Treatment Market Attractiveness Analysis by Treatment Type, 2022–2028 Figure 22: North America Actinic Keratosis Treatment Market Attractiveness Analysis by Disease Type, 2022–2028 Figure 23: North America Actinic Keratosis Treatment Market Attractiveness Analysis by End User, 2022–2028 Figure 24: North America Actinic Keratosis Treatment Market Attractiveness Analysis by Country, 2022–2028 Figure 25 : Latin America Actinic Keratosis Treatment Market Value Share By Treatment Type (2022 E) Figure 26: Latin America Actinic Keratosis Treatment Market Value Share By Disease Type (2022 E) Figure 27: Latin America Actinic Keratosis Treatment Market Value Share By End User (2022 E) Figure 28: Latin America Actinic Keratosis Treatment Market Value Share By Country (2022 E) Figure 29: Latin America Actinic Keratosis Treatment Market Value Analysis Figure 30: Latin America Actinic Keratosis Treatment Market Value Forecast (US$ Mn), 2022–2028 Figure 31: Brazil Actinic Keratosis Treatment Market Value Analysis (US$ Mn), 2013–2021 Figure 32: Brazil Actinic Keratosis Treatment Market Value Forecast (US$ Mn), 2022–2028 Figure 33: Mexico Actinic Keratosis Treatment Market Value Analysis (US$ Mn), 2013–2021 Figure 34: Mexico Actinic Keratosis Treatment Market Value Forecast (US$ Mn), 2022–2028 Figure 35: Rest of Latin America Actinic Keratosis Treatment Market Value Analysis (US$ Mn), 2013–2021 Figure 36: Rest of Latin America Actinic Keratosis Treatment Market Value Forecast (US$ Mn), 2022–2028 Figure 37: Latin America Actinic Keratosis Treatment Market Value (US$ Mn) Analysis 2013–2021 and Forecast 2022–2028, By Treatment Type Figure 38: Latin America Actinic Keratosis Treatment Market Attractiveness Analysis by Treatment Type, 2022–2028 Figure 39: Latin America Actinic Keratosis Treatment Market Attractiveness Analysis by Disease Type, 2022–2028 Figure 40: Latin America Actinic Keratosis Treatment Market Attractiveness Analysis by End User, 2022–2028 Figure 41: Latin America Actinic Keratosis Treatment Market Attractiveness Analysis by Country, 2022–2028 Figure 42: Western Europe Actinic Keratosis Treatment Market Value Share By Treatment Type (2022 E) Figure 43: Western Europe Actinic Keratosis Treatment Market Value Share By Disease Type (2022 E) Figure 44: Western Europe Actinic Keratosis Treatment Market Value Share By End User (2022 E) Figure 45: Western Europe Actinic Keratosis Treatment Market Value Share By Country (2022 E) Figure 46: Western Europe Actinic Keratosis Treatment Market Value Analysis Figure 47: Western Europe Actinic Keratosis Treatment Market Value Forecast (US$ Mn), 2022–2028 Figure 48: U.K. Actinic Keratosis Treatment Market Value Analysis (US$ Mn), 2013–2021 Figure 49: U.K. Actinic Keratosis Treatment Market Value Forecast (US$ Mn), 2022–2028 Figure 50: Germany Actinic Keratosis Treatment Market Value Analysis (US$ Mn), Figure 51: Germany Actinic Keratosis Treatment Market Value Forecast (US$ Mn), 2022–2028 Figure 52: France Actinic Keratosis Treatment Market Value Analysis (US$ Mn), 2013–2021 Figure 53: France Actinic Keratosis Treatment Market Value Forecast (US$ Mn), 2022–2028 Figure 54: Italy Actinic Keratosis Treatment Market Value Analysis (US$ Mn), Figure 55: Italy Actinic Keratosis Treatment Market Value Forecast (US$ Mn), 2022–2028 Figure 56: Spain Actinic Keratosis Treatment Market Value Analysis (US$ Mn), 2013–2021 Figure 57: Spain Actinic Keratosis Treatment Market Value Forecast (US$ Mn), 2022–2028 Figure 58: Rest of Western Europe Actinic Keratosis Treatment Market Value Analysis (US$ Mn), Figure 59: Rest of Western Europe Actinic Keratosis Treatment Market Value Forecast (US$ Mn), 2022–2028 Figure 60: Western Europe Actinic Keratosis Treatment Market Value (US$ Mn) Analysis 2013–2021 and Forecast 2022–2028, By Treatment Type Figure 61: Western Europe Actinic Keratosis Treatment Market Attractiveness Analysis by Treatment Type, 2022–2028 Figure 62: Western Europe Actinic Keratosis Treatment Market Attractiveness Analysis by Disease Type, 2022–2028 Figure 63: Western Europe Actinic Keratosis Treatment Market Attractiveness Analysis by End User, 2022–2028 Figure 64: Western Europe Actinic Keratosis Treatment Market Attractiveness Analysis by Country, 2022–2028 Figure 65: Eastern Europe Actinic Keratosis Treatment Market Value Share By Treatment Type (2022 E) Figure 66: Eastern Europe Actinic Keratosis Treatment Market Value Share By Disease Type (2022 E) Figure 67: Eastern Europe Actinic Keratosis Treatment Market Value Share By End User (2022 E) Figure 68: Eastern Europe Actinic Keratosis Treatment Market Value Share By Country (2022 E) Figure 69: Eastern Europe Actinic Keratosis Treatment Market Value Analysis Figure 70: Eastern Europe Actinic Keratosis Treatment Market Value Forecast (US$ Mn), 2022–2028 Figure 71: Russia Actinic Keratosis Treatment Market Value Analysis (US$ Mn), 2013–2021 Figure 72: Russia Actinic Keratosis Treatment Market Value Forecast (US$ Mn), 2022–2028 Figure 73: Poland Actinic Keratosis Treatment Market Value Analysis (US$ Mn), 2013–2021 Figure 74: Poland Actinic Keratosis Treatment Market Value Forecast (US$ Mn), 2022–2028 Figure 75: Rest of Eastern Europe Actinic Keratosis Treatment Market Value Analysis (US$ Mn), 2013–2021 Figure 76: Rest of Eastern Europe Actinic Keratosis Treatment Market Value Forecast (US$ Mn), 2022–2028 Figure 77: Eastern Europe Actinic Keratosis Treatment Market Value (US$ Mn) Analysis 2013–2021 and Forecast 2022–2028, By Treatment Type Figure 78: Eastern Europe Actinic Keratosis Treatment Market Attractiveness Analysis by Treatment Type, 2022–2028 Figure 79: Eastern Europe Actinic Keratosis Treatment Market Attractiveness Analysis by Disease Type, 2022–2028 Figure 80: Eastern Europe Actinic Keratosis Treatment Market Attractiveness Analysis by End User, 2022–2028 Figure 81: Eastern Europe Actinic Keratosis Treatment Market Attractiveness Analysis by Country, 2022–2028 Figure 82: APEJ Actinic Keratosis Treatment Market Value Share By Treatment Type (2022 E) Figure 83: APEJ Actinic Keratosis Treatment Market Value Share By Disease Type (2022 E) Figure 84: APEJ Actinic Keratosis Treatment Market Value Share By End User (2022 E) Figure 85: APEJ Actinic Keratosis Treatment Market Value Share By Country (2022 E) Figure 86: APEJ Actinic Keratosis Treatment Market Value Analysis Figure 87: APEJ Actinic Keratosis Treatment Market Value Forecast (US$ Mn), 2022–2028 Figure 88: India Actinic Keratosis Treatment Market Value Analysis (US$ Mn), 2013–2021 Figure 89: India Actinic Keratosis Treatment Market Value Forecast (US$ Mn), 2022–2028 Figure 90: Australia & NZ Actinic Keratosis Treatment Market Value Analysis (US$ Mn), Figure 91: Australia & NZ Actinic Keratosis Treatment Market Value Forecast (US$ Mn), 2022–2028 Figure 92: China Actinic Keratosis Treatment Market Value Analysis (US$ Mn), 2013–2021 Figure 93: China Actinic Keratosis Treatment Market Value Forecast (US$ Mn), 2022–2028 Figure 94: ASEAN Actinic Keratosis Treatment Market Value Analysis (US$ Mn), Figure 95: ASEAN Actinic Keratosis Treatment Market Value Forecast (US$ Mn), 2022–2028 Figure 96: Rest of APEJ Actinic Keratosis Treatment Market Value Analysis (US$ Mn), 2013–2021 Figure 97: Rest of APEJ Actinic Keratosis Treatment Market Value Forecast (US$ Mn), 2022–2028 Figure 98: APEJ Actinic Keratosis Treatment Market Value (US$ Mn) Analysis 2013–2021 and Forecast 2022–2028, By Treatment Type Figure 99: APEJ Actinic Keratosis Treatment Market Attractiveness Analysis by Treatment Type, 2022–2028 Figure 100: APEJ Actinic Keratosis Treatment Market Attractiveness Analysis by Disease Type, 2022–2028 Figure 101: APEJ Actinic Keratosis Treatment Market Attractiveness Analysis by End User, 2022–2028 Figure 102: APEJ Actinic Keratosis Treatment Market Attractiveness Analysis by Country, 2022–2028 Figure 103: Japan Actinic Keratosis Treatment Market Value Share By Treatment Type (2022 E) Figure 104: Japan Actinic Keratosis Treatment Market Value Share By Disease Type (2022 E) Figure 105: Japan Actinic Keratosis Treatment Market Value Share By End User (2022 E) Figure 106: Japan Actinic Keratosis Treatment Market Value Analysis Figure 107: Japan Actinic Keratosis Treatment Market Value Forecast (US$ Mn), 2022–2028 Figure 108: Japan Actinic Keratosis Treatment Market Value (US$ Mn) Analysis 2013–2021 and Forecast 2022–2028, By Treatment Type Figure 109: Japan Actinic Keratosis Treatment Market Attractiveness Analysis by Treatment Type, 2022–2028 Figure 110: Japan Actinic Keratosis Treatment Market Attractiveness Analysis by End User, 2022–2028 Figure 111: Japan Actinic Keratosis Treatment Market Attractiveness Analysis by Disease Type, 2022–2028 Figure 112: MEA Actinic Keratosis Treatment Market Value Share By Treatment Type (2022 E) Figure 113: MEA Actinic Keratosis Treatment Market Value Share By Disease Type (2022 E) Figure 114: MEA Actinic Keratosis Treatment Market Value Share By End User (2022 E) Figure 115: MEA Actinic Keratosis Treatment Market Value Share By Country (2022 E) Figure 116: MEA Actinic Keratosis Treatment Market Value Analysis Figure 117: MEA Actinic Keratosis Treatment Market Value Forecast (US$ Mn), 2022–2028 Figure 118: South Africa Actinic Keratosis Treatment Market Value Analysis (US$ Mn), 2013–2021 Figure 119: South Africa Actinic Keratosis Treatment Market Value Forecast (US$ Mn), 2022–2028 Figure 120: GCC Countries Actinic Keratosis Treatment Market Value Analysis (US$ Mn), Figure 121: GCC Countries Actinic Keratosis Treatment Market Value Forecast (US$ Mn), 2022–2028 Figure 122: Rest of MEA Actinic Keratosis Treatment Market Value Analysis (US$ Mn), 2013–2021 Figure 123: Rest of MEA Actinic Keratosis Treatment Market Value Forecast (US$ Mn), 2022–2028 Figure 124: MEA Actinic Keratosis Treatment Market Value (US$ Mn) Analysis 2013–2021 and Forecast 2022–2028, By Treatment Type Figure 125: MEA Actinic Keratosis Treatment Market Attractiveness Analysis by Treatment Type, 2022–2028 Figure 126: MEA Actinic Keratosis Treatment Market Attractiveness Analysis by Disease Type, 2022–2028 Figure 127: MEA Actinic Keratosis Treatment Market Attractiveness Analysis by End User, 2022–2028 Figure 128: MEA Actinic Keratosis Treatment Market Attractiveness Analysis by Country, 2022–2028 Figure 129: Global Photodynamic Therapy Market: Brand Share Analysis Share Analysis (2021) Figure 130: Global Actinic Keratosis Treatment Market Share Analysis (%), By Region, 2022 & 2028 Figure 131: Global Actinic Keratosis Treatment Market Y-o-Y Analysis (%), By Region, 2022–2028 Figure 132: Global Actinic Keratosis Treatment Market Attractiveness Analysis by Region, 2022–2028 Figure 133: Global Actinic Keratosis Treatment Market Attractiveness Analysis by Region, 2022–2028 Figure 134: Global Actinic Keratosis Treatment Market Share Analysis (%), By Treatment Type, 2022 & 2028 Figure 135: Global Actinic Keratosis Treatment Market Y-o-Y Analysis (%), By Treatment Type, 2022–2028 Figure 136: Global Actinic Keratosis Treatment Market Attractiveness Analysis by Treatment Type, 2022–2028 Figure 137: Global Actinic Keratosis Treatment Market Share Analysis (%), By Disease Type, 2022 & 2028 Figure 138: Global Actinic Keratosis Treatment Market Y-o-Y Analysis (%), By Disease Type, 2022–2028 Figure 139: Global Actinic Keratosis Treatment Market Attractiveness Analysis by Disease Type, 2022–2028 Figure 140: Global Actinic Keratosis Treatment Market Share Analysis (%), By End User, 2022 & 2028 Figure 141: Global Actinic Keratosis Treatment Market Y-o-Y Analysis (%), By End User, 2022–2028 Figure 142: Global Actinic Keratosis Treatment Market Attractiveness Analysis by End User, 2022–2028 Figure 143: Global Actinic Keratosis Treatment Market Value Analysis (US$ Mn), 2013–2021 Figure 144: Global Actinic Keratosis Treatment Market Value Forecast (US$ Mn), Figure 145: Global Actinic Keratosis Treatment Market Absolute $ Opportunity, 2022–2028
Recommendations
Explore Healthcare Insights
View Reports