Agricultural Tractors Market Size, Share, and Forecast Outlook 2025 to 2035

The agricultural tractors market stands at USD 65 billion in 2025 and is likely to reach USD 119 billion by 2035, growing at a CAGR of 6.2%.
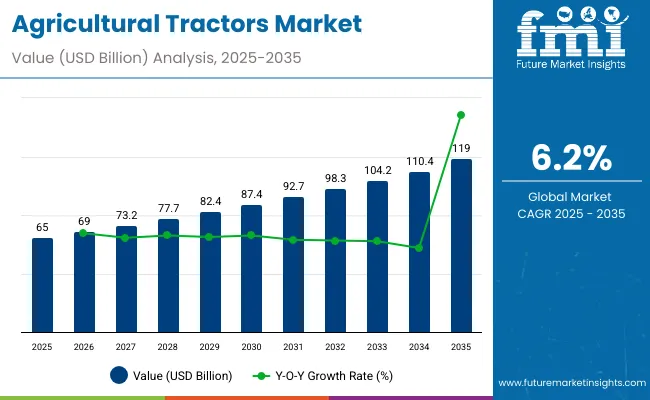
Quick Stats of Agricultural Tractors Market

  • Agricultural Tractors Market Size (2025): USD 65 billion
  • Projected Agricultural Tractors Market Size (2035): USD 119 billion
  • Forecast CAGR of Agricultural Tractors Market (2025 to 2035): 6.2%
  • Leading Segment of Agricultural Tractors Market (2025): 41 to 100 HP engine power
  • Key Growth Regions of Agricultural Tractors Market: North America, Europe, Asia Pacific
  • Top Key Players of Agricultural Tractors Market: Deere & Company, AGCO Corporation, CLAAS KGaAmbH

Agricultural Tractors Market

Metric Value
Industry Size (2025E) USD 65 billion
Industry Value (2035F) USD 119 billion
CAGR (2025 to 2035) 6.2%

Analysis of elasticity of growth versus macroeconomic indicators shows that market expansion is closely linked to factors such as GDP growth in agricultural economies, farm income levels, commodity prices, and investment in rural infrastructure. In regions with robust economic growth and supportive agricultural policies, tractor sales respond strongly, reflecting high elasticity, whereas in economies experiencing slower growth or commodity price volatility, demand demonstrates lower sensitivity, moderating overall expansion.

Tractor adoption is also influenced by mechanization trends, credit availability for farmers, and government subsidies or incentive programs. During periods of favorable economic conditions, growth accelerates as farmer’s upgrade fleets and expand operations, while downturns or inflationary pressures can temporarily constrain purchases. Seasonal patterns and crop cycles further affect short-term demand, adding layers of variability in elasticity. By 2035, with the market projected to reach 119 billion, understanding the relationship between macroeconomic indicators and tractor demand will be crucial for manufacturers and investors to align production, inventory, and financing strategies. This approach ensures resilience against cyclical pressures while capturing long-term growth opportunities, indicating how macroeconomic dynamics shape the trajectory of the agricultural tractors market.

The agricultural tires market is growing in response to mechanization and precision farming. Global tractor production exceeded 3.2 million units in 2024, driving demand for high-performance tires. Radial tires now constitute around 55% of market volume, offering improved traction and reduced soil compaction. Advanced tread patterns and reinforced sidewalls are increasing tire lifespan by 15-20%, reducing replacement frequency. The adoption of GPS-compatible tires for precision farming equipment has risen by 22% year-on-year, supporting optimized planting and harvesting operations. Manufacturers are investing in eco-friendly rubber compounds and tubeless designs to enhance fuel efficiency and minimize maintenance costs. Strategic alliances between tire producers and OEMs are expanding production capacity to meet projected CAGR of 5-6% through 2030.

The industry is supported by multiple upstream sectors. Tractor and farm machinery manufacturing accounts for approximately 42%, as tires are integral to the performance and efficiency of modern agricultural equipment. Rubber and tire manufacturing contributes around 28%, supplying specialty compounds designed for load-bearing and traction. Agricultural equipment dealers and distributors represent roughly 15%, managing distribution, replacement, and aftermarket services. Research and development in materials and tread design holds close to 10%, focusing on improving durability, fuel efficiency, and soil protection. Maintenance and service providers make up the remaining 5%, ensuring timely repairs and longevity of tire performance.

Top Agricultural Tractors Market Dynamics

Market growth is fueled by the rising adoption of mechanized farming equipment, high-horsepower tractors, and expansion of large-scale agriculture in emerging economies. Utility tractors dominate the market with roughly 60% share, while specialty tractors for vineyards, orchards, and rice paddies account for the remainder. Tractor replacement cycles range from 8 to 12 years, supporting steady aftermarket demand. North America and Europe account for approximately 55% of global consumption, while Asia Pacific shows rapid growth driven by government subsidies, rising crop production, and the expansion of smallholder and commercial farms.

Driving Force Mechanization and Farm Productivity

Mechanization is a primary driver of agricultural tractor demand, increasing operational efficiency across plowing, planting, and harvesting. Modern tractors with advanced engines reduce fuel consumption by up to 10% per hectare while delivering 25-40% faster field operations. GPS-guided steering and precision farming technology enable farmers to optimize yield and lower labor requirements. Government incentive programs in countries like India, China, and Brazil cover up to 30% of tractor purchase costs, encouraging small and medium-scale farmers to adopt modern machinery. Increased focus on sustainable and efficient farming practices is further boosting tractor adoption in both developed and developing regions.

Growth Opportunity Specialty Tractors and Aftermarket Services

Specialty tractors designed for orchards, vineyards, and hilly or wetland terrains are creating new market opportunities. Compact and narrow-track models enhance productivity in small plots and difficult landscapes. Aftermarket services such as on-farm maintenance, spare parts supply, and equipment retrofitting provide recurring revenue streams. IoT-enabled monitoring systems track fuel usage, engine health, and operational efficiency, supporting precision agriculture practices. Expansion of mechanized farming in Asia Pacific, Latin America, and Africa is driving demand for both utility and specialty tractors, while partnerships between manufacturers and equipment providers enable bundled solutions that improve efficiency and reduce total cost of ownership.

Emerging Trend Electric and Autonomous Tractors

Electric and hybrid tractors are entering the market, especially for low-horsepower and specialty applications. Battery-powered tractors reduce fuel costs by up to 20% and lower carbon emissions. Autonomous and semi-autonomous tractors equipped with AI-based navigation, GPS guidance, and obstacle detection increase efficiency and reduce operator workload by nearly 50%. Adoption of smart farming equipment, robotics, and autonomous machinery is expected to accelerate in North America, Europe, and Asia Pacific, complementing trends in precision agriculture and sustainable farming practices.

Market Challenge High Investment and Supply Constraints

High upfront costs remain a barrier, with compact tractors priced around USD 15,000 and high-horsepower models exceeding USD 250,000. Annual maintenance, spare parts, and skilled labor add 10-15% to operating costs. Smallholder farmers in emerging markets may delay purchases due to affordability challenges. Supply chain constraints for engines, transmissions, and electronic components can extend lead times by 4-8 weeks. Price fluctuations in steel, rubber, and diesel also affect production and operational costs, making timely delivery and cost management crucial for manufacturers and buyers.

Analyzing Agricultural Tractors Market by Top Investment Segments

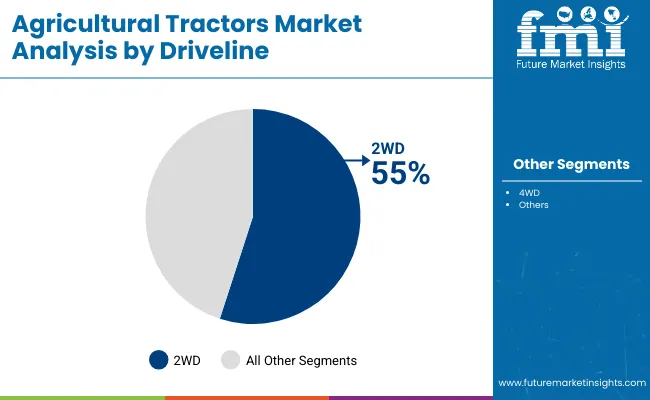
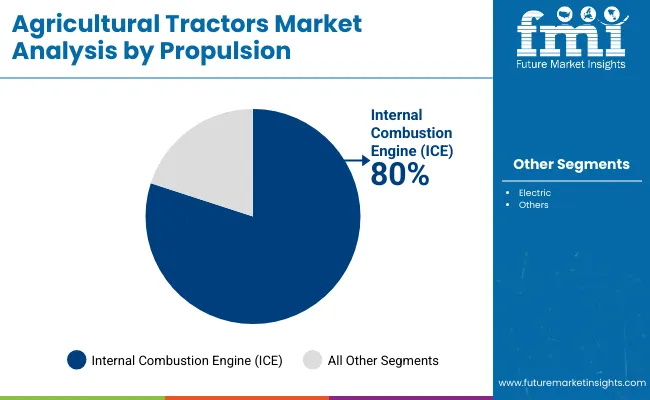
Tractors with engine power of 41 to 100 HP dominate the market with 45% share, followed by more than 100 HP at 35% and less than 40 HP at 20%. 2WD driveline tractors hold 55% of market share, while 4WD tractors contribute 45%. Internal Combustion Engine (ICE) tractors account for 80% of demand, and electric tractors 20%. Key OEMs such as John Deere, Mahindra, AGCO, and CNH Industrial supply tractors globally. Market growth is driven by reliability, fuel efficiency, durability, and operational versatility across small-scale and commercial farming operations.
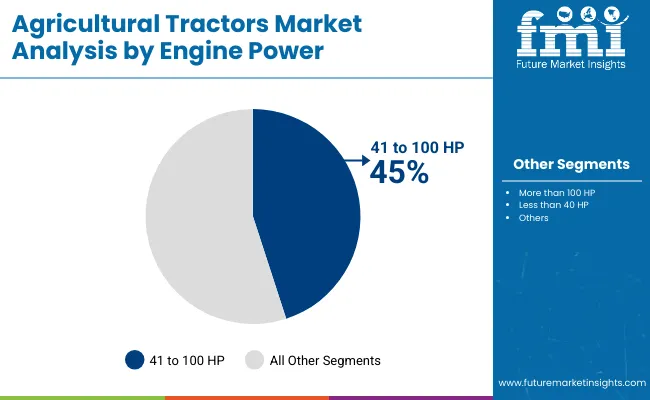
41 To 100 HP, More Than 100 HP, And Less Than 40 HP Lead Engine Power Segment

Agricultural Tractors Market By Engine

Tractors with 41 to 100 HP dominate engine power demand with 45% share, ideal for small to medium-scale farms requiring balanced fuel efficiency and operational capacity. Tractors exceeding 100 HP account for 35%, used in large farms and intensive agricultural operations. Less than 40 HP tractors contribute 20%, primarily in subsistence farming or horticultural applications. John Deere, Mahindra, AGCO, and CNH Industrial are key manufacturers. Engine selection is critical for matching field requirements, terrain, and workload. High adoption of 41-100 HP tractors is driven by mechanization in developing regions, while high-power tractors meet large-scale commercial needs.
  • John Deere supplies 40% of 41-100 HP tractors globally
  • Mahindra provides 35% of more than 100 HP tractors for commercial farming
  • AGCO delivers 25% of less than 40 HP tractors for small-scale farms

2WD and 4WD Driveline Tractors Drive Market Growth

Agricultural Tractors Market By Driveline

2WD tractors dominate with 55% share, offering lower cost, ease of maintenance, and suitability for flat terrain. 4WD tractors hold 45% share, preferred for hilly terrain, heavy workloads, and better traction in wet or uneven fields. OEMs including John Deere, CNH Industrial, and Mahindra manufacture both 2WD and 4WD variants to cater to commercial and small-scale farmers. 2WD adoption is higher in regions with moderate soil compaction and light-to-medium tasks, while 4WD tractors support large farms requiring plowing, tilling, and high-load transport. The segment is driven by terrain adaptability, operational efficiency, and demand for versatile agricultural machinery.
  • John Deere supplies 50% of 2WD tractors for commercial and small-scale farms
  • CNH Industrial delivers 45% of 4WD tractors for heavy-duty applications
  • Mahindra provides 30% of mixed 2WD/4WD tractors across Asia and Africa

ICE and Electric Propulsion Types Lead Tractors Market

Agricultural Tractors Market By Propulsion

Internal Combustion Engine (ICE) tractors dominate propulsion demand with 80% share, offering high power density, field endurance, and ease of refueling. Electric tractors account for 20%, emerging in small-scale farms, controlled environments, and regions emphasizing low emissions. OEMs including John Deere, Mahindra, and AGCO provide ICE tractors for diverse applications, while Tesla, Fendt, and smaller innovators experiment with electric tractors for niche markets. ICE tractors remain the preferred choice for large-scale and high-intensity operations, whereas electric tractors grow due to cost reduction in battery technology, environmental policies, and low-maintenance requirements. The propulsion mix influences operational cost, efficiency, and sustainability for modern farming.
  • John Deere supplies 50% of ICE tractors globally for commercial operations
  • Mahindra provides 35% of ICE tractors in Asia and Africa
  • Fendt delivers 25% of electric tractors for controlled-environment and small-farm applications

Top Countries Expanding, Producing, and Deploying in the Agricultural Tractors Market

Agricultural Tractors Market By Country

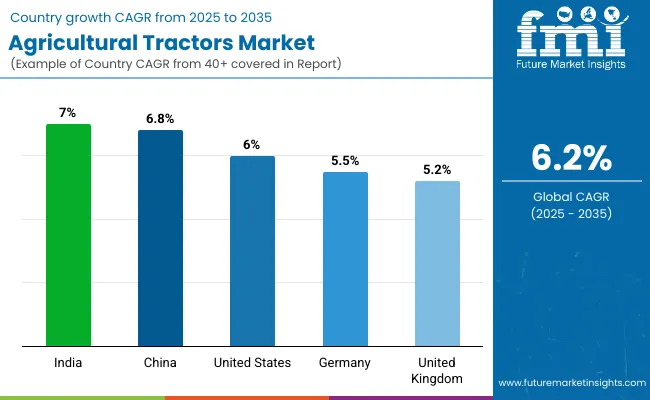
In 2025, the global agricultural tractors market is growing at a CAGR of 6.2% through 2035. India leads at 7.0%, +13% above the global average, supported by BRICS and ASEAN-linked growth in mechanized farming and rising demand for high-capacity tractors. China follows at 6.8%, +10% higher than the global rate, driven by BRICS-focused expansion of commercial farms and domestic tractor manufacturing. The United States records 6.0%, slightly below the global CAGR, reflecting steady adoption in OECD farming operations and gradual modernization of equipment. Germany stands at 5.5%, −11% under the global benchmark, influenced by a mature agricultural sector and incremental fleet upgrades. The United Kingdom posts 5.2%, −16% below the global rate, shaped by steady replacement cycles and moderate adoption of new tractor technologies. The BRICS nations are leading volume growth, while OECD countries maintain consistent development through equipment improvement and technological integration.

Market Growth Analysis of Agricultural Tractors in India

The agricultural tractors market in India grows at a CAGR of 7.0%, driven by mechanization across approximately 60 million hectares of rice, wheat, and sugarcane farms. Northern states lead adoption with high-traction tractors supporting sowing, plowing, and irrigation, while central and southern regions favor medium-power tractors for multi-crop operations. Mahindra & Mahindra dominates the market with models optimized for waterlogged and soft soils. Mechanized farms integrating GPS-guided implements have achieved a 25% improvement in operational efficiency. By 2035, more than 1.8 million tractors are projected in use. Investment in precision implements and soil-optimized tires reduces labor dependency, improves yield per hectare, and enhances long-term equipment durability.

  • Precision implements increase sowing and plowing accuracy
  • High-traction tires improve maneuverability in soft and wet soils
  • GPS-enabled tractors optimize resource management and reduce downtime

Demand Forecast for Agricultural Tractors in China

The Demand of agricultural tractors in China market grows at a CAGR of 6.8%, driven by mechanized cultivation across 120 million hectares of rice, wheat, and corn farms. High-horsepower tractors with modular implement systems support plowing, soil preparation, and harvesting efficiency. YTO Group supplies durable tractors suitable for flat plains, hilly terrains, and wetland areas. Adoption of automated seeding, GPS guidance, and precision fertilizer application has reduced labor requirements by 20% and increased yield per hectare. Mechanized farms integrate tractors with reinforced tires to handle waterlogged and high-altitude fields. By 2035, more than 2 million tractors are expected in operation, improving field efficiency, resource allocation, and crop output reliability.

  • Modular implements support multi-crop operations efficiently
  • GPS-guided systems reduce input waste and improve yield
  • Durable tractors enable reliable operations across wetlands and hilly terrains

Analysis of Agricultural Tractors Market in the United States

The United States agricultural tractors market grows at a CAGR of 6.0%, concentrated on industrial-scale corn, wheat, and soybean farms covering 80 million hectares. High-horsepower tractors with four-wheel drive and advanced hydraulic systems improve plowing, harvesting, and implement versatility. John Deere leads the market with GPS-enabled and telematics-equipped tractors that monitor performance and optimize maintenance. Deployment is concentrated in the Midwest with large acreage farms, while southern farms use compact models for smaller plots. Integration with precision implements has increased operational productivity and reduced labor costs. By 2035, over 1.5 million tractors are expected in active operation, supporting soil management and long-term farm efficiency.

  • Telemetry systems optimize maintenance scheduling and reduce downtime
  • Hydraulic systems enhance multi-implement operations
  • GPS-enabled tractors improve plowing and harvesting accuracy

Future Outlook for Agricultural Tractors in Germany

The agricultural tractors market in Germany grows at a CAGR of 5.5%, focused on arable lands, orchards, and dairy farms spanning 10 million hectares. Fendt dominates with low-emission, fuel-efficient tractors equipped with low-compaction tires and precision implements. Deployment emphasizes vineyards, orchards, and pasture farms where minimal soil disruption is critical. Integration of GPS-guided implements has improved plowing efficiency by 12% and reduced fuel consumption. By 2035, over 900,000 tractors are expected to be operational. Advanced monitoring and precision farming tools allow optimized scheduling, resource allocation, and soil conservation across mechanized operations.

  • Low-emission engines reduce fuel consumption and environmental impact
  • Precision implements improve operational planning and efficiency
  • Low-compaction tires protect soils in orchards and pasturelands

Premium Forecast of Agricultural Tractors in the United Kingdom

The United Kingdom agricultural tractors market grows at a CAGR of 5.2%, concentrated on livestock, arable, and mechanized dairy farms spanning 7 million hectares. Tractors equipped with modular implements, four-wheel drive, and durable tires support wet and soft soil conditions. JCB and Massey Ferguson dominate the market with fuel-efficient, high-durability tractors. GPS and telemetry-enabled systems allow real-time monitoring and predictive maintenance. By 2035, over 750,000 tractors are expected to be deployed, supporting multi-task farm operations and improved resource allocation. Soil protection, traction optimization, and implement versatility enhance operational efficiency and long-term equipment reliability.
  • Telemetry systems provide real-time performance monitoring and predictive insights
  • Multi-functional implements increase operational efficiency across crop types
  • Durable tires maintain traction and performance in wet or soft-field conditions

Leading Agricultural Tractors Manufacturers, Suppliers, Distributors

Agricultural Tractors Market By Company

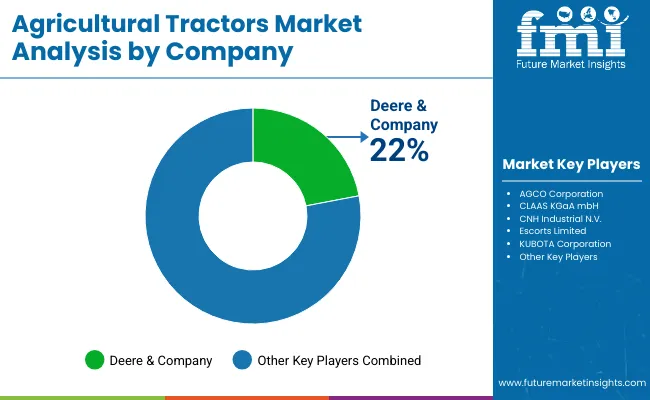
Deere & Company is the leading player, known for its extensive portfolio of models, strong global distribution network, and focus on operator comfort, fuel efficiency, and precision farming features. Continuous product development and partnerships with OEMs allow the company to maintain its competitive edge in both developed and emerging markets.

AGCO Corporation and CLAAS KGaAmbH provide tractors for small to large-scale farming, offering durable machines suited for varied terrains. CNH Industrial N.V. focuses on high-powered tractors with advanced hydraulics and transmission systems, while KUBOTA Corporation and Escorts Limited serve mid-range and compact segments, particularly in Asia and other emerging regions.

Other key players strengthen the market by emphasizing innovative designs, regional presence, and specialized solutions. They focus on enhancing tractor efficiency, performance, and longevity to meet evolving agricultural requirements. By offering operator-friendly cabins, versatile attachments, and robust engines, these companies collectively address the needs of modern agriculture, supporting productivity and operational reliability across diverse farm operations. Strategic collaborations and continuous R&D initiatives remain central to sustaining market competitiveness.

Leading Players

  • Deere & Company
  • AGCO Corporation
  • CLAAS KGaAmbH
  • CNH Industrial N.V.
  • Escorts Limited
  • KUBOTA Corporation

Report Scope

Report Attributes Details
Market Size (2025) USD 65 billion
Projected Market Size (2035) USD 119 billion
CAGR (2025 to 2035) 6.2%
Base Year for Estimation 2024
Historical Period 2020 to 2024
Projection Period 2025 to 2035
Quantitative Units USD billion for value
Engine Power Segments (Segment 1) Less than 40 HP, 41 to 100 HP, More than 100 HP
Driveline Segments (Segment 2) 2WD, 4WD
Propulsion Segments (Segment 3) Electric, ICE
Regions Covered North America, Europe, Asia Pacific, Latin America, Middle East & Africa
Countries Covered United States, Canada, Brazil, Mexico, Germany, France, Italy, United Kingdom, China, India, Japan, Australia, South Africa, UAE
Leading Players Deere & Company, AGCO Corporation, CLAAS KGaA mbH, CNH Industrial N.V., Escorts Limited, KUBOTA Corporation
Additional Attributes Dollar sales by engine power and driveline, demand dynamics across small, medium, and large tractors, regional adoption trends across North America, Europe, and Asia-Pacific, innovation in electric propulsion and telematics, environmental impact of emissions, and emerging use in precision farming and autonomous tractor solutions

Agricultural Tractors Market Analyzed by Key Investment Segments 

By Engine Power:

  • Less than 40 HP
  • 41 to 100 HP
  • More than 100 HP

By Driveline:

  • 2WD
  • 4WD

By Propulsion:

  • Electric
  • ICE

By Region:

  • North America
  • Europe
  • Asia Pacific
  • Latin America
  • Middle East and Africa

Table of Content

  1. Executive Summary
    • Global Market Outlook
    • Demand-side Trends
    • Supply-side Trends
    • Technology Roadmap Analysis
    • Analysis and Recommendations
  2. Market Overview
    • Market Coverage / Taxonomy
    • Market Definition / Scope / Limitations
  3. Market Background
    • Market Dynamics
      • Drivers
      • Restraints
      • Opportunity
      • Trends
    • Scenario Forecast
      • Demand in Optimistic Scenario
      • Demand in Likely Scenario
      • Demand in Conservative Scenario
    • Opportunity Map Analysis
    • Product Life Cycle Analysis
    • Supply Chain Analysis
      • Supply Side Participants and their Roles
        • Producers
        • Mid-Level Participants (Traders/ Agents/ Brokers)
        • Wholesalers and Distributors
      • Value Added and Value Created at Node in the Supply Chain
      • List of Raw Material Suppliers
      • List of Existing and Potential Buyer’s
    • Investment Feasibility Matrix
    • Value Chain Analysis
      • Profit Margin Analysis
      • Wholesalers and Distributors
      • Retailers
    • PESTLE and Porter’s Analysis
    • Regulatory Landscape
      • By Key Regions
      • By Key Countries
    • Regional Parent Market Outlook
    • Production and Consumption Statistics
    • Import and Export Statistics
  4. Global Market Analysis 2020 to 2024 and Forecast, 2025 to 2035
    • Historical Market Size Value (US$ Bn) & Volume (Thousand Units) Analysis, 2020 to 2024
    • Current and Future Market Size Value (US$ Bn) & Volume (Thousand Units) Projections, 2025 to 2035
      • Y-o-Y Growth Trend Analysis
      • Absolute $ Opportunity Analysis
  5. Global Market Pricing Analysis 2020 to 2024 and Forecast 2025 to 2035
  6. Global Market Analysis 2020 to 2024 and Forecast 2025 to 2035, By Engine Power
    • Introduction / Key Findings
    • Historical Market Size Value (US$ Bn) & Volume (Thousand Units) Analysis By Engine Power, 2020 to 2024
    • Current and Future Market Size Value (US$ Bn) & Volume (Thousand Units) Analysis and Forecast By Engine Power, 2025 to 2035
      • 41 to 100 HP
      • More than 100 HP
      • Less than 40 HP
    • Y-o-Y Growth Trend Analysis By Engine Power, 2020 to 2024
    • Absolute $ Opportunity Analysis By Engine Power, 2025 to 2035
  7. Global Market Analysis 2020 to 2024 and Forecast 2025 to 2035, By Driveline
    • Introduction / Key Findings
    • Historical Market Size Value (US$ Bn) & Volume (Thousand Units) Analysis By Driveline, 2020 to 2024
    • Current and Future Market Size Value (US$ Bn) & Volume (Thousand Units) Analysis and Forecast By Driveline, 2025 to 2035
      • 2WD
      • 4WD
    • Y-o-Y Growth Trend Analysis By Driveline, 2020 to 2024
    • Absolute $ Opportunity Analysis By Driveline, 2025 to 2035
  8. Global Market Analysis 2020 to 2024 and Forecast 2025 to 2035, By Propulsion Type
    • Introduction / Key Findings
    • Historical Market Size Value (US$ Bn) & Volume (Thousand Units) Analysis By Propulsion Type, 2020 to 2024
    • Current and Future Market Size Value (US$ Bn) & Volume (Thousand Units) Analysis and Forecast By Propulsion Type, 2025 to 2035
      • Internal Combustion Engine (ICE)
      • Electric
    • Y-o-Y Growth Trend Analysis By Propulsion Type, 2020 to 2024
    • Absolute $ Opportunity Analysis By Propulsion Type, 2025 to 2035
  9. Global Market Analysis 2020 to 2024 and Forecast 2025 to 2035, By Region
    • Introduction
    • Historical Market Size Value (US$ Bn) & Volume (Thousand Units) Analysis By Region, 2020 to 2024
    • Current Market Size Value (US$ Bn) & Volume (Thousand Units) Analysis and Forecast By Region, 2025 to 2035
      • North America
      • Latin America
      • Western Europe
      • Eastern Europe
      • East Asia
      • South Asia & Pacific
      • Middle East and Africa
    • Market Attractiveness Analysis By Region
  10. North America Market Analysis 2020 to 2024 and Forecast 2025 to 2035, By Country
    • Historical Market Size Value (US$ Bn) & Volume (Thousand Units) Trend Analysis By Market Taxonomy, 2020 to 2024
    • Market Size Value (US$ Bn) & Volume (Thousand Units) Forecast By Market Taxonomy, 2025 to 2035
      • By Country
        • USA
        • Canada
        • Mexico
      • By Engine Power
      • By Driveline
      • By Propulsion Type
    • Market Attractiveness Analysis
      • By Country
      • By Engine Power
      • By Driveline
      • By Propulsion Type
    • Key Takeaways
  11. Latin America Market Analysis 2020 to 2024 and Forecast 2025 to 2035, By Country
    • Historical Market Size Value (US$ Bn) & Volume (Thousand Units) Trend Analysis By Market Taxonomy, 2020 to 2024
    • Market Size Value (US$ Bn) & Volume (Thousand Units) Forecast By Market Taxonomy, 2025 to 2035
      • By Country
        • Brazil
        • Argentina
        • Rest of LATAM
      • By Engine Power
      • By Driveline
      • By Propulsion Type
    • Market Attractiveness Analysis
      • By Country
      • By Engine Power
      • By Driveline
      • By Propulsion Type
    • Key Takeaways
  12. Western Europe Market Analysis 2020 to 2024 and Forecast 2025 to 2035, By Country
    • Historical Market Size Value (US$ Bn) & Volume (Thousand Units) Trend Analysis By Market Taxonomy, 2020 to 2024
    • Market Size Value (US$ Bn) & Volume (Thousand Units) Forecast By Market Taxonomy, 2025 to 2035
      • By Country
        • Germany
        • Italy
        • France
        • UK
        • Spain
        • BENELUX
        • Nordic
        • Rest of W.Europe
      • By Engine Power
      • By Driveline
      • By Propulsion Type
    • Market Attractiveness Analysis
      • By Country
      • By Engine Power
      • By Driveline
      • By Propulsion Type
    • Key Takeaways
  13. Eastern Europe Market Analysis 2020 to 2024 and Forecast 2025 to 2035, By Country
    • Historical Market Size Value (US$ Bn) & Volume (Thousand Units) Trend Analysis By Market Taxonomy, 2020 to 2024
    • Market Size Value (US$ Bn) & Volume (Thousand Units) Forecast By Market Taxonomy, 2025 to 2035
      • By Country
        • Russia
        • Hungary
        • Poland
        • Balkan & Baltics
        • Rest of E. Europe
      • By Engine Power
      • By Driveline
      • By Propulsion Type
    • Market Attractiveness Analysis
      • By Country
      • By Engine Power
      • By Driveline
      • By Propulsion Type
    • Key Takeaways
  14. East Asia Market Analysis 2020 to 2024 and Forecast 2025 to 2035, By Country
    • Historical Market Size Value (US$ Bn) & Volume (Thousand Units) Trend Analysis By Market Taxonomy, 2020 to 2024
    • Market Size Value (US$ Bn) & Volume (Thousand Units) Forecast By Market Taxonomy, 2025 to 2035
      • By Country
        • China
        • Japan
        • South Korea
      • By Engine Power
      • By Driveline
      • By Propulsion Type
    • Market Attractiveness Analysis
      • By Country
      • By Engine Power
      • By Driveline
      • By Propulsion Type
    • Key Takeaways
  15. South Asia & Pacific Market Analysis 2020 to 2024 and Forecast 2025 to 2035, By Country
    • Historical Market Size Value (US$ Bn) & Volume (Thousand Units) Trend Analysis By Market Taxonomy, 2020 to 2024
    • Market Size Value (US$ Bn) & Volume (Thousand Units) Forecast By Market Taxonomy, 2025 to 2035
      • By Country
        • India
        • Australia & New Zealand
        • ASEAN
        • Rest of SAP
      • By Engine Power
      • By Driveline
      • By Propulsion Type
    • Market Attractiveness Analysis
      • By Country
      • By Engine Power
      • By Driveline
      • By Propulsion Type
    • Key Takeaways
  16. Middle East and Africa Market Analysis 2020 to 2024 and Forecast 2025 to 2035, By Country
    • Historical Market Size Value (US$ Bn) & Volume (Thousand Units) Trend Analysis By Market Taxonomy, 2020 to 2024
    • Market Size Value (US$ Bn) & Volume (Thousand Units) Forecast By Market Taxonomy, 2025 to 2035
      • By Country
        • GCC Countries
        • Northern Africa
        • South Africa
        • Turkiye
        • Rest of MEA
      • By Engine Power
      • By Driveline
      • By Propulsion Type
    • Market Attractiveness Analysis
      • By Country
      • By Engine Power
      • By Driveline
      • By Propulsion Type
    • Key Takeaways
  17. Key Countries Market Analysis
    • USA
      • Pricing Analysis
      • Market Share Analysis, 2024
        • By Engine Power
        • By Driveline
        • By Propulsion Type
    • Canada
      • Pricing Analysis
      • Market Share Analysis, 2024
        • By Engine Power
        • By Driveline
        • By Propulsion Type
    • Brazil
      • Pricing Analysis
      • Market Share Analysis, 2024
        • By Engine Power
        • By Driveline
        • By Propulsion Type
    • Mexico
      • Pricing Analysis
      • Market Share Analysis, 2024
        • By Engine Power
        • By Driveline
        • By Propulsion Type
    • Argentina
      • Pricing Analysis
      • Market Share Analysis, 2024
        • By Engine Power
        • By Driveline
        • By Propulsion Type
  18. Market Structure Analysis
    • Competition Dashboard
    • Competition Benchmarking
    • Market Share Analysis of Top Players
      • By Regional
      • By Engine Power
      • By Driveline
      • By Propulsion Type
  19. Competition Analysis
    • Competition Deep Dive
      • Deere & Company
        • Overview
        • Product Portfolio
        • Profitability by Market Segments (Product/Age /Sales Channel/Region)
        • Sales Footprint
        • Strategy Overview
          • Marketing Strategy
          • Product Strategy
          • Channel Strategy
      • AGCO Corporation
        • Overview
        • Product Portfolio
        • Profitability by Market Segments (Product/Age /Sales Channel/Region)
        • Sales Footprint
        • Strategy Overview
          • Marketing Strategy
          • Product Strategy
          • Channel Strategy
      • CLAAS KGaA mbH
        • Overview
        • Product Portfolio
        • Profitability by Market Segments (Product/Age /Sales Channel/Region)
        • Sales Footprint
        • Strategy Overview
          • Marketing Strategy
          • Product Strategy
          • Channel Strategy
      • CNH Industrial N.V.
        • Overview
        • Product Portfolio
        • Profitability by Market Segments (Product/Age /Sales Channel/Region)
        • Sales Footprint
        • Strategy Overview
          • Marketing Strategy
          • Product Strategy
          • Channel Strategy
      • Escorts Limited
        • Overview
        • Product Portfolio
        • Profitability by Market Segments (Product/Age /Sales Channel/Region)
        • Sales Footprint
        • Strategy Overview
          • Marketing Strategy
          • Product Strategy
          • Channel Strategy
      • KUBOTA Corporation
        • Overview
        • Product Portfolio
        • Profitability by Market Segments (Product/Age /Sales Channel/Region)
        • Sales Footprint
        • Strategy Overview
          • Marketing Strategy
          • Product Strategy
          • Channel Strategy
  20. Assumptions & Acronyms Used
  21. Research Methodology

List of Tables

  • Table 1: Global Market Value (USD Billion) Forecast by Region, 2020-2035
  • Table 2: Global Market Volume (Thousand Units) Forecast by Region, 2020-2035
  • Table 3: Global Market Value (USD Billion) Forecast by Engine Power, 2020-2035
  • Table 4: Global Market Volume (Thousand Units) Forecast by Engine Power, 2020-2035
  • Table 5: Global Market Value (USD Billion) Forecast by Driveline, 2020-2035
  • Table 6: Global Market Volume (Thousand Units) Forecast by Driveline, 2020-2035
  • Table 7: Global Market Value (USD Billion) Forecast by Propulsion Type, 2020-2035
  • Table 8: Global Market Volume (Thousand Units) Forecast by Propulsion Type, 2020-2035
  • Table 9: North America Market Value (USD Billion) Forecast by Country, 2020-2035
  • Table 10: North America Market Volume (Thousand Units) Forecast by Country, 2020-2035
  • Table 11: North America Market Value (USD Billion) Forecast by Engine Power, 2020-2035
  • Table 12: North America Market Volume (Thousand Units) Forecast by Engine Power, 2020-2035
  • Table 13: North America Market Value (USD Billion) Forecast by Driveline, 2020-2035
  • Table 14: North America Market Volume (Thousand Units) Forecast by Driveline, 2020-2035
  • Table 15: North America Market Value (USD Billion) Forecast by Propulsion Type, 2020-2035
  • Table 16: North America Market Volume (Thousand Units) Forecast by Propulsion Type, 2020-2035
  • Table 17: Latin America Market Value (USD Billion) Forecast by Country, 2020-2035
  • Table 18: Latin America Market Volume (Thousand Units) Forecast by Country, 2020-2035
  • Table 19: Latin America Market Value (USD Billion) Forecast by Engine Power, 2020-2035
  • Table 20: Latin America Market Volume (Thousand Units) Forecast by Engine Power, 2020-2035
  • Table 21: Latin America Market Value (USD Billion) Forecast by Driveline, 2020-2035
  • Table 22: Latin America Market Volume (Thousand Units) Forecast by Driveline, 2020-2035
  • Table 23: Latin America Market Value (USD Billion) Forecast by Propulsion Type, 2020-2035
  • Table 24: Latin America Market Volume (Thousand Units) Forecast by Propulsion Type, 2020-2035
  • Table 25: Western Europe Market Value (USD Billion) Forecast by Country, 2020-2035
  • Table 26: Western Europe Market Volume (Thousand Units) Forecast by Country, 2020-2035
  • Table 27: Western Europe Market Value (USD Billion) Forecast by Engine Power, 2020-2035
  • Table 28: Western Europe Market Volume (Thousand Units) Forecast by Engine Power, 2020-2035
  • Table 29: Western Europe Market Value (USD Billion) Forecast by Driveline, 2020-2035
  • Table 30: Western Europe Market Volume (Thousand Units) Forecast by Driveline, 2020-2035
  • Table 31: Western Europe Market Value (USD Billion) Forecast by Propulsion Type, 2020-2035
  • Table 32: Western Europe Market Volume (Thousand Units) Forecast by Propulsion Type, 2020-2035
  • Table 33: Eastern Europe Market Value (USD Billion) Forecast by Country, 2020-2035
  • Table 34: Eastern Europe Market Volume (Thousand Units) Forecast by Country, 2020-2035
  • Table 35: Eastern Europe Market Value (USD Billion) Forecast by Engine Power, 2020-2035
  • Table 36: Eastern Europe Market Volume (Thousand Units) Forecast by Engine Power, 2020-2035
  • Table 37: Eastern Europe Market Value (USD Billion) Forecast by Driveline, 2020-2035
  • Table 38: Eastern Europe Market Volume (Thousand Units) Forecast by Driveline, 2020-2035
  • Table 39: Eastern Europe Market Value (USD Billion) Forecast by Propulsion Type, 2020-2035
  • Table 40: Eastern Europe Market Volume (Thousand Units) Forecast by Propulsion Type, 2020-2035
  • Table 41: East Asia Market Value (USD Billion) Forecast by Country, 2020-2035
  • Table 42: East Asia Market Volume (Thousand Units) Forecast by Country, 2020-2035
  • Table 43: East Asia Market Value (USD Billion) Forecast by Engine Power, 2020-2035
  • Table 44: East Asia Market Volume (Thousand Units) Forecast by Engine Power, 2020-2035
  • Table 45: East Asia Market Value (USD Billion) Forecast by Driveline, 2020-2035
  • Table 46: East Asia Market Volume (Thousand Units) Forecast by Driveline, 2020-2035
  • Table 47: East Asia Market Value (USD Billion) Forecast by Propulsion Type, 2020-2035
  • Table 48: East Asia Market Volume (Thousand Units) Forecast by Propulsion Type, 2020-2035
  • Table 49: South Asia & Pacific Market Value (USD Billion) Forecast by Country, 2020-2035
  • Table 50: South Asia & Pacific Market Volume (Thousand Units) Forecast by Country, 2020-2035
  • Table 51: South Asia & Pacific Market Value (USD Billion) Forecast by Engine Power, 2020-2035
  • Table 52: South Asia & Pacific Market Volume (Thousand Units) Forecast by Engine Power, 2020-2035
  • Table 53: South Asia & Pacific Market Value (USD Billion) Forecast by Driveline, 2020-2035
  • Table 54: South Asia & Pacific Market Volume (Thousand Units) Forecast by Driveline, 2020-2035
  • Table 55: South Asia & Pacific Market Value (USD Billion) Forecast by Propulsion Type, 2020-2035
  • Table 56: South Asia & Pacific Market Volume (Thousand Units) Forecast by Propulsion Type, 2020-2035
  • Table 57: Middle East and Africa Market Value (USD Billion) Forecast by Country, 2020-2035
  • Table 58: Middle East and Africa Market Volume (Thousand Units) Forecast by Country, 2020-2035
  • Table 59: Middle East and Africa Market Value (USD Billion) Forecast by Engine Power, 2020-2035
  • Table 60: Middle East and Africa Market Volume (Thousand Units) Forecast by Engine Power, 2020-2035
  • Table 61: Middle East and Africa Market Value (USD Billion) Forecast by Driveline, 2020-2035
  • Table 62: Middle East and Africa Market Volume (Thousand Units) Forecast by Driveline, 2020-2035
  • Table 63: Middle East and Africa Market Value (USD Billion) Forecast by Propulsion Type, 2020-2035
  • Table 64: Middle East and Africa Market Volume (Thousand Units) Forecast by Propulsion Type, 2020-2035

List of Figures

  • Figure 1: Global Market Volume (Thousand Units) Forecast 2020-2035
  • Figure 2: Global Market Pricing Analysis
  • Figure 3: Global Market Value (USD Billion) Forecast 2020-2035
  • Figure 4: Global Market Value Share and BPS Analysis by Engine Power, 2025 and 2035
  • Figure 5: Global Market Y-o-Y Growth Comparison by Engine Power, 2025-2035
  • Figure 6: Global Market Attractiveness Analysis by Engine Power
  • Figure 7: Global Market Value Share and BPS Analysis by Driveline, 2025 and 2035
  • Figure 8: Global Market Y-o-Y Growth Comparison by Driveline, 2025-2035
  • Figure 9: Global Market Attractiveness Analysis by Driveline
  • Figure 10: Global Market Value Share and BPS Analysis by Propulsion Type, 2025 and 2035
  • Figure 11: Global Market Y-o-Y Growth Comparison by Propulsion Type, 2025-2035
  • Figure 12: Global Market Attractiveness Analysis by Propulsion Type
  • Figure 13: Global Market Value (USD Billion) Share and BPS Analysis by Region, 2025 and 2035
  • Figure 14: Global Market Y-o-Y Growth Comparison by Region, 2025-2035
  • Figure 15: Global Market Attractiveness Analysis by Region
  • Figure 16: North America Market Incremental $ Opportunity, 2025-2035
  • Figure 17: Latin America Market Incremental $ Opportunity, 2025-2035
  • Figure 18: Western Europe Market Incremental $ Opportunity, 2025-2035
  • Figure 19: Eastern Europe Market Incremental $ Opportunity, 2025-2035
  • Figure 20: East Asia Market Incremental $ Opportunity, 2025-2035
  • Figure 21: South Asia & Pacific Market Incremental $ Opportunity, 2025-2035
  • Figure 22: Middle East and Africa Market Incremental $ Opportunity, 2025-2035
  • Figure 23: North America Market Value Share and BPS Analysis by Country, 2025 and 2035
  • Figure 24: North America Market Value Share and BPS Analysis by Engine Power, 2025 and 2035
  • Figure 25: North America Market Y-o-Y Growth Comparison by Engine Power, 2025-2035
  • Figure 26: North America Market Attractiveness Analysis by Engine Power
  • Figure 27: North America Market Value Share and BPS Analysis by Driveline, 2025 and 2035
  • Figure 28: North America Market Y-o-Y Growth Comparison by Driveline, 2025-2035
  • Figure 29: North America Market Attractiveness Analysis by Driveline
  • Figure 30: North America Market Value Share and BPS Analysis by Propulsion Type, 2025 and 2035
  • Figure 31: North America Market Y-o-Y Growth Comparison by Propulsion Type, 2025-2035
  • Figure 32: North America Market Attractiveness Analysis by Propulsion Type
  • Figure 33: Latin America Market Value Share and BPS Analysis by Country, 2025 and 2035
  • Figure 34: Latin America Market Value Share and BPS Analysis by Engine Power, 2025 and 2035
  • Figure 35: Latin America Market Y-o-Y Growth Comparison by Engine Power, 2025-2035
  • Figure 36: Latin America Market Attractiveness Analysis by Engine Power
  • Figure 37: Latin America Market Value Share and BPS Analysis by Driveline, 2025 and 2035
  • Figure 38: Latin America Market Y-o-Y Growth Comparison by Driveline, 2025-2035
  • Figure 39: Latin America Market Attractiveness Analysis by Driveline
  • Figure 40: Latin America Market Value Share and BPS Analysis by Propulsion Type, 2025 and 2035
  • Figure 41: Latin America Market Y-o-Y Growth Comparison by Propulsion Type, 2025-2035
  • Figure 42: Latin America Market Attractiveness Analysis by Propulsion Type
  • Figure 43: Western Europe Market Value Share and BPS Analysis by Country, 2025 and 2035
  • Figure 44: Western Europe Market Value Share and BPS Analysis by Engine Power, 2025 and 2035
  • Figure 45: Western Europe Market Y-o-Y Growth Comparison by Engine Power, 2025-2035
  • Figure 46: Western Europe Market Attractiveness Analysis by Engine Power
  • Figure 47: Western Europe Market Value Share and BPS Analysis by Driveline, 2025 and 2035
  • Figure 48: Western Europe Market Y-o-Y Growth Comparison by Driveline, 2025-2035
  • Figure 49: Western Europe Market Attractiveness Analysis by Driveline
  • Figure 50: Western Europe Market Value Share and BPS Analysis by Propulsion Type, 2025 and 2035
  • Figure 51: Western Europe Market Y-o-Y Growth Comparison by Propulsion Type, 2025-2035
  • Figure 52: Western Europe Market Attractiveness Analysis by Propulsion Type
  • Figure 53: Eastern Europe Market Value Share and BPS Analysis by Country, 2025 and 2035
  • Figure 54: Eastern Europe Market Value Share and BPS Analysis by Engine Power, 2025 and 2035
  • Figure 55: Eastern Europe Market Y-o-Y Growth Comparison by Engine Power, 2025-2035
  • Figure 56: Eastern Europe Market Attractiveness Analysis by Engine Power
  • Figure 57: Eastern Europe Market Value Share and BPS Analysis by Driveline, 2025 and 2035
  • Figure 58: Eastern Europe Market Y-o-Y Growth Comparison by Driveline, 2025-2035
  • Figure 59: Eastern Europe Market Attractiveness Analysis by Driveline
  • Figure 60: Eastern Europe Market Value Share and BPS Analysis by Propulsion Type, 2025 and 2035
  • Figure 61: Eastern Europe Market Y-o-Y Growth Comparison by Propulsion Type, 2025-2035
  • Figure 62: Eastern Europe Market Attractiveness Analysis by Propulsion Type
  • Figure 63: East Asia Market Value Share and BPS Analysis by Country, 2025 and 2035
  • Figure 64: East Asia Market Value Share and BPS Analysis by Engine Power, 2025 and 2035
  • Figure 65: East Asia Market Y-o-Y Growth Comparison by Engine Power, 2025-2035
  • Figure 66: East Asia Market Attractiveness Analysis by Engine Power
  • Figure 67: East Asia Market Value Share and BPS Analysis by Driveline, 2025 and 2035
  • Figure 68: East Asia Market Y-o-Y Growth Comparison by Driveline, 2025-2035
  • Figure 69: East Asia Market Attractiveness Analysis by Driveline
  • Figure 70: East Asia Market Value Share and BPS Analysis by Propulsion Type, 2025 and 2035
  • Figure 71: East Asia Market Y-o-Y Growth Comparison by Propulsion Type, 2025-2035
  • Figure 72: East Asia Market Attractiveness Analysis by Propulsion Type
  • Figure 73: South Asia & Pacific Market Value Share and BPS Analysis by Country, 2025 and 2035
  • Figure 74: South Asia & Pacific Market Value Share and BPS Analysis by Engine Power, 2025 and 2035
  • Figure 75: South Asia & Pacific Market Y-o-Y Growth Comparison by Engine Power, 2025-2035
  • Figure 76: South Asia & Pacific Market Attractiveness Analysis by Engine Power
  • Figure 77: South Asia & Pacific Market Value Share and BPS Analysis by Driveline, 2025 and 2035
  • Figure 78: South Asia & Pacific Market Y-o-Y Growth Comparison by Driveline, 2025-2035
  • Figure 79: South Asia & Pacific Market Attractiveness Analysis by Driveline
  • Figure 80: South Asia & Pacific Market Value Share and BPS Analysis by Propulsion Type, 2025 and 2035
  • Figure 81: South Asia & Pacific Market Y-o-Y Growth Comparison by Propulsion Type, 2025-2035
  • Figure 82: South Asia & Pacific Market Attractiveness Analysis by Propulsion Type
  • Figure 83: Middle East and Africa Market Value Share and BPS Analysis by Country, 2025 and 2035
  • Figure 84: Middle East and Africa Market Value Share and BPS Analysis by Engine Power, 2025 and 2035
  • Figure 85: Middle East and Africa Market Y-o-Y Growth Comparison by Engine Power, 2025-2035
  • Figure 86: Middle East and Africa Market Attractiveness Analysis by Engine Power
  • Figure 87: Middle East and Africa Market Value Share and BPS Analysis by Driveline, 2025 and 2035
  • Figure 88: Middle East and Africa Market Y-o-Y Growth Comparison by Driveline, 2025-2035
  • Figure 89: Middle East and Africa Market Attractiveness Analysis by Driveline
  • Figure 90: Middle East and Africa Market Value Share and BPS Analysis by Propulsion Type, 2025 and 2035
  • Figure 91: Middle East and Africa Market Y-o-Y Growth Comparison by Propulsion Type, 2025-2035
  • Figure 92: Middle East and Africa Market Attractiveness Analysis by Propulsion Type
  • Figure 93: Global Market - Tier Structure Analysis
  • Figure 94: Global Market - Company Share Analysis

Frequently Asked Questions

What is the market size of the agricultural tractors market in 2025?

The market size is valued at USD 65 billion in 2025.

How much will the agricultural tractors market reach by 2035?

It is projected to reach USD 119 billion by 2035.

What is the forecast CAGR for the agricultural tractors market from 2025 to 2035?

The market is expected to grow at a CAGR of 6.2% during 2025-2035.

Which engine power segment holds the largest share in the agricultural tractors market?

The 41 to 100 HP segment holds the largest share in 2025.

Who is the leading player in the agricultural tractors market?

Deere & Company is the leading player with 22% share.

Explore Similar Insights

Future Market Insights

Agricultural Tractors Market