The air fryer market is estimated to be valued at USD 1.0 billion in 2025. It is projected to reach USD 1.9 billion by 2035, registering a compound annual growth rate (CAGR) of 6.7% over the forecast period.
The market is projected to add an absolute dollar opportunity of USD 1.0 billion over the forecast period. This reflects a 1.9 times growth at a compound annual growth rate of 6.7%. The market’s evolution is expected to be driven by rising health consciousness, demand for convenient cooking solutions, smart technology integration, and growing preference for oil-free cooking methods, particularly where energy-efficient and time-saving appliances are required.
By 2030, the market is likely to reach USD 1.4 billion, accounting for USD 400 million in incremental value over the first half of the decade. The remaining USD 600 million is expected to be realized during the second half, suggesting a moderately accelerated growth pattern. Product innovation in digital controls, smart connectivity, and multi-functional capabilities is gaining traction.
Companies such as Koninklijke Philips N.V. and Stanley Black & Decker, Inc. are advancing their competitive positions through investment in technology development, product innovation programs, and global distribution networks. Rising health awareness, expanding e-commerce platforms, and improved energy efficiency features support expansion into residential, commercial, and specialty appliance applications. Market performance will remain anchored in cooking performance standards, energy efficiency, and consumer convenience optimization benchmarks.
The market holds a significant and rapidly growing share across its parent markets. Within the global small kitchen appliances market, it is estimated to account for 8.5% due to its specialized cooking capabilities. In the healthy cooking appliances segment, it is estimated to command a 22.3% share, supported by fat reduction technology and oil-free cooking benefits. It is estimated to contribute nearly 15.2% to the digital appliance market and 12.7% to the energy-efficient appliance segment. In smart kitchen appliances, air fryers hold around 18.4% share, driven by IoT integration and app connectivity requirements. Across the convenience cooking appliance market, its share is close to 14.8%, owing to its position as a leading time-saving cooking solution requiring minimal preparation.
The market is undergoing a strategic transformation driven by rising demand for digital air fryers, smart connectivity features, and multi-functional cooking capabilities. Advanced technologies using rapid air circulation, precise temperature control, and intelligent cooking programs have enhanced cooking performance, energy efficiency, and user convenience, making air fryers a viable alternative to traditional deep frying and conventional ovens. Manufacturers are introducing specialized features, including preset cooking programs, app integration, and larger capacity models tailored for different household sizes and cooking preferences, expanding their role beyond basic frying to comprehensive cooking solutions. Strategic collaborations between appliance manufacturers and technology companies have accelerated innovation in smart features and market penetration.
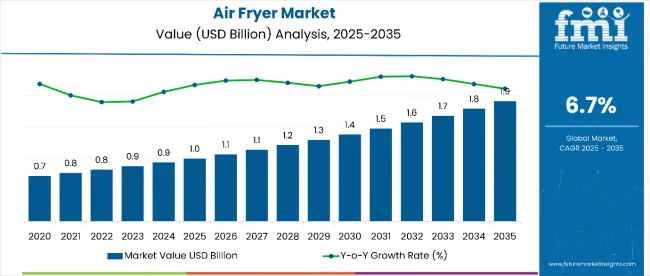
| Metric | Value |
|---|---|
| Estimated Size (2025E) | USD 1.0 billion |
| Projected Value (2035F) | USD 1.9 billion |
| CAGR (2025-2035) | 6.7% |
The air fryer market's exceptional growth is driven by increasing health consciousness, demand for convenient cooking solutions, and rising energy efficiency awareness, making it an attractive appliance category for manufacturers and retailers seeking innovative kitchen solutions. The growing preference for healthier cooking methods, time-saving appliances, and compact kitchen solutions appeals to consumers prioritizing convenience, health benefits, and energy savings.
A growing understanding of oil-free cooking benefits, smart home integration, and multi-functional appliance design is further propelling adoption, particularly in residential kitchens, small households, and health-conscious demographics. Rising disposable income, expanding e-commerce platforms, and continuous product innovation are also enhancing market accessibility and consumer adoption.
As smart kitchen appliances and healthy cooking trends accelerate across global markets and convenience becomes increasingly important, the market outlook remains highly favorable. With consumers prioritizing health benefits, cooking convenience, and energy efficiency, air fryers are well-positioned to expand across various residential, commercial, and specialty cooking applications.
The market is segmented by device type, wattage, end use, price range, sales channel, and region. By device type, the market is bifurcated into manual and digital air fryers. Based on wattage, the market is categorized into below 1200 watts, 1200-1500 watts, 1500-1800 watts, 1800-2200 watts, and 2200 watts & above. In terms of end-use, the market is segmented into commercial and residential applications. By price range, the market is segmented into below USD 25, USD 25-100, USD 100-200, USD 200-300, and USD 300 & above. Based on Sales channel, the market is divided into direct sales, supermarket/hypermarket, department stores, specialty stores, online retailers, and other sales channels. Regionally, the market is classified into North America, Latin America, Western Europe, South Asia & Pacific, East Asia, and Middle East & Africa.
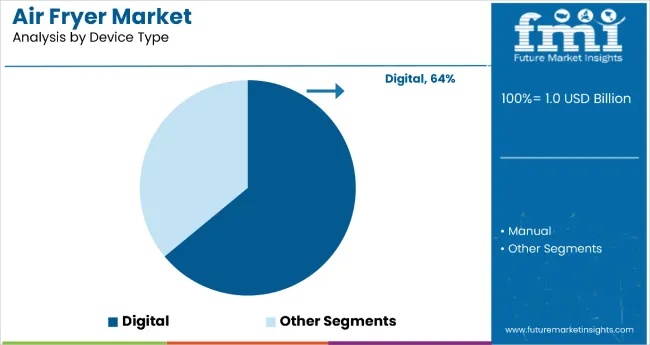
The digital segment holds a dominant position with 64% of the market share in the device type category, owing to their superior convenience features, precise temperature control, and advanced cooking programs that enable consistent cooking results for diverse food types. Digital air fryers are widely used across residential and commercial settings due to their LCDs, preset cooking functions, and smart connectivity capabilities that significantly improve user experience and cooking precision.
They enable consumers to achieve consistent cooking results while maintaining excellent energy efficiency and safety standards in everyday cooking scenarios. As demand for smart appliances, convenience features, and precise cooking control grows, the digital segment continues to gain preference in both traditional and modern kitchen environments.
Manufacturers are investing in advanced digital interface development, app connectivity, and AI-powered cooking algorithms to enhance functionality, expand user accessibility, and improve cooking outcomes. The segment is poised to grow further as global consumer preferences favor digital appliances and smart home integration becomes more prevalent.
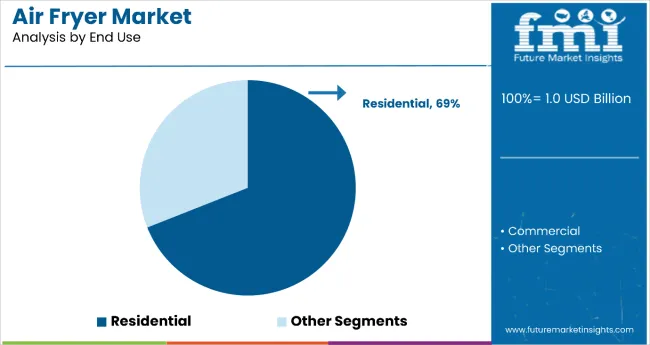
Residential applications remain the core market segment with a 69% share in 2025, as they provide convenient cooking solutions, health benefits, and energy efficiency for everyday meal preparation in home kitchens. Their functional versatility supports various cooking methods, including frying, baking, grilling, and reheating, making them essential appliances for health-conscious consumers and busy households.
Residential air fryers also ensure consistent cooking results, reduced oil consumption, and faster cooking times compared to conventional cooking methods, while offering compact designs suitable for modern kitchen spaces. This makes them indispensable in contemporary home cooking and health-focused lifestyle environments.
Ongoing demand for healthy cooking solutions and the convenience required for modern lifestyle management are key trends driving the sustained relevance of residential applications in this appliance category.
In 2024, global air fryer adoption grew by 18% year-on-year, with North America and Europe taking significant market shares. Applications include healthy cooking, convenience meal preparation, and energy-efficient cooking solutions. Manufacturers are introducing specialized features and smart connectivity options that deliver superior cooking performance and user-centered convenience. Digital models now support smart home positioning. Evidence-based health benefits and energy efficiency studies support consumer confidence. Technology providers increasingly supply ready-to-use smart air fryers with integrated mobile apps to reduce cooking complexity.
Digital Innovation Accelerates Air Fryer Market Demand
Appliance manufacturers and retailers are choosing digital air fryers to achieve superior cooking control, enhance user experience, and meet growing demands for smart, connected kitchen appliances. In performance tests, digital air fryers deliver up to 75% more consistent cooking results compared to manual variants at 25-35% faster cooking speeds. Models equipped with digital controls maintain optimal cooking performance throughout extended usage periods and diverse cooking applications. In residential settings, integrated digital programs help reduce cooking complexity while maintaining safety standards by up to 65%. Smart connectivity applications are now being deployed for remote monitoring, increasing adoption in sectors demanding comprehensive convenience features.
Cost Pressures, Limited Capacity and Competition Limit Growth
Market expansion faces constraints due to higher costs of digital models, limited cooking capacity for large families, and competition from traditional cooking appliances. Digital air fryer prices can range from USD 100 to USD 300, depending on feature selection and capacity requirements, impacting consumer accessibility and leading to purchase delays in price-sensitive markets. Limited cooking capacity restricts usage for large household meal preparation, extending cooking time by 50-70% for family-sized portions. Competition from conventional ovens and deep fryers adds complexity to market positioning, especially for traditional cooking preferences. Limited awareness of air fryer benefits restricts scalable market adoption, particularly in emerging markets and conventional cooking cultures.
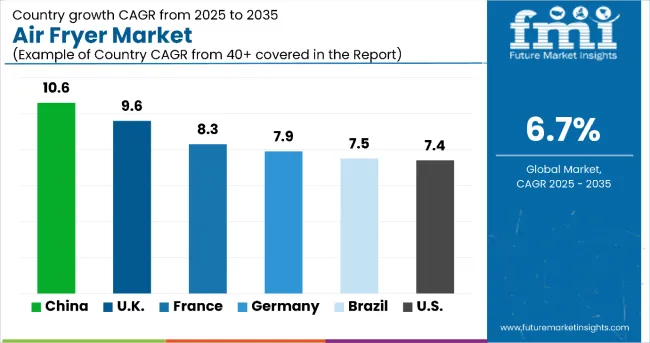
| Countries | CAGR (2025 to 2035) |
|---|---|
| China | 10.6% |
| UK | 9.6% |
| France | 8.3% |
| Germany | 7.9% |
| Brazil | 7.5% |
| USA | 7.4% |
In the air fryer market, China leads with the highest projected CAGR of 10.6% from 2025 to 2035, driven by rapid urbanization, increasing health consciousness, and expanding e-commerce penetration. UK follows with a CAGR of 9.6%, supported by energy cost savings awareness and strong adoption of convenience appliances. France shows robust growth at 8.3%, benefiting from health-conscious consumer trends and premium appliance preferences. Germany, Brazil, and the USA demonstrate consistent growth at 7.9%, 7.5%, and 7.4% respectively, supported by established retail networks and health awareness campaigns. India, with a CAGR of 5.9%, experiences steady expansion supported by rising middle-class income and urbanization trends, reflecting regional differences in market maturity and consumer adoption patterns.
The report covers an in-depth analysis of 40+ countries; six top-performing countries are highlighted below.
Revenue from air fryers in China is projected to grow at a CAGR of 10.6% from 2025 to 2035, significantly exceeding the global average. Growth is fueled by rapid urbanization, health consciousness, and strong e-commerce adoption across major cities, including Beijing, Shanghai, and Guangzhou. Chinese consumers are increasingly adopting convenient cooking solutions as lifestyle changes drive demand for time-saving appliances.
Key Statistics
The air fryer market in the UK is anticipated to expand at a CAGR of 9.6% from 2025 to 2035, reflecting strong consumer adoption driven by energy cost savings and convenience cooking trends. Growth is centered on digital air fryer adoption and energy-efficient cooking solutions in the London, Manchester, and Birmingham regions. Advanced features, including smart controls, preset programs, and compact designs, are being deployed for energy-conscious consumers and small households seeking cooking efficiency.
Key Statistics
Sales of air fryers in France are projected to flourish at a CAGR of 8.3% from 2025 to 2035, driven by health-conscious cooking trends and premium appliance preferences. Growth has been concentrated in urban markets and health-focused consumer segments in the Paris, Lyon, and Marseille regions. Consumer adoption is shifting from traditional cooking methods toward healthier, oil-free cooking solutions. Premium positioning and culinary innovation are leading market deployment strategies.
Key Statistics
The demand for air fryers in Germany is expected to increase at a CAGR of 7.9% from 2025 to 2035, exceeding the mature European market average. Demand is driven by quality engineering preferences, energy efficiency consciousness, and robust retail infrastructure in Berlin, Munich, and Hamburg markets. Evidence-based health benefits and German engineering standards are increasingly adopted by quality-focused consumers seeking reliable cooking appliances.
Key Statistics
Revenue from air fryers in Brazil is projected to rise at a CAGR of 7.5% from 2025 to 2035, supported by expanding middle class, urbanization trends, and health awareness growth. Consumer adoption in São Paulo, Rio de Janeiro, and Brasília is experiencing expansion in affordable cooking solutions, convenience features, and local retail accessibility. Brazilian consumers are leveraging accessible pricing options to meet expectations for convenient and healthier cooking alternatives.
Key Statistics
The air fryer market in the USA is expected to grow at a CAGR of 7.4% from 2025 to 2035, reflecting mature market dynamics with a focus on premium features and smart connectivity. Growth is centered on digital air fryer adoption and multi-functional capabilities in California, Texas, and New York regions. Advanced features, including app connectivity, preset programs, and energy efficiency improvements, are being deployed for health-conscious consumers and busy households.
Key Statistics
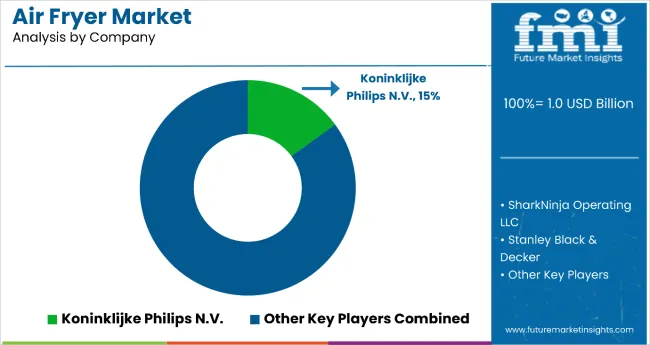
The Air Fryer Market is witnessing robust global expansion, driven by increasing consumer preference for healthier cooking alternatives and the convenience of compact, multifunctional kitchen appliances. Leading players such as Koninklijke Philips N.V., Stanley Black & Decker Inc., and Breville Group Limited are at the forefront of innovation, offering advanced air fryers equipped with smart connectivity, precise temperature control, and energy-efficient designs.
Manufacturers like Groupe SEB and Meyer Manufacturing Company Limited are emphasizing product differentiation through sleek aesthetics, faster cooking times, and digital interfaces that cater to modern lifestyles. Additionally, NuWave LLC and De’ Longhi Appliances S.r.l. are investing in advanced heating technologies and dual-cook systems to enhance product performance and consumer satisfaction.
| Items | Value |
|---|---|
| Quantitative Units (2025) | USD 1.0 Billion |
| Device Type | Manual and Digital |
| Wattage | Below 1200W, 1200-1500W, 1500-1800W, 1800-2200W, 2200W & a bove |
| End Use | Commercial, Residential |
| Price Range | Below USD 25, USD 25-100, USD 100-200, USD 200-300, USD 300 & Above |
| Sales Channel | Direct Sales, Supermarket/Hypermarket, Department Stores, Specialty Stores, Online Retailers, Others |
| Regions Covered | North America, Europe, Asia Pacific, Latin America, Middle East & Africa |
| Countries Covered | United States, Canada, United Kingdom, Germany, France, China, Japan, South Korea, Brazil, Australia, India and 40+ Countries |
| Key Companies Profiled |
Koninklijke Philips N.V., Stanley Black & Decker Inc., Breville Group Limited, Groupe SEB, Meyer Manufacturing Company Limited, NuWave LLC, De’ Longhi Appliances S.r.l. |
| Additional Attributes | Dollar sales by device type, wattage, and end use ; regional demand trends; competitive landscape; consumer preferences for health-conscious cooking; integration with smart kitchen ecosystems; innovations in design, energy efficiency, and multifunctionality |
The global air fryer market is estimated to be valued at USD 1.0 billion in 2025.
The market size for air fryers is projected to reach USD 1.9 billion by 2035.
The air fryer market is expected to grow at a 6.7% CAGR between 2025 and 2035.
The digital segment is projected to lead in the air fryer market with 64% market share in 2025.
In terms of end use, the residential segment is projected to command 69% share in the air fryer market in 2025.


Our Research Products

The "Full Research Suite" delivers actionable market intel, deep dives on markets or technologies, so clients act faster, cut risk, and unlock growth.

The Leaderboard benchmarks and ranks top vendors, classifying them as Established Leaders, Leading Challengers, or Disruptors & Challengers.

Locates where complements amplify value and substitutes erode it, forecasting net impact by horizon

We deliver granular, decision-grade intel: market sizing, 5-year forecasts, pricing, adoption, usage, revenue, and operational KPIs—plus competitor tracking, regulation, and value chains—across 60 countries broadly.

Spot the shifts before they hit your P&L. We track inflection points, adoption curves, pricing moves, and ecosystem plays to show where demand is heading, why it is changing, and what to do next across high-growth markets and disruptive tech

Real-time reads of user behavior. We track shifting priorities, perceptions of today’s and next-gen services, and provider experience, then pace how fast tech moves from trial to adoption, blending buyer, consumer, and channel inputs with social signals (#WhySwitch, #UX).

Partner with our analyst team to build a custom report designed around your business priorities. From analysing market trends to assessing competitors or crafting bespoke datasets, we tailor insights to your needs.
Supplier Intelligence
Discovery & Profiling
Capacity & Footprint
Performance & Risk
Compliance & Governance
Commercial Readiness
Who Supplies Whom
Scorecards & Shortlists
Playbooks & Docs
Category Intelligence
Definition & Scope
Demand & Use Cases
Cost Drivers
Market Structure
Supply Chain Map
Trade & Policy
Operating Norms
Deliverables
Buyer Intelligence
Account Basics
Spend & Scope
Procurement Model
Vendor Requirements
Terms & Policies
Entry Strategy
Pain Points & Triggers
Outputs
Pricing Analysis
Benchmarks
Trends
Should-Cost
Indexation
Landed Cost
Commercial Terms
Deliverables
Brand Analysis
Positioning & Value Prop
Share & Presence
Customer Evidence
Go-to-Market
Digital & Reputation
Compliance & Trust
KPIs & Gaps
Outputs
Full Research Suite comprises of:
Market outlook & trends analysis
Interviews & case studies
Strategic recommendations
Vendor profiles & capabilities analysis
5-year forecasts
8 regions and 60+ country-level data splits
Market segment data splits
12 months of continuous data updates
DELIVERED AS:
PDF EXCEL ONLINE
Air Fryer Paper Liners Market Size and Share Forecast Outlook 2025 to 2035
Air Fryer Accessories Market Size and Share Forecast Outlook 2025 to 2035
Demand for Air Fryers in EU Size and Share Forecast Outlook 2025 to 2035
Commercial Air Fryer Oven Market Size and Share Forecast Outlook 2025 to 2035
Commercial Air Fryer Market Size and Share Forecast Outlook 2025 to 2035
Air Struts Market Size and Share Forecast Outlook 2025 to 2035
Airless Paint Spray System Market Size and Share Forecast Outlook 2025 to 2035
Air Caster Skids System Market Size and Share Forecast Outlook 2025 to 2035
Airborne Molecular Contamination Control Services Market Forecast and Outlook 2025 to 2035
Airflow Balancer Market Size and Share Forecast Outlook 2025 to 2035
Aircraft Cabin Environment Sensor Market Forecast and Outlook 2025 to 2035
Aircraft Flight Control System Market Size and Share Forecast Outlook 2025 to 2035
Airborne Radar Market Size and Share Forecast Outlook 2025 to 2035
Aircraft Electric Motor Market Forecast Outlook 2025 to 2035
Airport Ground Transportation Market Forecast and Outlook 2025 to 2035
Airless Sprayer Accessories Market Size and Share Forecast Outlook 2025 to 2035
Air Purge Valve Market Size and Share Forecast Outlook 2025 to 2035
Air Flow Sensors Market Size and Share Forecast Outlook 2025 to 2035
Air Separation Plant Market Size and Share Forecast Outlook 2025 to 2035
Air Cooled Turbo Generators Market Size and Share Forecast Outlook 2025 to 2035

Thank you!
You will receive an email from our Business Development Manager. Please be sure to check your SPAM/JUNK folder too.
Chat With
MaRIA