Reports

- Global Locations -

Headquarters

Future Market Insights, Inc.

Christiana Corporate, 200
Continental Drive, Suite 401,
Newark, Delaware - 19713,
United States

T: +1-845-579-5705

Americas

Future Market Insights, Inc.

616 Corporate Way, Suite 2-9018,
Valley Cottage, NY 10989, United States

T: +1-347-918-3531

MEA

Future Market Insights

1602-6 Jumeirah Bay X2 Tower, Plot No: JLT-PH2-X2A,
Jumeirah Lakes Towers, Dubai,
United Arab Emirates

Europe

Future Market Insights

3rd Floor, 207 Regent Street,
W1B 3HH London
United Kingdom

T: + 44 (0) 20 8123 9659
D: +44 (0) 20 3287 4268

Asia Pacific

Future Market Insights

IndiaLand Global Tech Park, Unit UG-1, Behind Grand HighStreet, Phase 1, Hinjawadi, MH, Pune – 411057, India

Aircraft Actuator Market Outlook (2022 to 2032)

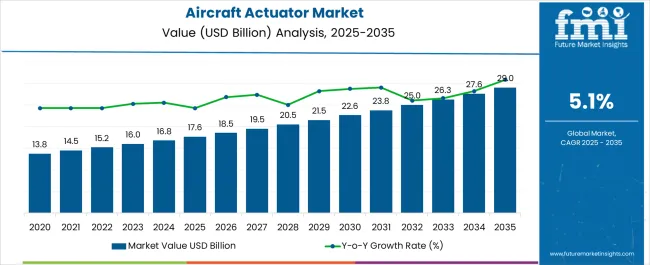
Global aircraft actuator sales totaled a valuation of US$ 15.2 billion in 2022. Over the next ten years (2022 to 2032), the global aircraft actuator market size will expand at 5.1% CAGR. Accordingly, the global market valuation will reach around US$ 25 billion by the end of 2032.

Demand remains especially high for pneumatic actuators worldwide. As per Future Market Insights (FMI), the target segment is likely to rise at around 4.9% CAGR from 2022 to 2032. This will make it the top revenue-generation segment.

  • Booming aviation industry worldwide is a key factor driving the global aircraft actuator market
  • Rising popularity of more electric aircraft (MEA) concept in aviation sector to elevate aircraft actuator demand
  • Expansion of commercial & military aircraft fleets to trigger aircraft actuator sales
  • Growing adoption of internet of things (IoT) systems in aviation industry to stimulate market expansion
  • Development of novel aircraft actuators suitable for state-of-the-art technologies including electric aircraft systems will boost market.
  • Introduction and popularity of future travel technologies such as electric vertical take-off and landing (eVTOL) aircraft will create growth prospects.

Aircraft actuators are essential components or devices used in aircraft to move or control a mechanism or system. They provide motion by converting energy and signals going into the system.

Aircraft actuators perform a wide range of applications in aviation industry. For instance, they are used to limit and control velocity and engine speed by adjusting flaps and levers.

Initially, actuator technologies such as hydraulic and pneumatic systems were used. However, with time new actuator technologies such as HAZEL actuators and electromechanical actuators gained prominence. These new aircraft actuators are lightweight. Hence, they increase fuel efficiency, optimize performance, reduce noise, and minimize emissions.

Rise in commercial aviation industry worldwide is expected to boost aircraft actuator demand. In years, years there has been a dramatic increase in air travel globally and this trend is likely to further escalate over the next few years.

For instance, as per the International Air Transport Association (IATA), total number of travelers is forecast to reach 4.0 billion in 20214. This will create growth prospects within aircraft actuator industry.

Transition towards electric vertical take-off and landing (eVTOL) aircraft will further elevate aircraft actuator demand. Thanks to advances in electric propulsion systems, it is believed that eVTOL aircraft and flying cars could become the future of transportation or mobility.

Electric aircraft or eVTOL vehicles have the tendency to transform the air traffic ecosystem. This new class of aircraft can revolutionize inter-and intra-city mobility. Mass-scale production and growing adoption of these electric aircraft will in turn generate high demand for actuators such as electromechanical actuators (EMAs).

Prominent companies are using various strategies to stay ahead of the competition. For instance, to develop EMAs for eVTOL aircraft, Hanwha Aerospace partnered with Vertical Aerospace.

North America currently holds a significant share of the global aircraft actuator industry. Over the next ten years, North America market is forecast to expand at about 5.1% CAGR. Booming aviation industry and shift towards electric aircraft are driving North America market.

Presence of leading aircraft actuator manufacturers is supporting market expansion. North America is home to leading companies such as Honeywell International. These companies are developing new enhanced aircraft actuators ideal for numerous applications.

Attributes Key Insights
Aircraft Actuator Market Size (2022) US$ 15.2 billion
Projected Market Size (2032) US$ 25 billion
Value-based CAGR (2022 to 2032) 5.1%
USA Market CAGR (2022 to 2032) 4%

Don't pay for what you don't need

Customize your report by selecting specific countries or regions and save 30%!

2017 to 2021 Aircraft Actuator Sales Outlook Compared to Demand Forecast from 2022 to 2032

As per FMI, global sales of aircraft actuators grew at 6.1% CAGR from 2017 to 2021. For the next ten years, the worldwide market for aircraft actuators will expand at 5.1% CAGR. This will result in an absolute $ opportunity of US$ 9.8 billion.

Actuators on aircraft carry out a variety of crucial tasks. This includes adjusting flight control surfaces such as the slats, rudder, flaps, and spoilers. They help in opening & closing cargo or weapon bay doors, extending & retracting landing gear, and positioning engine inlet guide thrust reversers & vanes, and among other things.

Aircraft actuators can tolerate environmental conditions such as intense vibrations, heat, and cold. Pneumatic and hydraulic actuators have historically been used extensively in airplane, but as the need for fuel efficiency grows, electric actuator utilization is soaring.

Development of advanced actuators is enabling companies to manufacture high-tech smarter aircraft. Growing popularity of these aircraft will boost aircraft actuators sales through 2032.

Key Trends Shaping Aircraft Actuator Sales:

Expansion of Aviation Industry Triggering Aircraft Actuator Sales

For significant firms operating in the market, growing nations such as China, India, and Brazil will open up new growth prospects. Latin American nations are growing their aviation industries as air travel increases. As a result, during the projected period, these improvements are likely to increase demand for aviation actuator systems.

Increase in commercial aircraft fleets worldwide will bolster aircraft actuator sales. Additionally, rising focus of countries on expanding military aircraft fleets will bode well for the market.

Numerous opportunities exist in the aviation industry to improve operational effectiveness and automation across a range of aircraft activities. IoT makes it possible to connect a variety of actuators with varying capacities. This helps to create a network in which the connected actuators may communicate with one another to carry out many activities that would otherwise be impossible for each type of actuator to carry out alone.

Sudip Saha
Sudip Saha

Principal Consultant

Talk to Analyst

Find your sweet spots for generating winning opportunities in this market.

Which are the Factors Restraining Growth in the Aircraft Actuator Industry?

Pneumatic actuators are a collection of diverse systems, including compressors, air filters, lubricant tubes, dryers, and regulators. They transform energy from compressed air into mechanical motion. As a result, the system is susceptible to flaws such as excessive noise and air leakage. Further, the maintenance expenses that go along with that are rather significant.

Hydraulic actuators are suitable for use in wheel brakes, landing gears, flight control surfaces, etc. due to the high load factor they provide. An electric or reservoir-based hydraulic actuator transfers energy into mechanical motion.

However, these devices are prone to fluid leaks, fire hazards, and mechanical component erosiveness from hydraulic oil spills. The aviation industry is governed by strict regulations, and authorities take this into account when using mechanical or electrical components.

Original equipment producers are required to adhere to regulations and certifications referred to as airworthiness directives (AD) regarding safety, leakage, and design issues that are overseen by the federal aviation administration (FAA).

The administration has issued the ADs as legally binding regulations to rectify lethal product conditions. Aircraft landing gear companies require a long lead time to develop reliable product releases.

This has an impact on the market for aircraft actuators as a whole. Therefore, the extensive and time-consuming certification process is limiting the market growth of airplane actuators.
Comparative Analysis of Adjacent Markets

Differentiating Aspect CAGR for 2022 to 2032
Pneumatic Actuator Market 4.8%
VVT Actuators Market 5.5%
Differentiating Aspect Market Valuation in 2022
Pneumatic Actuator Market 15950.3 million
VVT Actuators Market US$ 2,134.3 million
Differentiating Aspect Demand Drivers
Pneumatic Actuator Market
  • Rising usage of pneumatic actuators in industrial & transportation applications will drive the market.
  • High reliability and cost-effectiveness of pneumatic actuators will elevate demand.
VVT Actuators Market
  • Increasing penetration of automation in automotive sector will fuel VVT actuator demand.
  • Rising focus on improving fuel efficiency of vehicles will stimulate market expansion.

Get the data you need at a Fraction of the cost

Personalize your report by choosing insights you need
and save 40%!

Country-wise Insights:

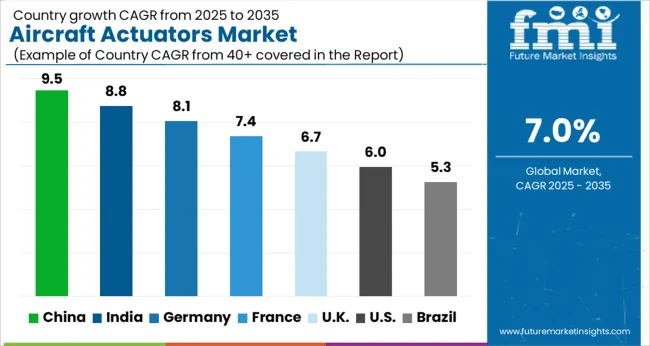
Country United States
Projected CAGR (2022 to 2032) 4.0%
Historical CAGR (2017 to 2021) 4.6%
Market Value (2032) US$ 7.7 billion
Country United Kingdom
Projected CAGR (2022 to 2032) 4.3%
Historical CAGR (2017 to 2021) 4.9%
Market Value (2032) US$ 1.2 billion
Country China
Projected CAGR (2022 to 2032) 6.1%
Historical CAGR (2017 to 2021) 7.5%
Market Value (2032) US$ 2.1 billion
Country Japan
Projected CAGR (2022 to 2032) 4.6%
Historical CAGR (2017 to 2021) 5.3%
Market Value (2032) US$ 1.8 billion
Country South Korea
Projected CAGR (2022 to 2032) 5.5%
Historical CAGR (2017 to 2021) 6.8%
Market Value (2032) US$ 1.0 billion

What Makes the United States a Dominant Market for Aircraft Actuators?

Rising Popularity of Electric Aircraft to Elevate Aircraft Actuator Demand in the United States

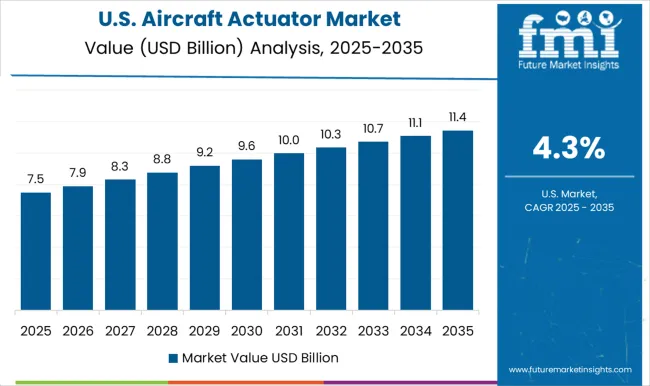
As per FMI, the United States will continue to remain a dominant market for aircraft actuators. The USA aircraft actuator market is set to reach US$ 7.7 billion by 2032. From 2017 to 2021, the USA market exhibited a CAGR of 4.6%.

Over the next ten years, aircraft actuator sales in the United States are forecast to rise at 4.0% CAGR. Booming aerospace and aviation sector is a key factor driving the USA aircraft actuator industry. Growing popularity of electric vertical take-off and landing aircraft will elevate aircraft actuator demand in the USA.

Besides these, large presence of prominent aircraft actuator manufacturers is likely to boost the USA market. The United States houses several leading companies that provide aircraft actuators. Development of new innovative products by these companies is making the USA a dominant market.

How Will Growth Unfold in China Aircraft Actuator Market?

Expansion of Commercial Aviation Sector to Boost Aircraft Actuator Sales in China

China aircraft actuator market is set to rise at 6.1% CAGR between 2022 and 2032. Overall sales of aircraft actuators across China will total a market valuation of US$ 2.1 billion by 2032. The aircraft actuator industry in China grew at a CAGR of 7.5% from 2017 to 2021.

Rapid increase in commercial aircraft in China is set to provide impetus to China aircraft actuator industry. Besides this, various strategies adopted by China-based aircraft actuator companies will shape the market.

For instance, in September 2021, Maxon Group, headquartered in China inaugurated technology center 4 and invests in renewable energies. This step will help to produce higher-quality aircraft actuators.

Category-wise Insights

Which is the Most Sought-After Actuator Type in the Market?

Rotary Type Actuator to be the Top Selling Category

Rotary type actuators segment is projected to witness the most significant growth. This is due to rising applications of this actuator type in aviation and aerospace sectors. Rotary actuator segment grew at around 5.8% CAGR from 2017 to 2021. Over the next ten years, it is forecast to rise at 5% CAGR.

Rotary actuators convert electric, hydraulic, or pneumatic energy into rotary or oscillatory motions. They are used for performing a wide range of applications in aircraft. For instance, they help to nose-wheel steering system pivot through 360° arc needed for precision turning.

Rotary actuators are generally used in automation applications such as valves and gates. This is because of their inherent advantages. For example, demand for their incorporation into modern aircraft platforms is driven by their high efficiency, which ranges from 85% to 92% in single-rack models. Similarly, in double rack models, their efficiency ranges from 92% to 97%.

Which Aircraft Actuator System Will Generate Lucrative Revenues for the Market?

Significant Revenue to be Contributed by Pneumatic Actuators, Fueling Aircraft Actuator Demand

As per FMI, demand in the market will remain high for pneumatic actuators. This is attributed to rising usage of pneumatic aircraft actuators for various applications in aviation sectors.

The expansion of the aerospace & aviation industry can be connected to the increasing need for aircraft actuators. Pneumatic actuator system segment expanded at around 5.6% CAGR from 2017 to 2021. The target segment will rise at 4.9% CAGR between 2022 and 2032.

Pneumatic actuator systems are used to transform energy of compressed air/gas into mechanical motion that regulates one or several final control elements. They are used in various aircraft systems.
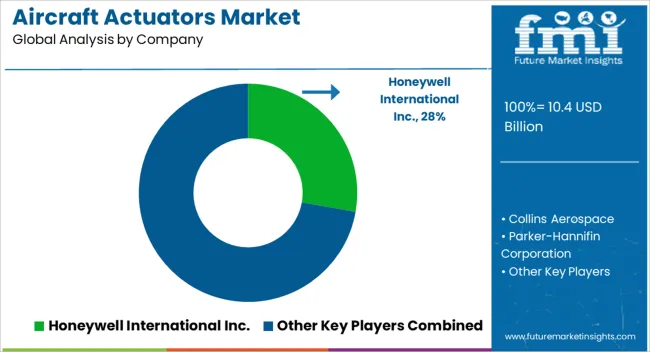
Competitive Landscape:

Leading aircraft actuator manufacturers are launching new innovative products in the market. They are aiming at getting new contracts from aviation companies. Besides this, they are adopting strategies such as mergers, acquisitions, and partnerships.

Recent Developments:

  • In July 2022, to manufacture electromechanical actuators, Hanwha Aerospace partnered with Vertical Aerospace. Vertical Aerospace is a zero-emission, vertical take-off, and landing aircraft manufacturer.
  • In November 2020, Lockheed Martin Corporation gave Moog Inc. a three-year contract worth more than US$200 million to manufacture electro-hydrostatic actuators for the F-35's leading-edge flap drive system and wing fold actuation system. This has assisted Lockheed Martin Corporation in lowering F-35 procurement costs. The cost of each F-35 is now US$ 80 million less expensive.

In July 2022, to provide custom actuation technology on the New A350F Freighter aircraft Curtiss-Wright was awarded contract by Airbus.

Scope of the Report:

Attribute Details
Estimated Market Size (2022) US$ 15.2 billion
Projected Market Size (2032) US$ 25.0 billion
Anticipated Growth Rate (2022 to 2032) 5.1% CAGR
Forecast Period 2022 to 2032
Historical Data Available for 2017 to 2021
Market Analysis US$ Million for Value and MT for Volume
Key Regions Covered North America, Latin America, Europe, Asia Pacific, and the Middle East & Africa
Key Countries Covered United States, Canada, Brazil, Mexico, Germany, United Kingdom, France, Italy, Spain, Nordic, Russia, Poland, China, India, Thailand, Indonesia, Australia and New Zealand, Japan, GCC countries, North Africa, South Africa, and others.
Key Segments Covered Type, End User, System, and Region
Key Companies Profiled
  • Honeywell International
  • AMETEK INC
  • Eaton Corporation plc
  • Moog Inc.
  • Safran SA
  • Raytheon Technologies Corporation
  • Curtiss-Wright Corporation
  • Saab AB
  • Sitec Aerospace GmbH
  • Eaton Corporation
Report Coverage Market Forecast, Company Share Analysis, Competition Intelligence, Drivers Restraints Opportunity Trends Analysis, Market Dynamics and Challenges, and Strategic Growth Initiatives

Aircraft Actuator Segmentation

By Type:

  • Linear
  • Rotary

By End User:

  • Commercial Aircraft
  • Military Aircraft

By System:

  • Hydraulic Actuators
  • Electrical Actuators
  • Pneumatic Actuators
  • Mechanical Actuators

By Region:

  • North America
  • Latin America
  • Europe
  • Asia Pacific
  • Middle East and Africa

Frequently Asked Questions

How Big is the Aircraft Actuator Market?

The market is valued at US$ 15.2 billion in 2023.

How is the Market’s Historical Performance?

The market captured a 6.1% CAGR from 2017 to 2021.

What is the Estimated Market Value for 2032?

By 2032, the market is anticipated to reach US$ 25 billion.

What is the Predicted Market CAGR from 2022 to 2032?

The market’s CAGR from 2022 to 2032 is estimated to be 5.1%.

Who are the Key Aircraft Actuator Companies in the Market?

Eaton Corporation plc, Moog Inc., Safran SA are the key market companies.

Table of Content

1. Executive Summary | Aircraft Actuator Market

        1.1. Global Market Outlook

        1.2. Demand-side Trends

        1.3. Supply-side Trends

        1.4. Technology Roadmap Analysis

        1.5. Analysis and Recommendations

2. Market Overview

        2.1. Market Coverage / Taxonomy

        2.2. Market Definition / Scope / Limitations

3. Market Background

        3.1. Market Dynamics

            3.1.1. Drivers

            3.1.2. Restraints

            3.1.3. Opportunity

            3.1.4. Trends

        3.2. Scenario Forecast

            3.2.1. Demand in Optimistic Scenario

            3.2.2. Demand in Likely Scenario

            3.2.3. Demand in Conservative Scenario

        3.3. Opportunity Map Analysis

        3.4. Product Life Cycle Analysis

        3.5. Supply Chain Analysis

            3.5.1. Supply Side Participants and their Roles

                3.5.1.1. Producers

                3.5.1.2. Mid-Level Participants (Traders/ Agents/ Brokers)

                3.5.1.3. Wholesalers and Distributors

            3.5.2. Value Added and Value Created at Node in the Supply Chain

            3.5.3. List of Raw Material Suppliers

            3.5.4. List of Existing and Potential Buyers

        3.6. Investment Feasibility Matrix

        3.7. Value Chain Analysis

            3.7.1. Profit Margin Analysis

            3.7.2. Wholesalers and Distributors

            3.7.3. Retailers

        3.8. PESTLE and Porter’s Analysis

        3.9. Regulatory Landscape

            3.9.1. By Key Regions

            3.9.2. By Key Countries

        3.10. Regional Parent Market Outlook

        3.11. Production and Consumption Statistics

        3.12. Import and Export Statistics

4. Global Market Analysis 2017 to 2021 and Forecast, 2022 to 2032

        4.1. Historical Market Size Value (US$ Million) & Volume (Units) Analysis, 2017 to 2021

        4.2. Current and Future Market Size Value (US$ Million) & Volume (Units) Projections, 2022 to 2032

            4.2.1. Y-o-Y Growth Trend Analysis

            4.2.2. Absolute $ Opportunity Analysis

5. Global Market Analysis 2017 to 2021 and Forecast 2022 to 2032, By Type

        5.1. Introduction / Key Findings

        5.2. Historical Market Size Value (US$ Million) & Volume (Units) Analysis By Type, 2017 to 2021

        5.3. Current and Future Market Size Value (US$ Million) & Volume (Units) Analysis and Forecast By Type, 2022 to 2032

            5.3.1. Linear

            5.3.2. Rotary

        5.4. Y-o-Y Growth Trend Analysis By Type, 2017 to 2021

        5.5. Absolute $ Opportunity Analysis By Type, 2022 to 2032

 6. Global Market Analysis 2017 to 2021 and Forecast 2022 to 2032, By System

        6.1. Introduction / Key Findings

        6.2. Historical Market Size Value (US$ Million) & Volume (Units) Analysis By System, 2017 to 2021

        6.3. Current and Future Market Size Value (US$ Million) & Volume (Units) Analysis and Forecast By System, 2022 to 2032

            6.3.1. Hydraulic Actuators

            6.3.2. Electrical Actuators

            6.3.3. Pneumatic Actuators

            6.3.4. Mechanical Actuators

        6.4. Y-o-Y Growth Trend Analysis By System, 2017 to 2021

        6.5. Absolute $ Opportunity Analysis By System, 2022 to 2032

7. Global Market Analysis 2017 to 2021 and Forecast 2022 to 2032, By End User

        7.1. Introduction / Key Findings

        7.2. Historical Market Size Value (US$ Million) & Volume (Units) Analysis By End User, 2017 to 2021

        7.3. Current and Future Market Size Value (US$ Million) & Volume (Units) Analysis and Forecast By End User, 2022 to 2032

            7.3.1. Commercial Aircraft

            7.3.2. Military Aircraft

        7.4. Y-o-Y Growth Trend Analysis By End User, 2017 to 2021

        7.5. Absolute $ Opportunity Analysis By End User, 2022 to 2032

8. Global Market Analysis 2017 to 2021 and Forecast 2022 to 2032, By Region

        8.1. Introduction

        8.2. Historical Market Size Value (US$ Million) & Volume (Units) Analysis By Region, 2017 to 2021

        8.3. Current Market Size Value (US$ Million) & Volume (Units) Analysis and Forecast By Region, 2022 to 2032

            8.3.1. North America

            8.3.2. Latin America

            8.3.3. Europe

            8.3.4. Asia Pacific

            8.3.5. Middle East & Africa

        8.4. Market Attractiveness Analysis By Region

9. North America Market Analysis 2017 to 2021 and Forecast 2022 to 2032, By Country

        9.1. Historical Market Size Value (US$ Million) & Volume (Units) Trend Analysis By Market Taxonomy, 2017 to 2021

        9.2. Market Size Value (US$ Million) & Volume (Units) Forecast By Market Taxonomy, 2022 to 2032

            9.2.1. By Country

                9.2.1.1. The USA

                9.2.1.2. Canada

            9.2.2. By Type

            9.2.3. By System

            9.2.4. By End User

        9.3. Market Attractiveness Analysis

            9.3.1. By Country

            9.3.2. By Type

            9.3.3. By System

            9.3.4. By End User

        9.4. Key Takeaways

10. Latin America Market Analysis 2017 to 2021 and Forecast 2022 to 2032, By Country

        10.1. Historical Market Size Value (US$ Million) & Volume (Units) Trend Analysis By Market Taxonomy, 2017 to 2021

        10.2. Market Size Value (US$ Million) & Volume (Units) Forecast By Market Taxonomy, 2022 to 2032

            10.2.1. By Country

                10.2.1.1. Brazil

                10.2.1.2. Mexico

                10.2.1.3. Rest of Latin America

            10.2.2. By Type

            10.2.3. By System

            10.2.4. By End User

        10.3. Market Attractiveness Analysis

            10.3.1. By Country

            10.3.2. By Type

            10.3.3. By System

            10.3.4. By End User

        10.4. Key Takeaways

11. Europe Market Analysis 2017 to 2021 and Forecast 2022 to 2032, By Country

        11.1. Historical Market Size Value (US$ Million) & Volume (Units) Trend Analysis By Market Taxonomy, 2017 to 2021

        11.2. Market Size Value (US$ Million) & Volume (Units) Forecast By Market Taxonomy, 2022 to 2032

            11.2.1. By Country

                11.2.1.1. Germany

                11.2.1.2. The United Kingdom

                11.2.1.3. France

                11.2.1.4. Spain

                11.2.1.5. Italy

                11.2.1.6. Rest of Europe

            11.2.2. By Type

            11.2.3. By System

            11.2.4. By End User

        11.3. Market Attractiveness Analysis

            11.3.1. By Country

            11.3.2. By Type

            11.3.3. By System

            11.3.4. By End User

        11.4. Key Takeaways

12. Asia Pacific Market Analysis 2017 to 2021 and Forecast 2022 to 2032, By Country

        12.1. Historical Market Size Value (US$ Million) & Volume (Units) Trend Analysis By Market Taxonomy, 2017 to 2021

        12.2. Market Size Value (US$ Million) & Volume (Units) Forecast By Market Taxonomy, 2022 to 2032

            12.2.1. By Country

                12.2.1.1. China

                12.2.1.2. Japan

                12.2.1.3. South Korea

                12.2.1.4. Singapore

                12.2.1.5. Thailand

                12.2.1.6. Indonesia

                12.2.1.7. Australia

                12.2.1.8. New Zealand

                12.2.1.9. Rest of Asia Pacific

            12.2.2. By Type

            12.2.3. By System

            12.2.4. By End User

        12.3. Market Attractiveness Analysis

            12.3.1. By Country

            12.3.2. By Type

            12.3.3. By System

            12.3.4. By End User

        12.4. Key Takeaways

13. Middle East & Africa Market Analysis 2017 to 2021 and Forecast 2022 to 2032, By Country

        13.1. Historical Market Size Value (US$ Million) & Volume (Units) Trend Analysis By Market Taxonomy, 2017 to 2021

        13.2. Market Size Value (US$ Million) & Volume (Units) Forecast By Market Taxonomy, 2022 to 2032

            13.2.1. By Country

                13.2.1.1. GCC Countries

                13.2.1.2. South Africa

                13.2.1.3. Israel

                13.2.1.4. Rest of Middle East & Africa

            13.2.2. By Type

            13.2.3. By System

            13.2.4. By End User

        13.3. Market Attractiveness Analysis

            13.3.1. By Country

            13.3.2. By Type

            13.3.3. By System

            13.3.4. By End User

        13.4. Key Takeaways

14. Key Countries Market Analysis

        14.1. The USA

            14.1.1. Pricing Analysis

            14.1.2. Market Share Analysis, 2022

                14.1.2.1. By Type

                14.1.2.2. By System

                14.1.2.3. By End User

        14.2. Canada

            14.2.1. Pricing Analysis

            14.2.2. Market Share Analysis, 2022

                14.2.2.1. By Type

                14.2.2.2. By System

                14.2.2.3. By End User

        14.3. Brazil

            14.3.1. Pricing Analysis

            14.3.2. Market Share Analysis, 2022

                14.3.2.1. By Type

                14.3.2.2. By System

                14.3.2.3. By End User

        14.4. Mexico

            14.4.1. Pricing Analysis

            14.4.2. Market Share Analysis, 2022

                14.4.2.1. By Type

                14.4.2.2. By System

                14.4.2.3. By End User

        14.5. Germany

            14.5.1. Pricing Analysis

            14.5.2. Market Share Analysis, 2022

                14.5.2.1. By Type

                14.5.2.2. By System

                14.5.2.3. By End User

        14.6. The United Kingdom

            14.6.1. Pricing Analysis

            14.6.2. Market Share Analysis, 2022

                14.6.2.1. By Type

                14.6.2.2. By System

                14.6.2.3. By End User

        14.7. France

            14.7.1. Pricing Analysis

            14.7.2. Market Share Analysis, 2022

                14.7.2.1. By Type

                14.7.2.2. By System

                14.7.2.3. By End User

        14.8. Spain

            14.8.1. Pricing Analysis

            14.8.2. Market Share Analysis, 2022

                14.8.2.1. By Type

                14.8.2.2. By System

                14.8.2.3. By End User

        14.9. Italy

            14.9.1. Pricing Analysis

            14.9.2. Market Share Analysis, 2022

                14.9.2.1. By Type

                14.9.2.2. By System

                14.9.2.3. By End User

        14.10. China

            14.10.1. Pricing Analysis

            14.10.2. Market Share Analysis, 2022

                14.10.2.1. By Type

                14.10.2.2. By System

                14.10.2.3. By End User

        14.11. Japan

            14.11.1. Pricing Analysis

            14.11.2. Market Share Analysis, 2022

                14.11.2.1. By Type

                14.11.2.2. By System

                14.11.2.3. By End User

        14.12. South Korea

            14.12.1. Pricing Analysis

            14.12.2. Market Share Analysis, 2022

                14.12.2.1. By Type

                14.12.2.2. By System

                14.12.2.3. By End User

        14.13. Singapore

            14.13.1. Pricing Analysis

            14.13.2. Market Share Analysis, 2022

                14.13.2.1. By Type

                14.13.2.2. By System

                14.13.2.3. By End User

        14.14. Thailand

            14.14.1. Pricing Analysis

            14.14.2. Market Share Analysis, 2022

                14.14.2.1. By Type

                14.14.2.2. By System

                14.14.2.3. By End User

        14.15. Indonesia

            14.15.1. Pricing Analysis

            14.15.2. Market Share Analysis, 2022

                14.15.2.1. By Type

                14.15.2.2. By System

                14.15.2.3. By End User

        14.16. Australia

            14.16.1. Pricing Analysis

            14.16.2. Market Share Analysis, 2022

                14.16.2.1. By Type

                14.16.2.2. By System

                14.16.2.3. By End User

        14.17. New Zealand

            14.17.1. Pricing Analysis

            14.17.2. Market Share Analysis, 2022

                14.17.2.1. By Type

                14.17.2.2. By System

                14.17.2.3. By End User

        14.18. GCC Countries

            14.18.1. Pricing Analysis

            14.18.2. Market Share Analysis, 2022

                14.18.2.1. By Type

                14.18.2.2. By System

                14.18.2.3. By End User

        14.19. South Africa

            14.19.1. Pricing Analysis

            14.19.2. Market Share Analysis, 2022

                14.19.2.1. By Type

                14.19.2.2. By System

                14.19.2.3. By End User

        14.20. Israel

            14.20.1. Pricing Analysis

            14.20.2. Market Share Analysis, 2022

                14.20.2.1. By Type

                14.20.2.2. By System

                14.20.2.3. By End User

15. Market Structure Analysis

        15.1. Competition Dashboard

        15.2. Competition Benchmarking

        15.3. Market Share Analysis of Top Players

            15.3.1. By Regional

            15.3.2. By Type

            15.3.3. By System

            15.3.4. By End User

16. Competition Analysis

        16.1. Competition Deep Dive

            16.1.1. Honeywell International Inc.

                16.1.1.1. Overview

                16.1.1.2. Product Portfolio

                16.1.1.3. Profitability by Market Segments

                16.1.1.4. Sales Footprint

                16.1.1.5. Strategy Overview

                    16.1.1.5.1. Marketing Strategy

                    16.1.1.5.2. Product Strategy

                    16.1.1.5.3. Channel Strategy

            16.1.2. Collins Aerospace

                16.1.2.1. Overview

                16.1.2.2. Product Portfolio

                16.1.2.3. Profitability by Market Segments

                16.1.2.4. Sales Footprint

                16.1.2.5. Strategy Overview

                    16.1.2.5.1. Marketing Strategy

                    16.1.2.5.2. Product Strategy

                    16.1.2.5.3. Channel Strategy

            16.1.3. Parker-Hannifin Corporation

                16.1.3.1. Overview

                16.1.3.2. Product Portfolio

                16.1.3.3. Profitability by Market Segments

                16.1.3.4. Sales Footprint

                16.1.3.5. Strategy Overview

                    16.1.3.5.1. Marketing Strategy

                    16.1.3.5.2. Product Strategy

                    16.1.3.5.3. Channel Strategy

            16.1.4. Moog Inc.

                16.1.4.1. Overview

                16.1.4.2. Product Portfolio

                16.1.4.3. Profitability by Market Segments

                16.1.4.4. Sales Footprint

                16.1.4.5. Strategy Overview

                    16.1.4.5.1. Marketing Strategy

                    16.1.4.5.2. Product Strategy

                    16.1.4.5.3. Channel Strategy

            16.1.5. Eaton

                16.1.5.1. Overview

                16.1.5.2. Product Portfolio

                16.1.5.3. Profitability by Market Segments

                16.1.5.4. Sales Footprint

                16.1.5.5. Strategy Overview

                    16.1.5.5.1. Marketing Strategy

                    16.1.5.5.2. Product Strategy

                    16.1.5.5.3. Channel Strategy

            16.1.6. Safron S.A.

                16.1.6.1. Overview

                16.1.6.2. Product Portfolio

                16.1.6.3. Profitability by Market Segments

                16.1.6.4. Sales Footprint

                16.1.6.5. Strategy Overview

                    16.1.6.5.1. Marketing Strategy

                    16.1.6.5.2. Product Strategy

                    16.1.6.5.3. Channel Strategy

            16.1.7. Liebherr-International Deutschland GmbH

                16.1.7.1. Overview

                16.1.7.2. Product Portfolio

                16.1.7.3. Profitability by Market Segments

                16.1.7.4. Sales Footprint

                16.1.7.5. Strategy Overview

                    16.1.7.5.1. Marketing Strategy

                    16.1.7.5.2. Product Strategy

                    16.1.7.5.3. Channel Strategy

            16.1.8. Ratheon Technologies Corporation

                16.1.8.1. Overview

                16.1.8.2. Product Portfolio

                16.1.8.3. Profitability by Market Segments

                16.1.8.4. Sales Footprint

                16.1.8.5. Strategy Overview

                    16.1.8.5.1. Marketing Strategy

                    16.1.8.5.2. Product Strategy

                    16.1.8.5.3. Channel Strategy

            16.1.9. Curtiss-Wright Corporation

                16.1.9.1. Overview

                16.1.9.2. Product Portfolio

                16.1.9.3. Profitability by Market Segments

                16.1.9.4. Sales Footprint

                16.1.9.5. Strategy Overview

                    16.1.9.5.1. Marketing Strategy

                    16.1.9.5.2. Product Strategy

                    16.1.9.5.3. Channel Strategy

            16.1.10. Astronics Corporation

                16.1.10.1. Overview

                16.1.10.2. Product Portfolio

                16.1.10.3. Profitability by Market Segments

                16.1.10.4. Sales Footprint

                16.1.10.5. Strategy Overview

                    16.1.10.5.1. Marketing Strategy

                    16.1.10.5.2. Product Strategy

                    16.1.10.5.3. Channel Strategy

17. Assumptions & Acronyms Used

18. Research Methodolog

Don't pay for what you don't need

Customize your report by selecting specific countries or regions and save 30%!

List of Tables

Table 1: Global Market Value (US$ Million) Forecast by Region, 2017 to 2032

Table 2: Global Market Volume (Units) Forecast by Region, 2017 to 2032

Table 3: Global Market Value (US$ Million) Forecast by Type, 2017 to 2032

Table 4: Global Market Volume (Units) Forecast by Type, 2017 to 2032

Table 5: Global Market Value (US$ Million) Forecast by System, 2017 to 2032

Table 6: Global Market Volume (Units) Forecast by System, 2017 to 2032

Table 7: Global Market Value (US$ Million) Forecast by End User, 2017 to 2032

Table 8: Global Market Volume (Units) Forecast by End User, 2017 to 2032

Table 9: North America Market Value (US$ Million) Forecast by Country, 2017 to 2032

Table 10: North America Market Volume (Units) Forecast by Country, 2017 to 2032

Table 11: North America Market Value (US$ Million) Forecast by Type, 2017 to 2032

Table 12: North America Market Volume (Units) Forecast by Type, 2017 to 2032

Table 13: North America Market Value (US$ Million) Forecast by System, 2017 to 2032

Table 14: North America Market Volume (Units) Forecast by System, 2017 to 2032

Table 15: North America Market Value (US$ Million) Forecast by End User, 2017 to 2032

Table 16: North America Market Volume (Units) Forecast by End User, 2017 to 2032

Table 17: Latin America Market Value (US$ Million) Forecast by Country, 2017 to 2032

Table 18: Latin America Market Volume (Units) Forecast by Country, 2017 to 2032

Table 19: Latin America Market Value (US$ Million) Forecast by Type, 2017 to 2032

Table 20: Latin America Market Volume (Units) Forecast by Type, 2017 to 2032

Table 21: Latin America Market Value (US$ Million) Forecast by System, 2017 to 2032

Table 22: Latin America Market Volume (Units) Forecast by System, 2017 to 2032

Table 23: Latin America Market Value (US$ Million) Forecast by End User, 2017 to 2032

Table 24: Latin America Market Volume (Units) Forecast by End User, 2017 to 2032

Table 25: Europe Market Value (US$ Million) Forecast by Country, 2017 to 2032

Table 26: Europe Market Volume (Units) Forecast by Country, 2017 to 2032

Table 27: Europe Market Value (US$ Million) Forecast by Type, 2017 to 2032

Table 28: Europe Market Volume (Units) Forecast by Type, 2017 to 2032

Table 29: Europe Market Value (US$ Million) Forecast by System, 2017 to 2032

Table 30: Europe Market Volume (Units) Forecast by System, 2017 to 2032

Table 31: Europe Market Value (US$ Million) Forecast by End User, 2017 to 2032

Table 32: Europe Market Volume (Units) Forecast by End User, 2017 to 2032

Table 33: Asia Pacific Market Value (US$ Million) Forecast by Country, 2017 to 2032

Table 34: Asia Pacific Market Volume (Units) Forecast by Country, 2017 to 2032

Table 35: Asia Pacific Market Value (US$ Million) Forecast by Type, 2017 to 2032

Table 36: Asia Pacific Market Volume (Units) Forecast by Type, 2017 to 2032

Table 37: Asia Pacific Market Value (US$ Million) Forecast by System, 2017 to 2032

Table 38: Asia Pacific Market Volume (Units) Forecast by System, 2017 to 2032

Table 39: Asia Pacific Market Value (US$ Million) Forecast by End User, 2017 to 2032

Table 40: Asia Pacific Market Volume (Units) Forecast by End User, 2017 to 2032

Table 41: Middle East & Africa Market Value (US$ Million) Forecast by Country, 2017 to 2032

Table 42: Middle East & Africa Market Volume (Units) Forecast by Country, 2017 to 2032

Table 43: Middle East & Africa Market Value (US$ Million) Forecast by Type, 2017 to 2032

Table 44: Middle East & Africa Market Volume (Units) Forecast by Type, 2017 to 2032

Table 45: Middle East & Africa Market Value (US$ Million) Forecast by System, 2017 to 2032

Table 46: Middle East & Africa Market Volume (Units) Forecast by System, 2017 to 2032

Table 47: Middle East & Africa Market Value (US$ Million) Forecast by End User, 2017 to 2032

Table 48: Middle East & Africa Market Volume (Units) Forecast by End User, 2017 to 2032
Sudip Saha
Sudip Saha

Principal Consultant

Talk to Analyst

Find your sweet spots for generating winning opportunities in this market.

List of Charts

Figure 1: Global Market Value (US$ Million) by Type, 2022 to 2032

Figure 2: Global Market Value (US$ Million) by System, 2022 to 2032

Figure 3: Global Market Value (US$ Million) by End User, 2022 to 2032

Figure 4: Global Market Value (US$ Million) by Region, 2022 to 2032

Figure 5: Global Market Value (US$ Million) Analysis by Region, 2017 to 2032

Figure 6: Global Market Volume (Units) Analysis by Region, 2017 to 2032

Figure 7: Global Market Value Share (%) and BPS Analysis by Region, 2022 to 2032

Figure 8: Global Market Y-o-Y Growth (%) Projections by Region, 2022 to 2032

Figure 9: Global Market Value (US$ Million) Analysis by Type, 2017 to 2032

Figure 10: Global Market Volume (Units) Analysis by Type, 2017 to 2032

Figure 11: Global Market Value Share (%) and BPS Analysis by Type, 2022 to 2032

Figure 12: Global Market Y-o-Y Growth (%) Projections by Type, 2022 to 2032

Figure 13: Global Market Value (US$ Million) Analysis by System, 2017 to 2032

Figure 14: Global Market Volume (Units) Analysis by System, 2017 to 2032

Figure 15: Global Market Value Share (%) and BPS Analysis by System, 2022 to 2032

Figure 16: Global Market Y-o-Y Growth (%) Projections by System, 2022 to 2032

Figure 17: Global Market Value (US$ Million) Analysis by End User, 2017 to 2032

Figure 18: Global Market Volume (Units) Analysis by End User, 2017 to 2032

Figure 19: Global Market Value Share (%) and BPS Analysis by End User, 2022 to 2032

Figure 20: Global Market Y-o-Y Growth (%) Projections by End User, 2022 to 2032

Figure 21: Global Market Attractiveness by Type, 2022 to 2032

Figure 22: Global Market Attractiveness by System, 2022 to 2032

Figure 23: Global Market Attractiveness by End User, 2022 to 2032

Figure 24: Global Market Attractiveness by Region, 2022 to 2032

Figure 25: North America Market Value (US$ Million) by Type, 2022 to 2032

Figure 26: North America Market Value (US$ Million) by System, 2022 to 2032

Figure 27: North America Market Value (US$ Million) by End User, 2022 to 2032

Figure 28: North America Market Value (US$ Million) by Country, 2022 to 2032

Figure 29: North America Market Value (US$ Million) Analysis by Country, 2017 to 2032

Figure 30: North America Market Volume (Units) Analysis by Country, 2017 to 2032

Figure 31: North America Market Value Share (%) and BPS Analysis by Country, 2022 to 2032

Figure 32: North America Market Y-o-Y Growth (%) Projections by Country, 2022 to 2032

Figure 33: North America Market Value (US$ Million) Analysis by Type, 2017 to 2032

Figure 34: North America Market Volume (Units) Analysis by Type, 2017 to 2032

Figure 35: North America Market Value Share (%) and BPS Analysis by Type, 2022 to 2032

Figure 36: North America Market Y-o-Y Growth (%) Projections by Type, 2022 to 2032

Figure 37: North America Market Value (US$ Million) Analysis by System, 2017 to 2032

Figure 38: North America Market Volume (Units) Analysis by System, 2017 to 2032

Figure 39: North America Market Value Share (%) and BPS Analysis by System, 2022 to 2032

Figure 40: North America Market Y-o-Y Growth (%) Projections by System, 2022 to 2032

Figure 41: North America Market Value (US$ Million) Analysis by End User, 2017 to 2032

Figure 42: North America Market Volume (Units) Analysis by End User, 2017 to 2032

Figure 43: North America Market Value Share (%) and BPS Analysis by End User, 2022 to 2032

Figure 44: North America Market Y-o-Y Growth (%) Projections by End User, 2022 to 2032

Figure 45: North America Market Attractiveness by Type, 2022 to 2032

Figure 46: North America Market Attractiveness by System, 2022 to 2032

Figure 47: North America Market Attractiveness by End User, 2022 to 2032

Figure 48: North America Market Attractiveness by Country, 2022 to 2032

Figure 49: Latin America Market Value (US$ Million) by Type, 2022 to 2032

Figure 50: Latin America Market Value (US$ Million) by System, 2022 to 2032

Figure 51: Latin America Market Value (US$ Million) by End User, 2022 to 2032

Figure 52: Latin America Market Value (US$ Million) by Country, 2022 to 2032

Figure 53: Latin America Market Value (US$ Million) Analysis by Country, 2017 to 2032

Figure 54: Latin America Market Volume (Units) Analysis by Country, 2017 to 2032

Figure 55: Latin America Market Value Share (%) and BPS Analysis by Country, 2022 to 2032

Figure 56: Latin America Market Y-o-Y Growth (%) Projections by Country, 2022 to 2032

Figure 57: Latin America Market Value (US$ Million) Analysis by Type, 2017 to 2032

Figure 58: Latin America Market Volume (Units) Analysis by Type, 2017 to 2032

Figure 59: Latin America Market Value Share (%) and BPS Analysis by Type, 2022 to 2032

Figure 60: Latin America Market Y-o-Y Growth (%) Projections by Type, 2022 to 2032

Figure 61: Latin America Market Value (US$ Million) Analysis by System, 2017 to 2032

Figure 62: Latin America Market Volume (Units) Analysis by System, 2017 to 2032

Figure 63: Latin America Market Value Share (%) and BPS Analysis by System, 2022 to 2032

Figure 64: Latin America Market Y-o-Y Growth (%) Projections by System, 2022 to 2032

Figure 65: Latin America Market Value (US$ Million) Analysis by End User, 2017 to 2032

Figure 66: Latin America Market Volume (Units) Analysis by End User, 2017 to 2032

Figure 67: Latin America Market Value Share (%) and BPS Analysis by End User, 2022 to 2032

Figure 68: Latin America Market Y-o-Y Growth (%) Projections by End User, 2022 to 2032

Figure 69: Latin America Market Attractiveness by Type, 2022 to 2032

Figure 70: Latin America Market Attractiveness by System, 2022 to 2032

Figure 71: Latin America Market Attractiveness by End User, 2022 to 2032

Figure 72: Latin America Market Attractiveness by Country, 2022 to 2032

Figure 73: Europe Market Value (US$ Million) by Type, 2022 to 2032

Figure 74: Europe Market Value (US$ Million) by System, 2022 to 2032

Figure 75: Europe Market Value (US$ Million) by End User, 2022 to 2032

Figure 76: Europe Market Value (US$ Million) by Country, 2022 to 2032

Figure 77: Europe Market Value (US$ Million) Analysis by Country, 2017 to 2032

Figure 78: Europe Market Volume (Units) Analysis by Country, 2017 to 2032

Figure 79: Europe Market Value Share (%) and BPS Analysis by Country, 2022 to 2032

Figure 80: Europe Market Y-o-Y Growth (%) Projections by Country, 2022 to 2032

Figure 81: Europe Market Value (US$ Million) Analysis by Type, 2017 to 2032

Figure 82: Europe Market Volume (Units) Analysis by Type, 2017 to 2032

Figure 83: Europe Market Value Share (%) and BPS Analysis by Type, 2022 to 2032

Figure 84: Europe Market Y-o-Y Growth (%) Projections by Type, 2022 to 2032

Figure 85: Europe Market Value (US$ Million) Analysis by System, 2017 to 2032

Figure 86: Europe Market Volume (Units) Analysis by System, 2017 to 2032

Figure 87: Europe Market Value Share (%) and BPS Analysis by System, 2022 to 2032

Figure 88: Europe Market Y-o-Y Growth (%) Projections by System, 2022 to 2032

Figure 89: Europe Market Value (US$ Million) Analysis by End User, 2017 to 2032

Figure 90: Europe Market Volume (Units) Analysis by End User, 2017 to 2032

Figure 91: Europe Market Value Share (%) and BPS Analysis by End User, 2022 to 2032

Figure 92: Europe Market Y-o-Y Growth (%) Projections by End User, 2022 to 2032

Figure 93: Europe Market Attractiveness by Type, 2022 to 2032

Figure 94: Europe Market Attractiveness by System, 2022 to 2032

Figure 95: Europe Market Attractiveness by End User, 2022 to 2032

Figure 96: Europe Market Attractiveness by Country, 2022 to 2032

Figure 97: Asia Pacific Market Value (US$ Million) by Type, 2022 to 2032

Figure 98: Asia Pacific Market Value (US$ Million) by System, 2022 to 2032

Figure 99: Asia Pacific Market Value (US$ Million) by End User, 2022 to 2032

Figure 100: Asia Pacific Market Value (US$ Million) by Country, 2022 to 2032

Figure 101: Asia Pacific Market Value (US$ Million) Analysis by Country, 2017 to 2032

Figure 102: Asia Pacific Market Volume (Units) Analysis by Country, 2017 to 2032

Figure 103: Asia Pacific Market Value Share (%) and BPS Analysis by Country, 2022 to 2032

Figure 104: Asia Pacific Market Y-o-Y Growth (%) Projections by Country, 2022 to 2032

Figure 105: Asia Pacific Market Value (US$ Million) Analysis by Type, 2017 to 2032

Figure 106: Asia Pacific Market Volume (Units) Analysis by Type, 2017 to 2032

Figure 107: Asia Pacific Market Value Share (%) and BPS Analysis by Type, 2022 to 2032

Figure 108: Asia Pacific Market Y-o-Y Growth (%) Projections by Type, 2022 to 2032

Figure 109: Asia Pacific Market Value (US$ Million) Analysis by System, 2017 to 2032

Figure 110: Asia Pacific Market Volume (Units) Analysis by System, 2017 to 2032

Figure 111: Asia Pacific Market Value Share (%) and BPS Analysis by System, 2022 to 2032

Figure 112: Asia Pacific Market Y-o-Y Growth (%) Projections by System, 2022 to 2032

Figure 113: Asia Pacific Market Value (US$ Million) Analysis by End User, 2017 to 2032

Figure 114: Asia Pacific Market Volume (Units) Analysis by End User, 2017 to 2032

Figure 115: Asia Pacific Market Value Share (%) and BPS Analysis by End User, 2022 to 2032

Figure 116: Asia Pacific Market Y-o-Y Growth (%) Projections by End User, 2022 to 2032

Figure 117: Asia Pacific Market Attractiveness by Type, 2022 to 2032

Figure 118: Asia Pacific Market Attractiveness by System, 2022 to 2032

Figure 119: Asia Pacific Market Attractiveness by End User, 2022 to 2032

Figure 120: Asia Pacific Market Attractiveness by Country, 2022 to 2032

Figure 121: Middle East & Africa Market Value (US$ Million) by Type, 2022 to 2032

Figure 122: Middle East & Africa Market Value (US$ Million) by System, 2022 to 2032

Figure 123: Middle East & Africa Market Value (US$ Million) by End User, 2022 to 2032

Figure 124: Middle East & Africa Market Value (US$ Million) by Country, 2022 to 2032

Figure 125: Middle East & Africa Market Value (US$ Million) Analysis by Country, 2017 to 2032

Figure 126: Middle East & Africa Market Volume (Units) Analysis by Country, 2017 to 2032

Figure 127: Middle East & Africa Market Value Share (%) and BPS Analysis by Country, 2022 to 2032

Figure 128: Middle East & Africa Market Y-o-Y Growth (%) Projections by Country, 2022 to 2032

Figure 129: Middle East & Africa Market Value (US$ Million) Analysis by Type, 2017 to 2032

Figure 130: Middle East & Africa Market Volume (Units) Analysis by Type, 2017 to 2032

Figure 131: Middle East & Africa Market Value Share (%) and BPS Analysis by Type, 2022 to 2032

Figure 132: Middle East & Africa Market Y-o-Y Growth (%) Projections by Type, 2022 to 2032

Figure 133: Middle East & Africa Market Value (US$ Million) Analysis by System, 2017 to 2032

Figure 134: Middle East & Africa Market Volume (Units) Analysis by System, 2017 to 2032

Figure 135: Middle East & Africa Market Value Share (%) and BPS Analysis by System, 2022 to 2032

Figure 136: Middle East & Africa Market Y-o-Y Growth (%) Projections by System, 2022 to 2032

Figure 137: Middle East & Africa Market Value (US$ Million) Analysis by End User, 2017 to 2032

Figure 138: Middle East & Africa Market Volume (Units) Analysis by End User, 2017 to 2032

Figure 139: Middle East & Africa Market Value Share (%) and BPS Analysis by End User, 2022 to 2032

Figure 140: Middle East & Africa Market Y-o-Y Growth (%) Projections by End User, 2022 to 2032

Figure 141: Middle East & Africa Market Attractiveness by Type, 2022 to 2032

Figure 142: Middle East & Africa Market Attractiveness by System, 2022 to 2032

Figure 143: Middle East & Africa Market Attractiveness by End User, 2022 to 2032

Figure 144: Middle East & Africa Market Attractiveness by Country, 2022 to 2032

Recommendations

Technology

Automotive Semiconductor Market

Published : February 2023

Industrial Automation

Pneumatic Actuator Market

Published : February 2023

Automotive

Aircraft Seat Actuation Systems Market

Published : December 2022

Industrial Automation

VVT Actuators Market

Published : August 2022

Explore Technology Insights

View Reports