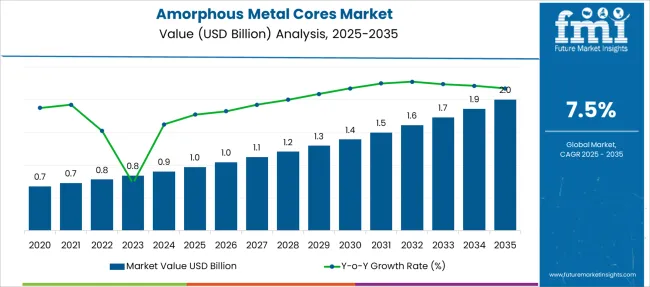
The amorphous metal cores market is expected to record a CAGR of 7.5% during the forecast period 2022 to 2032, up from USD 781.6 Million in the year 2022 to reach a valuation of USD 1610.90 Million by 2032.
Report Attributes | Details |
---|---|
CAGR | 7.5% |
Value (2022) | USD 781.6 Million |
Value (2032) | USD 1610.90 Million |
The amorphous metal cores market is anticipated to show promising growth prospects in the forecasted period 2022 to 2032.
The amorphous alloy in the iron core of the transformer significantly reduces energy costs and helps increase electrical characteristics while reducing the level of CO2 emissions. Power transmission equipment manufacturers today are searching for a technology that saves energy and decreases their operating costs.
This has encouraged amorphous metal cores manufacturers to develop optimized and energy-efficient products for use in distribution transformers. Normally, 10% of the total electricity generated by an electric company is lost during the distribution and transmission process.
Thus, distribution transformers consisting of amorphous metal cores help save a significant amount of energy and cost. Other uses that benefit from amorphous metal cores include output filter chokes in large Switched-Mode Power Supply (SMPS), power factor correction chokes in UPS systems, and high-power lamp ballasts.
The initial costs of amorphous metal cores are relatively higher as compared to crystalline silicon steel owing to certain beneficial properties such as lower saturation magnetic flux density of amorphous steel than that of silicon steel, which is mostly preferred by transformer manufacturers.
This results in a high cost per unit of large-sized amorphous core transformers. Although, its increased energy efficiency and low operational costs throughout the lifetime of the transformer could help compensate for its substantial initial costs. Therefore, despite high costs, the above-mentioned factors are estimated to boost the market demand for amorphous metal cores in the coming years.
On the other hand, amorphous metal cores have various limitations which may curb the market growth. Hardness, along with reduced thickness, makes slitting and shearing difficult. Moreover, the brittleness property of amorphous metal cores has also made them un-friendly to transformer manufacturers. Due to these limitations, the amorphous metal core technology has been limited at present to very few customers across geographies.
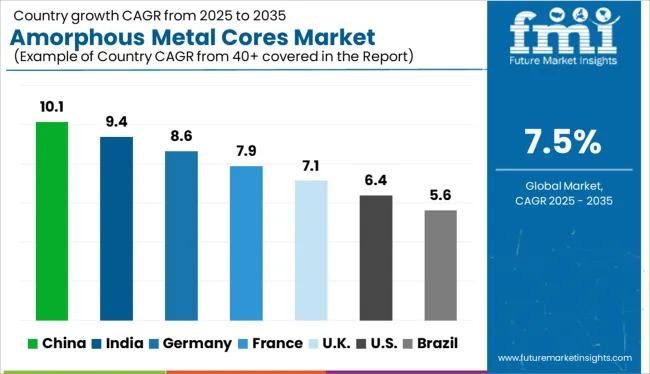
In North America, the global amorphous metal cores market is projected to witness lucrative growth opportunities owing to the USA agreeing to expand the production of amorphous metal core transformers for efficient distribution & transmission of electricity.
The amorphous metal cores market is expected to grow at a rapid pace during the forecast period, due to the high per capita electricity consumption in the USA Governments and utilities are taking various initiatives to introduce energy-efficient transforming solutions, which is anticipated to drive revenue growth.
Moreover, regions such as East Asia and South Asia are also estimated to witness lackluster growth driven by major installations of amorphous metal core transformers in India and China. The recent electrification projects are heavily investing in energy-efficient technology which is expected to drive growth for the amorphous metal cores market over the slated time period.
The European countries are also facing an upsurge in the amorphous metal cores market. For instance, Spanish utility companies have started to import the amorphous metal core transformers and are also promoting in-house manufacturing of the same with local manufacturers.
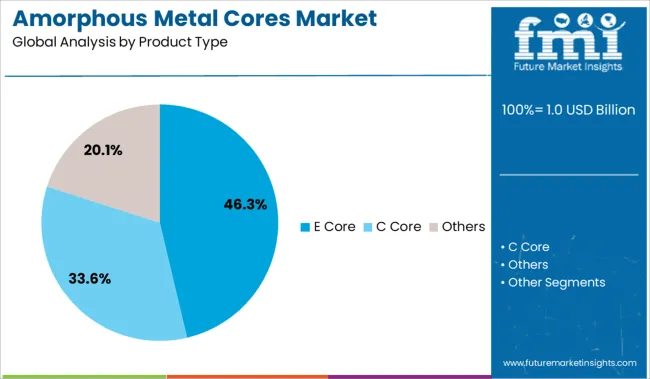
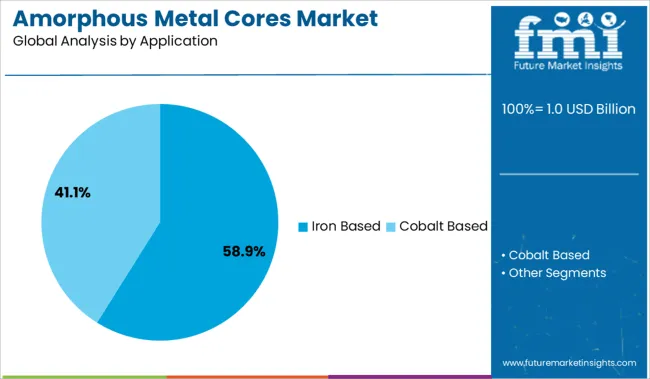
Since amorphous metal cores do not have anisotropic properties, it shows excellent magnetic behavior such as minimum iron loss while having high-saturation magnetic flux density with high permeability. Amorphous metal cores are generally used in distribution transformers.
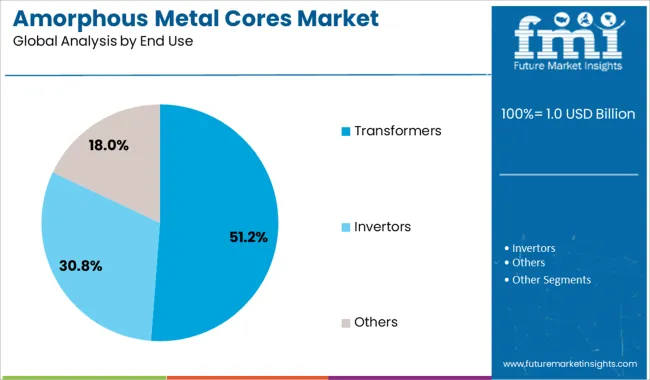
In terms of the end-use sector, Amorphous metal cores are commonly preferred in renewable energy systems such as solar power and wind energy, as they typically operate with 20 - 40% low load conditions. Amorphous metal cores have been used in liquid-filled transformers for over 20 years, and now this technology is trending in dry-type transformers as well.
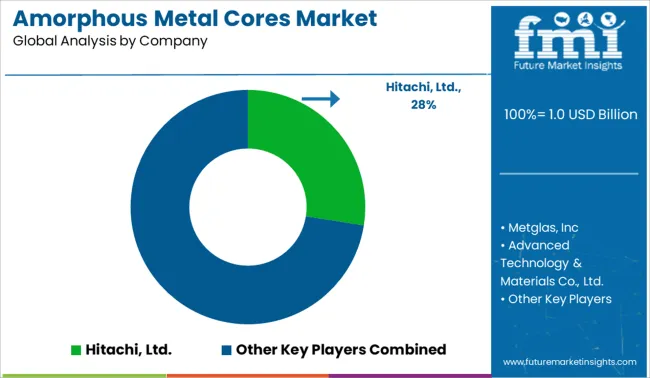
The global amorphous metal cores market has numerous small-scale and international manufacturers at the regional level. Few industry players are identified across the value chain of the global amorphous metal cores market, which are Hitachi, Ltd., Advanced Technology & Materials Co., Ltd., Zhaojing Incorporated, Qingdao Yunlu New Energy Technology Co., Ltd., China Amorphous Technology Co.,Ltd, ENPAY, Mangal Electrical Industries Pvt. Ltd., KOTSONS Pvt. Ltd., Usha Amorphous Metals Ltd., and Ti-Electronic.
Report Attribute | Details |
---|---|
Growth rate | CAGR of 7.5% from 2022 to 2032 |
Base year for estimation | 2021 |
Historical data | 2015 to 2021 |
Forecast period | 2022 to 2032 |
Quantitative units | Revenue in USD Million/ Billion and CAGR from 2022 to 2032 |
Report coverage | Revenue forecast, volume forecast, company ranking, competitive landscape, growth factors, and trends, Pricing Analysis |
Segments covered | Product Type, Application, End Use & Region |
Regional scope | North America (USA, Canada); Latin America (Mexico, Brazil); North America (USA, Canada); Latin America (Mexico, Brazil); Western Europe (Germany, Italy, France, UK, Spain); Eastern Europe (Poland, Russia); Asia Pacific (China, India, ASEAN, Australia & New Zealand); Japan; Middle East and Africa (GCC Countries, S. Africa, Northern Africa) |
Country scope | USA, Canada, Mexico, Brazil, USA, Canada, Mexico, Brazil, Germany, Italy, France, UK, Spain, Poland, Russia, China, India, ASEAN, Australia & New Zealand, Japan, GCC Countries, S. Africa, Northern Africa |
Key companies profiled | Hitachi, Ltd., Advanced Technology & Materials Co., Ltd., Zhaojing Incorporated, Qingdao Yunlu New Energy Technology Co., Ltd., China Amorphous Technology Co.,Ltd, ENPAY, Mangal Electrical Industries Pvt. Ltd., KOTSONS Pvt. Ltd., Usha Amorphous Metals Ltd., Ti-Electronic |
Customization scope | Free report customization (equivalent to up to 8 analysts working days) with purchase. Addition or alteration to country, regional & segment scope. |
Pricing and purchase options | Avail customized purchase options to meet your exact research needs. |
Table 1: Global Amorphous Metal Cores Market Value (US$ Mn) Forecast by Region, 2017-2032
Table 2: Global Amorphous Metal Cores Market Volume (Tons) Forecast by Region, 2017-2032
Table 3: Global Amorphous Metal Cores Market Value (US$ Mn) Forecast by Core Type, 2017-2032
Table 4: Global Amorphous Metal Cores Market Volume (Tons) Forecast by Core Type, 2017-2032
Table 5: Global Amorphous Metal Cores Market Value (US$ Mn) Forecast by Material Type, 2017-2032
Table 6: Global Amorphous Metal Cores Market Volume (Tons) Forecast by Material Type, 2017-2032
Table 7: Global Amorphous Metal Cores Market Value (US$ Mn) Forecast by Application, 2017-2032
Table 8: Global Amorphous Metal Cores Market Volume (Tons) Forecast by Application, 2017-2032
Table 9: North America Amorphous Metal Cores Market Value (US$ Mn) Forecast by Country, 2017-2032
Table 10: North America Amorphous Metal Cores Market Volume (Tons) Forecast by Country, 2017-2032
Table 11: North America Amorphous Metal Cores Market Value (US$ Mn) Forecast by Core Type, 2017-2032
Table 12: North America Amorphous Metal Cores Market Volume (Tons) Forecast by Core Type, 2017-2032
Table 13: North America Amorphous Metal Cores Market Value (US$ Mn) Forecast by Material Type, 2017-2032
Table 14: North America Amorphous Metal Cores Market Volume (Tons) Forecast by Material Type, 2017-2032
Table 15: North America Amorphous Metal Cores Market Value (US$ Mn) Forecast by Application, 2017-2032
Table 16: North America Amorphous Metal Cores Market Volume (Tons) Forecast by Application, 2017-2032
Table 17: Latin America Amorphous Metal Cores Market Value (US$ Mn) Forecast by Country, 2017-2032
Table 18: Latin America Amorphous Metal Cores Market Volume (Tons) Forecast by Country, 2017-2032
Table 19: Latin America Amorphous Metal Cores Market Value (US$ Mn) Forecast by Core Type, 2017-2032
Table 20: Latin America Amorphous Metal Cores Market Volume (Tons) Forecast by Core Type, 2017-2032
Table 21: Latin America Amorphous Metal Cores Market Value (US$ Mn) Forecast by Material Type, 2017-2032
Table 22: Latin America Amorphous Metal Cores Market Volume (Tons) Forecast by Material Type, 2017-2032
Table 23: Latin America Amorphous Metal Cores Market Value (US$ Mn) Forecast by Application, 2017-2032
Table 24: Latin America Amorphous Metal Cores Market Volume (Tons) Forecast by Application, 2017-2032
Table 25: Europe Amorphous Metal Cores Market Value (US$ Mn) Forecast by Country, 2017-2032
Table 26: Europe Amorphous Metal Cores Market Volume (Tons) Forecast by Country, 2017-2032
Table 27: Europe Amorphous Metal Cores Market Value (US$ Mn) Forecast by Core Type, 2017-2032
Table 28: Europe Amorphous Metal Cores Market Volume (Tons) Forecast by Core Type, 2017-2032
Table 29: Europe Amorphous Metal Cores Market Value (US$ Mn) Forecast by Material Type, 2017-2032
Table 30: Europe Amorphous Metal Cores Market Volume (Tons) Forecast by Material Type, 2017-2032
Table 31: Europe Amorphous Metal Cores Market Value (US$ Mn) Forecast by Application, 2017-2032
Table 32: Europe Amorphous Metal Cores Market Volume (Tons) Forecast by Application, 2017-2032
Table 33: East Asia Amorphous Metal Cores Market Value (US$ Mn) Forecast by Country, 2017-2032
Table 34: East Asia Amorphous Metal Cores Market Volume (Tons) Forecast by Country, 2017-2032
Table 35: East Asia Amorphous Metal Cores Market Value (US$ Mn) Forecast by Core Type, 2017-2032
Table 36: East Asia Amorphous Metal Cores Market Volume (Tons) Forecast by Core Type, 2017-2032
Table 37: East Asia Amorphous Metal Cores Market Value (US$ Mn) Forecast by Material Type, 2017-2032
Table 38: East Asia Amorphous Metal Cores Market Volume (Tons) Forecast by Material Type, 2017-2032
Table 39: East Asia Amorphous Metal Cores Market Value (US$ Mn) Forecast by Application, 2017-2032
Table 40: East Asia Amorphous Metal Cores Market Volume (Tons) Forecast by Application, 2017-2032
Table 41: South Asia & Pacific Amorphous Metal Cores Market Value (US$ Mn) Forecast by Country, 2017-2032
Table 42: South Asia & Pacific Amorphous Metal Cores Market Volume (Tons) Forecast by Country, 2017-2032
Table 43: South Asia & Pacific Amorphous Metal Cores Market Value (US$ Mn) Forecast by Core Type, 2017-2032
Table 44: South Asia & Pacific Amorphous Metal Cores Market Volume (Tons) Forecast by Core Type, 2017-2032
Table 45: South Asia & Pacific Amorphous Metal Cores Market Value (US$ Mn) Forecast by Material Type, 2017-2032
Table 46: South Asia & Pacific Amorphous Metal Cores Market Volume (Tons) Forecast by Material Type, 2017-2032
Table 47: South Asia & Pacific Amorphous Metal Cores Market Value (US$ Mn) Forecast by Application, 2017-2032
Table 48: South Asia & Pacific Amorphous Metal Cores Market Volume (Tons) Forecast by Application, 2017-2032
Table 49: MEA Amorphous Metal Cores Market Value (US$ Mn) Forecast by Country, 2017-2032
Table 50: MEA Amorphous Metal Cores Market Volume (Tons) Forecast by Country, 2017-2032
Table 51: MEA Amorphous Metal Cores Market Value (US$ Mn) Forecast by Core Type, 2017-2032
Table 52: MEA Amorphous Metal Cores Market Volume (Tons) Forecast by Core Type, 2017-2032
Table 53: MEA Amorphous Metal Cores Market Value (US$ Mn) Forecast by Material Type, 2017-2032
Table 54: MEA Amorphous Metal Cores Market Volume (Tons) Forecast by Material Type, 2017-2032
Table 55: MEA Amorphous Metal Cores Market Value (US$ Mn) Forecast by Application, 2017-2032
Table 56: MEA Amorphous Metal Cores Market Volume (Tons) Forecast by Application, 2017-2032
Figure 1: Global Amorphous Metal Cores Market Value (US$ Mn) by Core Type, 2022-2032
Figure 2: Global Amorphous Metal Cores Market Value (US$ Mn) by Material Type, 2022-2032
Figure 3: Global Amorphous Metal Cores Market Value (US$ Mn) by Application, 2022-2032
Figure 4: Global Amorphous Metal Cores Market Value (US$ Mn) by Region, 2022-2032
Figure 5: Global Amorphous Metal Cores Market Value (US$ Mn) Analysis by Region, 2017-2032
Figure 6: Global Amorphous Metal Cores Market Volume (Tons) Analysis by Region, 2017-2032
Figure 7: Global Amorphous Metal Cores Market Value Share (%) and BPS Analysis by Region, 2022-2032
Figure 8: Global Amorphous Metal Cores Market Y-o-Y Growth (%) Projections by Region, 2022-2032
Figure 9: Global Amorphous Metal Cores Market Value (US$ Mn) Analysis by Core Type, 2017-2032
Figure 10: Global Amorphous Metal Cores Market Volume (Tons) Analysis by Core Type, 2017-2032
Figure 11: Global Amorphous Metal Cores Market Value Share (%) and BPS Analysis by Core Type, 2022-2032
Figure 12: Global Amorphous Metal Cores Market Y-o-Y Growth (%) Projections by Core Type, 2022-2032
Figure 13: Global Amorphous Metal Cores Market Value (US$ Mn) Analysis by Material Type, 2017-2032
Figure 14: Global Amorphous Metal Cores Market Volume (Tons) Analysis by Material Type, 2017-2032
Figure 15: Global Amorphous Metal Cores Market Value Share (%) and BPS Analysis by Material Type, 2022-2032
Figure 16: Global Amorphous Metal Cores Market Y-o-Y Growth (%) Projections by Material Type, 2022-2032
Figure 17: Global Amorphous Metal Cores Market Value (US$ Mn) Analysis by Application, 2017-2032
Figure 18: Global Amorphous Metal Cores Market Volume (Tons) Analysis by Application, 2017-2032
Figure 19: Global Amorphous Metal Cores Market Value Share (%) and BPS Analysis by Application, 2022-2032
Figure 20: Global Amorphous Metal Cores Market Y-o-Y Growth (%) Projections by Application, 2022-2032
Figure 21: Global Amorphous Metal Cores Market Attractiveness by Core Type, 2022-2032
Figure 22: Global Amorphous Metal Cores Market Attractiveness by Material Type, 2022-2032
Figure 23: Global Amorphous Metal Cores Market Attractiveness by Application, 2022-2032
Figure 24: Global Amorphous Metal Cores Market Attractiveness by Region, 2022-2032
Figure 25: North America Amorphous Metal Cores Market Value (US$ Mn) by Core Type, 2022-2032
Figure 26: North America Amorphous Metal Cores Market Value (US$ Mn) by Material Type, 2022-2032
Figure 27: North America Amorphous Metal Cores Market Value (US$ Mn) by Application, 2022-2032
Figure 28: North America Amorphous Metal Cores Market Value (US$ Mn) by Country, 2022-2032
Figure 29: North America Amorphous Metal Cores Market Value (US$ Mn) Analysis by Country, 2017-2032
Figure 30: North America Amorphous Metal Cores Market Volume (Tons) Analysis by Country, 2017-2032
Figure 31: North America Amorphous Metal Cores Market Value Share (%) and BPS Analysis by Country, 2022-2032
Figure 32: North America Amorphous Metal Cores Market Y-o-Y Growth (%) Projections by Country, 2022-2032
Figure 33: North America Amorphous Metal Cores Market Value (US$ Mn) Analysis by Core Type, 2017-2032
Figure 34: North America Amorphous Metal Cores Market Volume (Tons) Analysis by Core Type, 2017-2032
Figure 35: North America Amorphous Metal Cores Market Value Share (%) and BPS Analysis by Core Type, 2022-2032
Figure 36: North America Amorphous Metal Cores Market Y-o-Y Growth (%) Projections by Core Type, 2022-2032
Figure 37: North America Amorphous Metal Cores Market Value (US$ Mn) Analysis by Material Type, 2017-2032
Figure 38: North America Amorphous Metal Cores Market Volume (Tons) Analysis by Material Type, 2017-2032
Figure 39: North America Amorphous Metal Cores Market Value Share (%) and BPS Analysis by Material Type, 2022-2032
Figure 40: North America Amorphous Metal Cores Market Y-o-Y Growth (%) Projections by Material Type, 2022-2032
Figure 41: North America Amorphous Metal Cores Market Value (US$ Mn) Analysis by Application, 2017-2032
Figure 42: North America Amorphous Metal Cores Market Volume (Tons) Analysis by Application, 2017-2032
Figure 43: North America Amorphous Metal Cores Market Value Share (%) and BPS Analysis by Application, 2022-2032
Figure 44: North America Amorphous Metal Cores Market Y-o-Y Growth (%) Projections by Application, 2022-2032
Figure 45: North America Amorphous Metal Cores Market Attractiveness by Core Type, 2022-2032
Figure 46: North America Amorphous Metal Cores Market Attractiveness by Material Type, 2022-2032
Figure 47: North America Amorphous Metal Cores Market Attractiveness by Application, 2022-2032
Figure 48: North America Amorphous Metal Cores Market Attractiveness by Country, 2022-2032
Figure 49: Latin America Amorphous Metal Cores Market Value (US$ Mn) by Core Type, 2022-2032
Figure 50: Latin America Amorphous Metal Cores Market Value (US$ Mn) by Material Type, 2022-2032
Figure 51: Latin America Amorphous Metal Cores Market Value (US$ Mn) by Application, 2022-2032
Figure 52: Latin America Amorphous Metal Cores Market Value (US$ Mn) by Country, 2022-2032
Figure 53: Latin America Amorphous Metal Cores Market Value (US$ Mn) Analysis by Country, 2017-2032
Figure 54: Latin America Amorphous Metal Cores Market Volume (Tons) Analysis by Country, 2017-2032
Figure 55: Latin America Amorphous Metal Cores Market Value Share (%) and BPS Analysis by Country, 2022-2032
Figure 56: Latin America Amorphous Metal Cores Market Y-o-Y Growth (%) Projections by Country, 2022-2032
Figure 57: Latin America Amorphous Metal Cores Market Value (US$ Mn) Analysis by Core Type, 2017-2032
Figure 58: Latin America Amorphous Metal Cores Market Volume (Tons) Analysis by Core Type, 2017-2032
Figure 59: Latin America Amorphous Metal Cores Market Value Share (%) and BPS Analysis by Core Type, 2022-2032
Figure 60: Latin America Amorphous Metal Cores Market Y-o-Y Growth (%) Projections by Core Type, 2022-2032
Figure 61: Latin America Amorphous Metal Cores Market Value (US$ Mn) Analysis by Material Type, 2017-2032
Figure 62: Latin America Amorphous Metal Cores Market Volume (Tons) Analysis by Material Type, 2017-2032
Figure 63: Latin America Amorphous Metal Cores Market Value Share (%) and BPS Analysis by Material Type, 2022-2032
Figure 64: Latin America Amorphous Metal Cores Market Y-o-Y Growth (%) Projections by Material Type, 2022-2032
Figure 65: Latin America Amorphous Metal Cores Market Value (US$ Mn) Analysis by Application, 2017-2032
Figure 66: Latin America Amorphous Metal Cores Market Volume (Tons) Analysis by Application, 2017-2032
Figure 67: Latin America Amorphous Metal Cores Market Value Share (%) and BPS Analysis by Application, 2022-2032
Figure 68: Latin America Amorphous Metal Cores Market Y-o-Y Growth (%) Projections by Application, 2022-2032
Figure 69: Latin America Amorphous Metal Cores Market Attractiveness by Core Type, 2022-2032
Figure 70: Latin America Amorphous Metal Cores Market Attractiveness by Material Type, 2022-2032
Figure 71: Latin America Amorphous Metal Cores Market Attractiveness by Application, 2022-2032
Figure 72: Latin America Amorphous Metal Cores Market Attractiveness by Country, 2022-2032
Figure 73: Europe Amorphous Metal Cores Market Value (US$ Mn) by Core Type, 2022-2032
Figure 74: Europe Amorphous Metal Cores Market Value (US$ Mn) by Material Type, 2022-2032
Figure 75: Europe Amorphous Metal Cores Market Value (US$ Mn) by Application, 2022-2032
Figure 76: Europe Amorphous Metal Cores Market Value (US$ Mn) by Country, 2022-2032
Figure 77: Europe Amorphous Metal Cores Market Value (US$ Mn) Analysis by Country, 2017-2032
Figure 78: Europe Amorphous Metal Cores Market Volume (Tons) Analysis by Country, 2017-2032
Figure 79: Europe Amorphous Metal Cores Market Value Share (%) and BPS Analysis by Country, 2022-2032
Figure 80: Europe Amorphous Metal Cores Market Y-o-Y Growth (%) Projections by Country, 2022-2032
Figure 81: Europe Amorphous Metal Cores Market Value (US$ Mn) Analysis by Core Type, 2017-2032
Figure 82: Europe Amorphous Metal Cores Market Volume (Tons) Analysis by Core Type, 2017-2032
Figure 83: Europe Amorphous Metal Cores Market Value Share (%) and BPS Analysis by Core Type, 2022-2032
Figure 84: Europe Amorphous Metal Cores Market Y-o-Y Growth (%) Projections by Core Type, 2022-2032
Figure 85: Europe Amorphous Metal Cores Market Value (US$ Mn) Analysis by Material Type, 2017-2032
Figure 86: Europe Amorphous Metal Cores Market Volume (Tons) Analysis by Material Type, 2017-2032
Figure 87: Europe Amorphous Metal Cores Market Value Share (%) and BPS Analysis by Material Type, 2022-2032
Figure 88: Europe Amorphous Metal Cores Market Y-o-Y Growth (%) Projections by Material Type, 2022-2032
Figure 89: Europe Amorphous Metal Cores Market Value (US$ Mn) Analysis by Application, 2017-2032
Figure 90: Europe Amorphous Metal Cores Market Volume (Tons) Analysis by Application, 2017-2032
Figure 91: Europe Amorphous Metal Cores Market Value Share (%) and BPS Analysis by Application, 2022-2032
Figure 92: Europe Amorphous Metal Cores Market Y-o-Y Growth (%) Projections by Application, 2022-2032
Figure 93: Europe Amorphous Metal Cores Market Attractiveness by Core Type, 2022-2032
Figure 94: Europe Amorphous Metal Cores Market Attractiveness by Material Type, 2022-2032
Figure 95: Europe Amorphous Metal Cores Market Attractiveness by Application, 2022-2032
Figure 96: Europe Amorphous Metal Cores Market Attractiveness by Country, 2022-2032
Figure 97: East Asia Amorphous Metal Cores Market Value (US$ Mn) by Core Type, 2022-2032
Figure 98: East Asia Amorphous Metal Cores Market Value (US$ Mn) by Material Type, 2022-2032
Figure 99: East Asia Amorphous Metal Cores Market Value (US$ Mn) by Application, 2022-2032
Figure 100: East Asia Amorphous Metal Cores Market Value (US$ Mn) by Country, 2022-2032
Figure 101: East Asia Amorphous Metal Cores Market Value (US$ Mn) Analysis by Country, 2017-2032
Figure 102: East Asia Amorphous Metal Cores Market Volume (Tons) Analysis by Country, 2017-2032
Figure 103: East Asia Amorphous Metal Cores Market Value Share (%) and BPS Analysis by Country, 2022-2032
Figure 104: East Asia Amorphous Metal Cores Market Y-o-Y Growth (%) Projections by Country, 2022-2032
Figure 105: East Asia Amorphous Metal Cores Market Value (US$ Mn) Analysis by Core Type, 2017-2032
Figure 106: East Asia Amorphous Metal Cores Market Volume (Tons) Analysis by Core Type, 2017-2032
Figure 107: East Asia Amorphous Metal Cores Market Value Share (%) and BPS Analysis by Core Type, 2022-2032
Figure 108: East Asia Amorphous Metal Cores Market Y-o-Y Growth (%) Projections by Core Type, 2022-2032
Figure 109: East Asia Amorphous Metal Cores Market Value (US$ Mn) Analysis by Material Type, 2017-2032
Figure 110: East Asia Amorphous Metal Cores Market Volume (Tons) Analysis by Material Type, 2017-2032
Figure 111: East Asia Amorphous Metal Cores Market Value Share (%) and BPS Analysis by Material Type, 2022-2032
Figure 112: East Asia Amorphous Metal Cores Market Y-o-Y Growth (%) Projections by Material Type, 2022-2032
Figure 113: East Asia Amorphous Metal Cores Market Value (US$ Mn) Analysis by Application, 2017-2032
Figure 114: East Asia Amorphous Metal Cores Market Volume (Tons) Analysis by Application, 2017-2032
Figure 115: East Asia Amorphous Metal Cores Market Value Share (%) and BPS Analysis by Application, 2022-2032
Figure 116: East Asia Amorphous Metal Cores Market Y-o-Y Growth (%) Projections by Application, 2022-2032
Figure 117: East Asia Amorphous Metal Cores Market Attractiveness by Core Type, 2022-2032
Figure 118: East Asia Amorphous Metal Cores Market Attractiveness by Material Type, 2022-2032
Figure 119: East Asia Amorphous Metal Cores Market Attractiveness by Application, 2022-2032
Figure 120: East Asia Amorphous Metal Cores Market Attractiveness by Country, 2022-2032
Figure 121: South Asia & Pacific Amorphous Metal Cores Market Value (US$ Mn) by Core Type, 2022-2032
Figure 122: South Asia & Pacific Amorphous Metal Cores Market Value (US$ Mn) by Material Type, 2022-2032
Figure 123: South Asia & Pacific Amorphous Metal Cores Market Value (US$ Mn) by Application, 2022-2032
Figure 124: South Asia & Pacific Amorphous Metal Cores Market Value (US$ Mn) by Country, 2022-2032
Figure 125: South Asia & Pacific Amorphous Metal Cores Market Value (US$ Mn) Analysis by Country, 2017-2032
Figure 126: South Asia & Pacific Amorphous Metal Cores Market Volume (Tons) Analysis by Country, 2017-2032
Figure 127: South Asia & Pacific Amorphous Metal Cores Market Value Share (%) and BPS Analysis by Country, 2022-2032
Figure 128: South Asia & Pacific Amorphous Metal Cores Market Y-o-Y Growth (%) Projections by Country, 2022-2032
Figure 129: South Asia & Pacific Amorphous Metal Cores Market Value (US$ Mn) Analysis by Core Type, 2017-2032
Figure 130: South Asia & Pacific Amorphous Metal Cores Market Volume (Tons) Analysis by Core Type, 2017-2032
Figure 131: South Asia & Pacific Amorphous Metal Cores Market Value Share (%) and BPS Analysis by Core Type, 2022-2032
Figure 132: South Asia & Pacific Amorphous Metal Cores Market Y-o-Y Growth (%) Projections by Core Type, 2022-2032
Figure 133: South Asia & Pacific Amorphous Metal Cores Market Value (US$ Mn) Analysis by Material Type, 2017-2032
Figure 134: South Asia & Pacific Amorphous Metal Cores Market Volume (Tons) Analysis by Material Type, 2017-2032
Figure 135: South Asia & Pacific Amorphous Metal Cores Market Value Share (%) and BPS Analysis by Material Type, 2022-2032
Figure 136: South Asia & Pacific Amorphous Metal Cores Market Y-o-Y Growth (%) Projections by Material Type, 2022-2032
Figure 137: South Asia & Pacific Amorphous Metal Cores Market Value (US$ Mn) Analysis by Application, 2017-2032
Figure 138: South Asia & Pacific Amorphous Metal Cores Market Volume (Tons) Analysis by Application, 2017-2032
Figure 139: South Asia & Pacific Amorphous Metal Cores Market Value Share (%) and BPS Analysis by Application, 2022-2032
Figure 140: South Asia & Pacific Amorphous Metal Cores Market Y-o-Y Growth (%) Projections by Application, 2022-2032
Figure 141: South Asia & Pacific Amorphous Metal Cores Market Attractiveness by Core Type, 2022-2032
Figure 142: South Asia & Pacific Amorphous Metal Cores Market Attractiveness by Material Type, 2022-2032
Figure 143: South Asia & Pacific Amorphous Metal Cores Market Attractiveness by Application, 2022-2032
Figure 144: South Asia & Pacific Amorphous Metal Cores Market Attractiveness by Country, 2022-2032
Figure 145: MEA Amorphous Metal Cores Market Value (US$ Mn) by Core Type, 2022-2032
Figure 146: MEA Amorphous Metal Cores Market Value (US$ Mn) by Material Type, 2022-2032
Figure 147: MEA Amorphous Metal Cores Market Value (US$ Mn) by Application, 2022-2032
Figure 148: MEA Amorphous Metal Cores Market Value (US$ Mn) by Country, 2022-2032
Figure 149: MEA Amorphous Metal Cores Market Value (US$ Mn) Analysis by Country, 2017-2032
Figure 150: MEA Amorphous Metal Cores Market Volume (Tons) Analysis by Country, 2017-2032
Figure 151: MEA Amorphous Metal Cores Market Value Share (%) and BPS Analysis by Country, 2022-2032
Figure 152: MEA Amorphous Metal Cores Market Y-o-Y Growth (%) Projections by Country, 2022-2032
Figure 153: MEA Amorphous Metal Cores Market Value (US$ Mn) Analysis by Core Type, 2017-2032
Figure 154: MEA Amorphous Metal Cores Market Volume (Tons) Analysis by Core Type, 2017-2032
Figure 155: MEA Amorphous Metal Cores Market Value Share (%) and BPS Analysis by Core Type, 2022-2032
Figure 156: MEA Amorphous Metal Cores Market Y-o-Y Growth (%) Projections by Core Type, 2022-2032
Figure 157: MEA Amorphous Metal Cores Market Value (US$ Mn) Analysis by Material Type, 2017-2032
Figure 158: MEA Amorphous Metal Cores Market Volume (Tons) Analysis by Material Type, 2017-2032
Figure 159: MEA Amorphous Metal Cores Market Value Share (%) and BPS Analysis by Material Type, 2022-2032
Figure 160: MEA Amorphous Metal Cores Market Y-o-Y Growth (%) Projections by Material Type, 2022-2032
Figure 161: MEA Amorphous Metal Cores Market Value (US$ Mn) Analysis by Application, 2017-2032
Figure 162: MEA Amorphous Metal Cores Market Volume (Tons) Analysis by Application, 2017-2032
Figure 163: MEA Amorphous Metal Cores Market Value Share (%) and BPS Analysis by Application, 2022-2032
Figure 164: MEA Amorphous Metal Cores Market Y-o-Y Growth (%) Projections by Application, 2022-2032
Figure 165: MEA Amorphous Metal Cores Market Attractiveness by Core Type, 2022-2032
Figure 166: MEA Amorphous Metal Cores Market Attractiveness by Material Type, 2022-2032
Figure 167: MEA Amorphous Metal Cores Market Attractiveness by Application, 2022-2032
Figure 168: MEA Amorphous Metal Cores Market Attractiveness by Country, 2022-2032
The amorphous metal cores market is expected to record a CAGR of 7.5% during the forecast period 2022 to 2032, up from USD 781.6 Million in the year 2022 to reach a valuation of USD 1610.90 Million by 2032
Key players holding substantial market share are Hitachi, Ltd., Advanced Technology & Materials Co., Ltd., Zhaojing Incorporated, Qingdao Yunlu New Energy Technology Co., Ltd., China Amorphous Technology Co.,Ltd, ENPAY, Mangal Electrical Industries Pvt. Ltd., KOTSONS Pvt. Ltd., Usha Amorphous Metals Ltd., and Ti-Electronic.
As per the analysis, the amorphous metal cores market share is likely to be USD 1610.90 Million by 2032.
Amorphous Metal Cores are being increasingly used in transformers and inverters, which is leading to the market's growth.
Explore Similar Insights
Thank you!
You will receive an email from our Business Development Manager. Please be sure to check your SPAM/JUNK folder too.