Anti-Aging Agents Market Size and Share Forecast Outlook 2025 to 2035

The Anti-Aging Agents Market was valued at USD 5,903.8 million in 2025 and is projected to reach USD 12,802.4 million by 2035. This expansion reflects an increase of USD 6,898.6 million, more than doubling the market size within the period. The overall growth represents a compound annual growth rate of 8.0%, supported by strong adoption of advanced raw materials, novel encapsulation technologies, and biotechnology-derived actives across formulation pipelines.
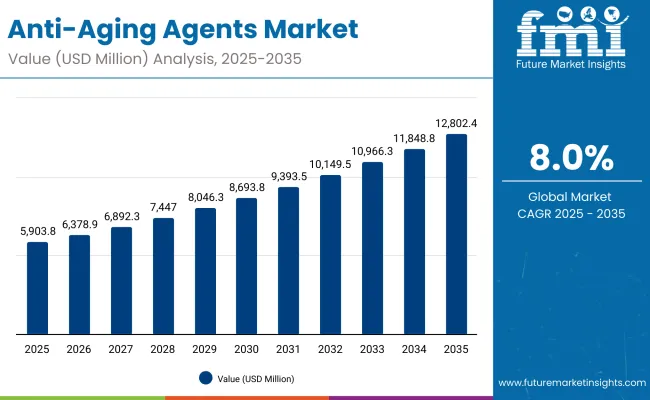
Anti Aging Agents Market Value Analysis

Quick Stats for Anti-Aging Agents Market

  • Anti-Aging Agents Market Value (2025): USD 5,903.8 million
  • Anti-Aging Agents Market Forecast Value (2035): USD 12,802.4 million
  • Anti-Aging Agents Market Forecast CAGR: 8.0%
  • Leading Segment in Anti-Aging Agents Market in 2025: Collagen & ECM stimulators (31.0%)
  • Key Growth Regions in the Anti-Aging Agents Market: North America, East Asia, Europe
  • Top Key Players in Anti-Aging Agents Market: DSM-Firmenich, Givaudan, Croda, BASF, Symrise, Ashland, Clariant, Evonik, Seppic, Lubrizol

Anti-Aging Agents Market Key Takeaways

Metric Value
Anti-Aging Agents Market Estimated Value in (2025E) USD 5,903.8 million
Anti-Aging Agents Market Forecast Value in (2035F) USD 12,802.4 million
Forecast CAGR (2025 to 2035) 8.00%

Between 2025 and 2030, the market is expected to rise from USD 5,903.8 million to USD 8,693.8 million, adding USD 2,790.0 million, which accounts for nearly 40% of the total decade gain. This phase is anticipated to be driven by steady uptake of collagen and ECM stimulators, which are forecast to capture 31.0% share in 2025. Encapsulated delivery systems are also expected to dominate with 48.0% share in 2025, as controlled-release technologies enhance performance reliability and consumer-facing claims.

From 2030 to 2035, the market is predicted to accelerate from USD 8,693.8 million to USD 12,802.4 million, adding USD 4,108.6 million, equivalent to more than 60% of decade growth. During this period, biotechnology-derived ingredients are expected to consolidate their position, with a 36.0% share in 2025 and further scaling anticipated as sustainable sourcing and cost-efficient bioprocessing gain traction.

Regional momentum in India, China, and Japan is projected to reinforce supply chain resilience and expand application portfolios, ensuring long-term structural growth of the market.

From 2020 to 2024, the anti-aging agents sector expanded steadily as demand for clinically validated active ingredients intensified across skincare formulations. During this period, biotechnology-derived sources began to gain traction, though conventional synthetic and botanical routes retained the majority share. The competitive space was shaped by ingredient suppliers that focused on dossier strength, traceability, and safety substantiation.

By 2025, market value is projected at USD 5,903.8 million, and further growth to USD 12,802.4 million by 2035 is anticipated. The revenue mix is expected to evolve as encapsulation and advanced delivery technologies capture wider adoption, while biotechnology-derived ingredients are forecast to gain share due to sustainability and scalability. Leading suppliers are likely to reposition portfolios with stronger emphasis on co-development platforms, regulatory-ready actives, and sustainable production models.

Competitive advantage is expected to shift from traditional raw material supply toward integrated ingredient ecosystems, supported by clinical validation, digital traceability, and consistent supply reliability. Emerging players emphasizing biotechnology and encapsulation are projected to gain market relevance, while established multinationals are expected to defend positions through broader pipelines and innovation partnerships.

Why the Anti-Aging Agents Market is growing?

Growth in the Anti-Aging Agents Market is being supported by heightened demand for clinically validated raw materials that deliver measurable skin benefits. Expansion is being fueled by strong interest in collagen and ECM stimulators, as these ingredients provide structural reinforcement that aligns with long-term skin health claims.

Encapsulation technologies are being adopted widely, as controlled-release mechanisms ensure stability and enhance formulation efficiency. Biotechnology-derived actives are being prioritized, with sustainable production processes and reproducibility standards accelerating acceptance across global supply chains. Rising consumer awareness of preventative skincare is translating into greater demand from formulators, who are under pressure to deliver high-efficacy products with credible safety dossiers.

Regional expansion in Asia, particularly in India, China, and Japan, is driving procurement activity, while established markets in North America and Europe are reinforcing adoption through regulatory readiness and premium brand positioning. Future momentum is expected to be anchored by innovation in delivery systems and biotechnology platforms.

Segmental Analysis

The Anti-Aging Agents Market has been segmented on the basis of mode of action, source, and delivery system. Each category reflects distinct demand drivers, regulatory considerations, and formulation opportunities that are expected to influence procurement strategies over the next decade. Collagen and ECM stimulators are projected to play a vital role in structural skin health, while biotechnology-derived ingredients are anticipated to reshape sourcing practices through sustainable production methods.

Encapsulation technologies are forecast to dominate delivery systems, owing to their ability to enhance stability and extend release profiles. Together, these segments provide a comprehensive view of how ingredient innovation and formulation science are expected to guide the long-term trajectory of the market.
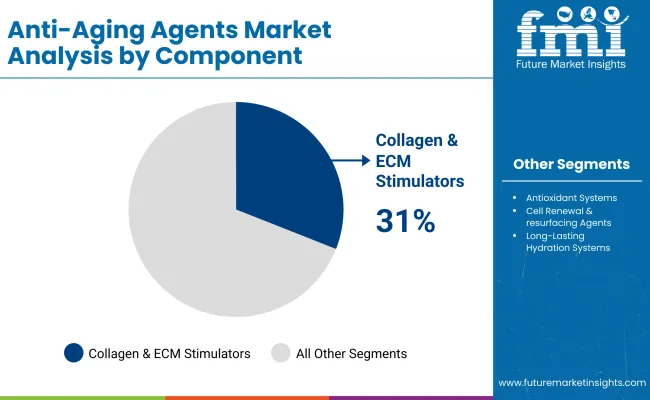
Insights into the Mode of Action Segment with Collagen & ECM Stimulators Leading in Market Share

Anti Aging Agents Market By Component

Mode of Action Market Value Share, 2025
Collagen & ECM stimulators 31%
Others 69.0%

Collagen & ECM stimulators are expected to hold 31.0% share in 2025 (USD 588.9 million), while others will account for 69.0% share (USD 4,073.6 million).The mode of action segment is projected to be driven strongly by collagen and ECM stimulators, as their ability to restore structural support and improve skin resilience is being increasingly emphasized by formulators seeking high-efficacy actives. Strong preference is anticipated for these stimulators due to their established clinical validation and wide compatibility with advanced delivery systems.

Other mechanisms are likely to remain vital in supporting diverse formulation pipelines, ensuring that innovation is spread across antioxidant systems and other specialized actives. Demand is forecast to be reinforced by the need for multifunctional ingredients offering consistent, long-term performance.
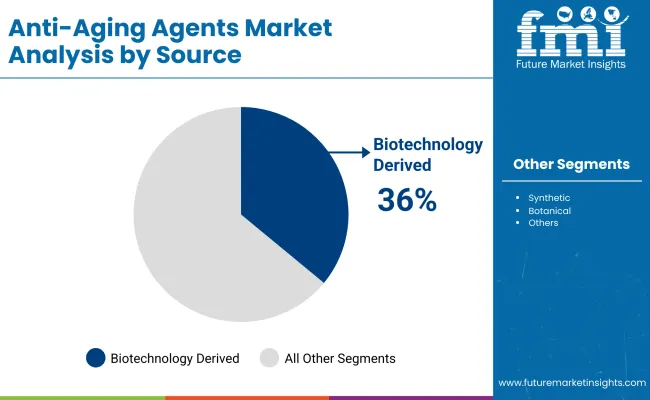
Insights into the Source Segment with Biotechnology-derived Ingredients Gaining Prominence

Anti Aging Agents Market By Source

Source Market Value Share, 2025
Biotechnology-derived 36%
Others 64.0%

Biotechnology-derived actives are projected to capture 36.0% share in 2025 (USD 566.7 million), while others are estimated at 64.0% share (USD 3,778.4 million).The source segment is expected to be reshaped by biotechnology-derived actives, with their sustainable production and reproducibility being prioritized by procurement teams as regulatory and environmental considerations intensify.

Demand is projected to rise further as fermentation and bioprocessing routes provide higher quality control and stronger scalability. Other sources are expected to continue supporting market breadth, particularly in regions where conventional sourcing remains cost-competitive.

However, the momentum of biotechnology-derived inputs is anticipated to accelerate as leading suppliers enhance portfolios with robust clinical dossiers, regulatory readiness, and transparent supply chains to meet rising formulator expectations.
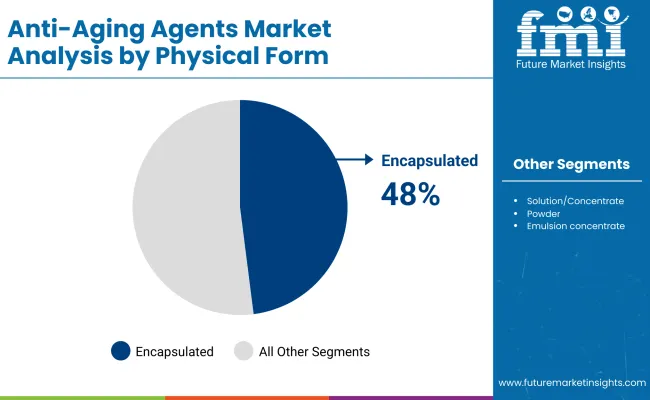
Insights into the Delivery System Segment with Encapsulated Formats Dominating the Demand

Anti Aging Agents Market By Physical Form

Delivery System Market Value Share, 2025
Encapsulated 48%
Others 52.0%

Encapsulated delivery systems are forecast to secure 48.0% share in 2025 (USD 533.3 million), while others will represent 52.0% share (USD 3,069.9 million).Encapsulated systems are projected to dominate due to their ability to protect sensitive actives, improve stability, and deliver controlled release for enhanced efficacy. Procurement interest is expected to favor suppliers offering high payload efficiency, solvent compatibility, and reproducibility across large-scale production.

Other delivery formats will continue to provide alternatives where cost optimization and faster deployment are prioritized. Nevertheless, encapsulated formats are forecast to remain central in driving premium formulations, as their contribution to claim substantiation and consumer trust continues to expand. Long-term growth is anticipated to be anchored in encapsulation innovations that enhance delivery precision and sensory performance.

What are the Drivers, Restraints, and Key Trends of the Anti-Aging Agents Market?

Complexity in regulatory compliance and escalating R&D investments are shaping the Anti-Aging Agents Market, even as opportunities are being unlocked through biotechnology-driven ingredients, advanced encapsulation, and sustainability-oriented sourcing strategies that are redefining value creation across B2B formulation ecosystems.

Biotechnology-Enabled Scalability in Ingredient Supply

Scalability through biotechnology platforms is being positioned as a transformative driver of the Anti-Aging Agents Market. Fermentation and bio-engineering processes are expected to replace volatile traditional sourcing channels by ensuring reproducibility, purity, and sustainable yield optimization.

By reducing dependency on agricultural inputs, biotechnology-derived actives are anticipated to stabilize supply chains, mitigate climatic risks, and enhance quality assurance. Procurement teams are increasingly guided by supplier capacity to provide validated documentation, global regulatory readiness, and eco-footprint transparency.

This convergence of sustainability with industrial efficiency is expected to create long-term procurement value, while simultaneously fostering competitive differentiation for suppliers with robust IP portfolios and strategic production alliances.

Regulatory Fragmentation Across Global Markets

Regulatory fragmentation is being observed as a significant restraint, limiting the pace of new ingredient adoption. Divergent standards across North America, Europe, and Asia are requiring suppliers to invest heavily in region-specific dossiers, safety trials, and compliance frameworks. Delays in approval cycles are likely to increase costs and extend commercialization timelines, creating friction for smaller players lacking regulatory infrastructure.

At the same time, heightened scrutiny on microplastics, preservatives, and environmental safety is intensifying documentation requirements, challenging scalability of innovative delivery systems. Without harmonized global frameworks, the operational burden on suppliers is expected to persist, discouraging rapid innovation transfer and slowing adoption of advanced actives.
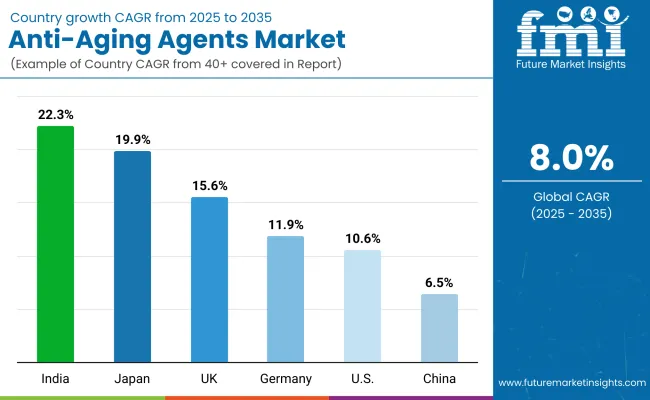
Analysis of Anti-Aging Agents Market By Key Countries

Anti Aging Agents Market Country Wise Analysis

Country CAGR
China 6.5%
USA 10.6%
India 22.3%
UK 15.6%
Germany 11.9%
Japan 19.9%

The Anti-Aging Agents Market is expected to display notable variation in growth across countries, reflecting differences in consumer behavior, regulatory maturity, and formulation innovation. India is projected to lead with a CAGR of 22.3% during 2025 to 2035, supported by rising penetration of dermocosmetic products and rapid adoption of biotechnology-derived actives in masstige and premium formulations.

Japan, forecast at 19.9% CAGR, is anticipated to maintain its position as a hub of precision-driven skincare, where consumer expectations for safety, efficacy, and multifunctionality are setting new benchmarks for product development.

The United Kingdom, expected to grow at 15.6% CAGR, is likely to benefit from strong adoption of encapsulated delivery technologies and regulatory frameworks supporting advanced ingredients. The USA, forecast at 10.6% CAGR, is anticipated to sustain growth through high demand for clinically validated actives, particularly in collagen and ECM stimulation categories.

Germany, projected at 11.9% CAGR, is expected to strengthen Europe’s footprint through its leadership in research-backed formulations and sustainability-led procurement. Europe overall, with a CAGR of 9.3%, is likely to remain a steady contributor, while China, forecast at 6.5% CAGR, is anticipated to rely on biotechnology-driven growth despite relatively slower expansion. Collectively, these dynamics underscore region-specific trajectories shaping the long-term global market outlook.
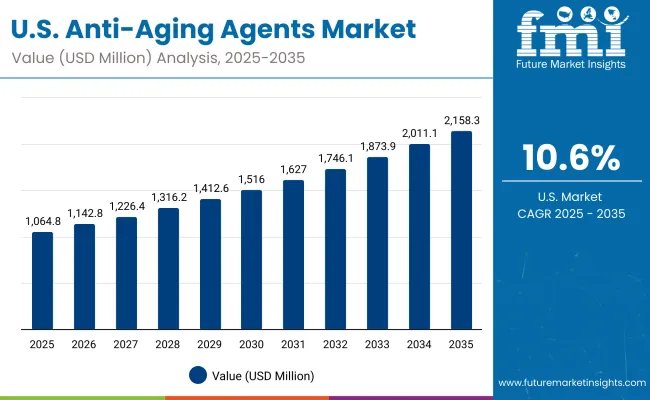
Sales Outlook for Anti-Aging Agents in the United States

Usa Anti Aging Agents Market

Year USA Anti-Aging Agents Market (USD Million)
2025 1,064.85
2026 1,142.80
2027 1,226.46
2028 1,316.25
2029 1,412.61
2030 1,516.02
2031 1,627.00
2032 1,746.10
2033 1,873.93
2034 2,011.11
2035 2,158.34

The Anti-Acne Agents Market in the United States is forecast to expand at a CAGR of 7.0% between 2025 and 2035. Growth is expected to be propelled by the rising integration of acne-focused actives into mainstream dermocosmetics, greater reliance on encapsulated delivery systems, and the convergence of professional and consumer skincare categories. Steady regulatory oversight is anticipated to elevate product validation standards, encouraging suppliers to provide clinically supported dossiers. Competitive positioning is likely to favor players with innovation pipelines that balance efficacy, safety, and sustainability.

  • Encapsulation systems are being prioritized for controlled release and enhanced bioavailability in acne formulations.
  • Multifunctional actives combining acne treatment with hydration and skin barrier repair are expected to drive wider adoption.
  • Competitive strength is projected to depend on evidence-backed ingredient portfolios and scalable supply solutions.

Growth and Expansion Outlook for Anti-Aging Agents Market in the United Kingdom

The UK Anti-Aging Agents Market is projected to expand at a CAGR of 15.6% through 2035, reflecting strong demand for premium formulations supported by regulatory frameworks that prioritize consumer safety and transparency. Growth is expected to be reinforced by adoption of encapsulated delivery systems and biotechnology-derived actives, both of which are aligning with brand innovation strategies.

A rising preference for multifunctional ingredients is anticipated to strengthen procurement for suppliers with robust clinical substantiation. With sustainability positioned as a competitive differentiator, ingredient sourcing transparency is likely to gain prominence.

  • Biotechnology-derived inputs are expected to gain significant traction across new launches.
  • Encapsulation formats are forecast to capture wider adoption for superior stability.
  • Multifunctional actives are anticipated to drive brand differentiation in skincare.
  • Sustainability credentials are projected to influence procurement strategies more heavily.

Growth and Expansion Outlook for Anti-Aging Agents Market in India

The India Anti-Aging Agents Market is forecast to grow at a CAGR of 22.3%, making it the fastest-growing market globally. This acceleration is expected to be driven by rapid expansion of dermocosmetics in urban and digital-first retail channels. Demand is anticipated to be guided by rising adoption of biotechnology-derived ingredients, as affordability and scalability continue to improve.

Encapsulation technologies are projected to penetrate masstige and premium categories, delivering higher efficacy and longer-lasting effects. Local manufacturing and cost-efficient sourcing are expected to strengthen market competitiveness, enabling broader access across diverse consumer bases.

  • Biotechnology-driven innovation is anticipated to scale rapidly in India.
  • Encapsulation formats are projected to enhance consumer trust in efficacy.
  • Digital-first and masstige retail are expected to expand accessibility.

Local sourcing and affordability are forecast to accelerate mass adoption.

Sales Outlook for Anti-Aging Agents in China

The China Anti-Aging Agents Market is projected to expand at a CAGR of 6.5%, indicating a more moderate pace compared to other Asia-Pacific peers. Growth is anticipated to be supported by strong uptake of biotechnology-derived ingredients, reflecting consumer preference for clinically validated, safety-backed actives.

Regulatory alignment with international standards is expected to enhance adoption of advanced delivery technologies. Procurement strategies are likely to emphasize innovation in encapsulation, enabling higher stability and extended release for local and multinational brands operating in the region. Despite slower overall growth, innovation-led product pipelines are forecast to ensure sustainable momentum.
  • Biotechnology-derived actives are forecast to secure greater market presence.
  • Encapsulation systems are expected to gain traction in premium categories.
  • Regulatory frameworks are anticipated to favor globally validated ingredients.
  • Innovation-driven procurement is projected to sustain long-term competitiveness.

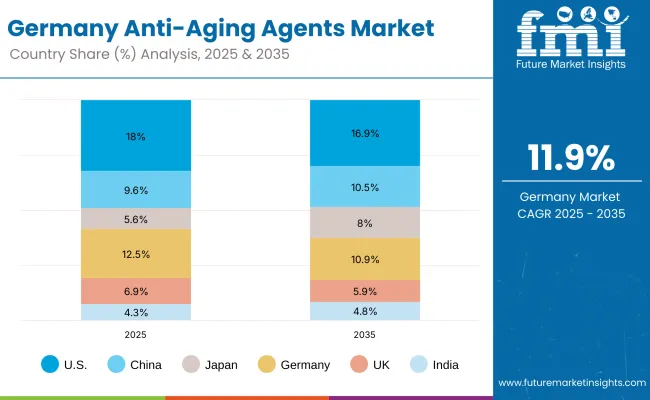
In-depth Analysis of Anti-Aging Agents in Germany

Germany Anti Aging Agents Market

Country 2025
USA 18.0%
China 9.6%
Japan 5.6%
Germany 12.5%
UK 6.9%
India 4.3%
Country 2035
USA 16.9%
China 10.5%
Japan 8.0%
Germany 10.9%
UK 5.9%
India 4.8%

The Germany Anti-Aging Agents Market is expected to register a CAGR of 11.9% through 2035, underpinned by strong emphasis on research-backed formulations and adherence to strict regulatory compliance. Growth is forecast to be reinforced by demand for biotechnology-derived ingredients, which are aligned with sustainability and traceability priorities across the European Union.

Encapsulation technologies are projected to drive innovation pipelines, delivering enhanced stability and consumer assurance. With consumer demand shifting toward multifunctional formulations, suppliers offering clinically substantiated, eco-friendly actives are likely to gain competitive advantage. Germany’s leadership in dermocosmetics is expected to position it as a core hub for European expansion.
  • Biotechnology-derived inputs are anticipated to dominate procurement preferences.
  • Encapsulation formats are forecast to underpin innovative formulation design.
  • Sustainability and traceability are expected to guide supplier competitiveness.
  • Research-backed multifunctional actives are projected to strengthen brand portfolios.

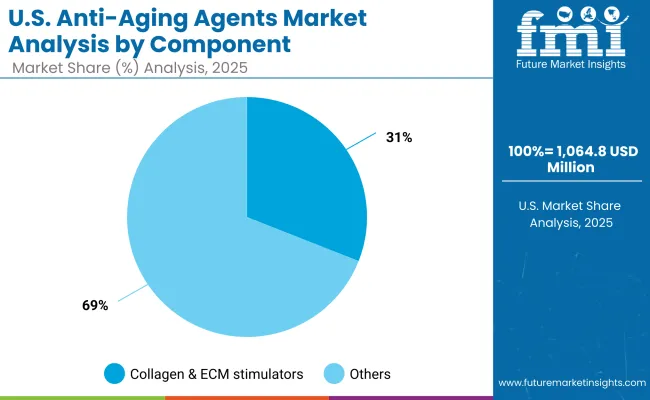
Growth Outlook for Anti-Aging Agents Market in USA

Usa Anti Aging Agents Market By Component

USA by Mode of Action Market Value Share, 2025
Collagen & ECM stimulators 31%
Others 69.0%

The Anti-Aging Agents Market in the USA is projected at USD 1,064.85 million in 2025. Collagen and ECM stimulators contribute 31% of market share, while other mechanisms account for 69%, showing a balanced but diversified portfolio of active ingredient strategies. The strong positioning of collagen and ECM stimulators is being shaped by their ability to reinforce structural skin health and by the preference of formulators for well-substantiated, high-efficacy actives.

Other categories, encompassing antioxidant systems and elasticity enhancers, are anticipated to remain critical, ensuring breadth of functionality across consumer-facing formulations. This dual structure highlights that procurement is being guided by both core performance ingredients and broader multifunctional platforms that respond to evolving consumer demands. Regulatory scrutiny in the USA is expected to reinforce reliance on clinically validated ingredients, while innovation pipelines are forecast to strengthen encapsulated formats for superior delivery.
  • Collagen & ECM stimulators represent 31% share in 2025 in the USA market.
  • Others dominate with 69%, reflecting diverse functional pathways.
  • Growth is supported by high demand for clinically validated structural actives.
  • Encapsulation integration is expected to reinforce performance differentiation.

Opportunity Analysis of China Anti-Aging Agents Market

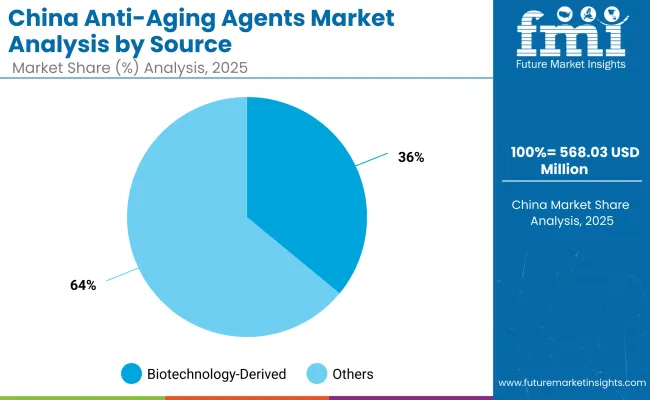
China Anti Aging Agents Market By Source

China by Source Market Value Share, 2025
Biotechnology-derived 36%
Others 64.0%

The Anti-Aging Agents Market in China is projected at USD 568.03 million in 2025. Biotechnology-derived sources are anticipated to represent 36% of the market, while other sources will account for 64%, underscoring the coexistence of advanced bio-based inputs with conventional ingredient platforms. The adoption of biotechnology-derived actives is being accelerated by demand for sustainability, safety, and reproducibility, with formulators increasingly guided by globally aligned regulatory requirements.

Conventional sources are expected to remain dominant due to cost advantages and established consumer familiarity, yet their share is forecast to gradually normalize as bioengineered alternatives scale. Strategic importance is likely to shift toward suppliers able to deliver consistent biotech-based production at industrial scale, supported by evidence-driven dossiers and transparent sourcing practices. The balance of traditional and biotech inputs illustrates the evolving procurement strategies shaping China’s market outlook.
  • Biotechnology-derived ingredients are projected at 36% share in 2025.
  • Conventional sources remain dominant with 64% share of total value.
  • Regulatory alignment is expected to favor biotechnology adoption.
  • Sustainability and scalability are anticipated to drive procurement priorities.

Competitive Landscape of Anti-Aging Agents Market

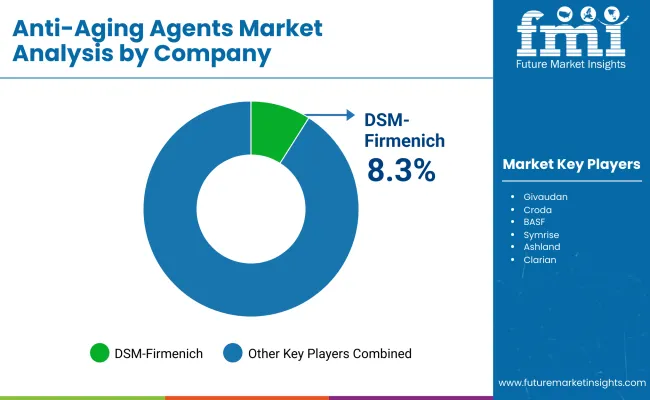
Anti Aging Agents Market By Company

Company Global Value Share 2025
DSM-Firmenich 8.3%
Others 91.7%

The Anti-Aging Agents Market is moderately consolidated, with global leaders and specialized suppliers competing to strengthen their positions across B2B ingredient portfolios. DSM-Firmenich is recognized as the most influential player, holding an estimated 8.3% of the global market value in 2025, while the remaining 91.7% is distributed among other suppliers. DSM-Firmenich’s leadership is supported by a diversified portfolio of clinically validated actives, biotechnology-driven production capabilities, and long-term partnerships with leading dermocosmetic brands.

Mid-sized companies such as Givaudan, Croda, BASF, Symrise, Ashland, and Clariant are positioned as important challengers, with strong capabilities in specialty actives, encapsulation technologies, and formulation support. Their strategies are expected to emphasize innovation pipelines focused on multifunctionality, sustainability, and regional customization. These suppliers are projected to gain traction by aligning portfolios with regulatory requirements and by scaling sustainable sourcing initiatives.

Niche-focused providers, including Evonik, Seppic, and Lubrizol, are anticipated to compete on customization, technical service, and ingredient differentiation. Their ability to deliver specialized carriers, emollients, and bioactive blends is expected to secure relevance in targeted applications.

Competitive differentiation is forecast to move beyond traditional ingredient supply toward ecosystem-based approaches, where evidence-backed claims, traceability, and co-development partnerships will define long-term advantage.

Key Developments in Anti-Aging Agents Market

  • On January 19, 2025, DSM-Firmenich introduced Syn-Coll CB at In-cosmetics Global. The peptide was created through green chemistry principles to regenerate collagen and protect skin structure. The innovation was presented as a milestone for sustainable anti-aging actives, expected to influence ingredient pipelines emphasizing biomimetic, efficacy-driven solutions across premium formulation segments.
  • On April 14, 2025, DSM-Firmenich launched its Healthy Longevity Platform at Vitafoods Europe. The initiative showcased integrated solutions targeting cellular aging, gut microbiome health, and advanced formulation services. This platform was positioned to accelerate adoption of clinically validated actives, while encouraging holistic approaches that combine skin vitality, nutrition, and preventative healthcare.

Scope of the Report

Item Value
Quantitative Units USD 5,903.8 million (2025) - USD 12,802.4 million (2035)
Component Collagen & ECM stimulators, Antioxidant systems, Cell renewal & resurfacing agents, Firming & elasticity enhancers, Long-lasting hydration systems
Source Biotechnology-derived, Synthetic, Botanical, Marine-derived, Others
Delivery System Encapsulated, Free-form, Sustained-release matrix, Anhydrous/powder-to-liquid, Others
Physical Form Encapsulated, Solution/concentrate, Powder, Emulsion concentrate
Application Serums, Creams & lotions, Eye/neck treatments, Masks & patches, Skincare, Sun care, Color cosmetics
End-use Industry Dermocosmetics, Personal care brands, Pharmaceutical skincare, Professional dermatology, Consumer health & wellness
Regions Covered North America, Europe, East Asia, South Asia & Pacific, Latin America, Middle East & Africa
Countries Covered United States, China, India, United Kingdom, Germany, Japan, France, Brazil, South Africa
Key Companies Profiled DSM-Firmenich, Givaudan, Croda, BASF, Symrise, Ashland, Clariant, Evonik, Seppic, Lubrizol
Additional Attributes Market expansion driven by biotechnology-derived ingredients, encapsulation technologies, and clinically validated actives; procurement emphasis on regulatory readiness, sustainability, and traceability; country-level growth led by India (22.3% CAGR) and Japan (19.9% CAGR); competitive advantage shifting to suppliers offering innovation pipelines, co-development support, and integrated sustainability metrics

Key Segments

By Mode of Action:

  • Collagen & ECM stimulators
  • Antioxidant systems
  • Cell renewal & resurfacing
  • Firming & elasticity enhancers
  • Long-lasting hydration systems

By Source:

  • Synthetic
  • Botanical
  • Biotechnology-derived
  • Marine-derived

By Delivery System:

  • Free form
  • Encapsulated
  • Sustained-release matrix
  • Anhydrous/powder-to-liquid

By Physical Form:

  • Solution/concentrate
  • Powder
  • Emulsion concentrate

By Application:

  • Serums
  • Creams & lotions
  • Eye/neck treatments
  • Masks & patches

By End Use:

  • Skincare
  • Sun care
  • Color cosmetics

By Region:

  • North America
  • Latin America
  • Europe
  • East Asia
  • South Asia & Pacific
  • Middle East and Africa

Table of Content

  1. Executive Summary
    • Global Market Outlook
    • Demand-side Trends
    • Supply-side Trends
    • Technology Roadmap Analysis
    • Analysis and Recommendations
  2. Market Overview
    • Market Coverage / Taxonomy
    • Market Definition / Scope / Limitations
  3. Market Background
    • Market Dynamics
      • Drivers
      • Restraints
      • Opportunity
      • Trends
    • Scenario Forecast
      • Demand in Optimistic Scenario
      • Demand in Likely Scenario
      • Demand in Conservative Scenario
    • Opportunity Map Analysis
    • Product Life Cycle Analysis
    • Supply Chain Analysis
      • Supply Side Participants and their Roles
        • Producers
        • Mid-Level Participants (Traders/ Agents/ Brokers)
        • Wholesalers and Distributors
      • Value Added and Value Created at Node in the Supply Chain
      • List of Raw Material Suppliers
      • List of Existing and Potential Buyer’s
    • Investment Feasibility Matrix
    • Value Chain Analysis
      • Profit Margin Analysis
      • Wholesalers and Distributors
      • Retailers
    • PESTLE and Porter’s Analysis
    • Regulatory Landscape
      • By Key Regions
      • By Key Countries
    • Regional Parent Market Outlook
    • Production and Consumption Statistics
    • Import and Export Statistics
  4. Global Market Analysis 2020 to 2024 and Forecast, 2025 to 2035
    • Historical Market Size Value (USD Million) & Volume (Units) Analysis, 2020 to 2024
    • Current and Future Market Size Value (USD Million) & Volume (Units) Projections, 2025 to 2035
      • Y-o-Y Growth Trend Analysis
      • Absolute $ Opportunity Analysis
  5. Global Market Analysis 2020 to 2024 and Forecast 2025 to 2035, By Mode of Action
    • Introduction / Key Findings
    • Historical Market Size Value (USD Million) & Volume (Units) Analysis By Mode of Action, 2020 to 2024
    • Current and Future Market Size Value (USD Million) & Volume (Units) Analysis and Forecast By Mode of Action, 2025 to 2035
      • Collagen & ECM stimulators
      • Antioxidant systems
      • Cell renewal & resurfacing
      • Firming & elasticity enhancers
      • Long-lasting hydration systems
    • Y-o-Y Growth Trend Analysis By Mode of Action, 2020 to 2024
    • Absolute $ Opportunity Analysis By Mode of Action, 2025 to 2035
  6. Global Market Analysis 2020 to 2024 and Forecast 2025 to 2035, By Source
    • Introduction / Key Findings
    • Historical Market Size Value (USD Million) & Volume (Units) Analysis By Source, 2020 to 2024
    • Current and Future Market Size Value (USD Million) & Volume (Units) Analysis and Forecast By Source, 2025 to 2035
      • Synthetic
      • Botanical
      • Biotechnology-derived
      • Marine-derived
    • Y-o-Y Growth Trend Analysis By Source, 2020 to 2024
    • Absolute $ Opportunity Analysis By Source, 2025 to 2035
  7. Global Market Analysis 2020 to 2024 and Forecast 2025 to 2035, By Delivery System
    • Introduction / Key Findings
    • Historical Market Size Value (USD Million) & Volume (Units) Analysis By Delivery System, 2020 to 2024
    • Current and Future Market Size Value (USD Million) & Volume (Units) Analysis and Forecast By Delivery System, 2025 to 2035
      • Free form
      • Encapsulated
      • Sustained-release matrix
      • Anhydrous/powder-to-liquid
    • Y-o-Y Growth Trend Analysis By Delivery System, 2020 to 2024
    • Absolute $ Opportunity Analysis By Delivery System, 2025 to 2035
  8. Global Market Analysis 2020 to 2024 and Forecast 2025 to 2035, By Physical Form
    • Introduction / Key Findings
    • Historical Market Size Value (USD Million) & Volume (Units) Analysis By Physical Form, 2020 to 2024
    • Current and Future Market Size Value (USD Million) & Volume (Units) Analysis and Forecast By Physical Form, 2025 to 2035
      • Solution/concentrate
      • Powder
      • Emulsion concentrate
    • Y-o-Y Growth Trend Analysis By Physical Form, 2020 to 2024
    • Absolute $ Opportunity Analysis By Physical Form, 2025 to 2035
  9. Global Market Analysis 2020 to 2024 and Forecast 2025 to 2035, By Application
    • Introduction / Key Findings
    • Historical Market Size Value (USD Million) & Volume (Units) Analysis By Application, 2020 to 2024
    • Current and Future Market Size Value (USD Million) & Volume (Units) Analysis and Forecast By Application, 2025 to 2035
      • Serums
      • Creams & lotions
      • Eye/neck treatments
      • Masks & patches
    • Y-o-Y Growth Trend Analysis By Application, 2020 to 2024
    • Absolute $ Opportunity Analysis By Application, 2025 to 2035
  10. Global Market Analysis 2020 to 2024 and Forecast 2025 to 2035, By End Use
    • Introduction / Key Findings
    • Historical Market Size Value (USD Million) & Volume (Units) Analysis By End Use, 2020 to 2024
    • Current and Future Market Size Value (USD Million) & Volume (Units) Analysis and Forecast By End Use, 2025 to 2035
      • Skincare
      • Sun care
      • Color cosmetics
    • Y-o-Y Growth Trend Analysis By End Use, 2020 to 2024
    • Absolute $ Opportunity Analysis By End Use, 2025 to 2035
  11. Global Market Analysis 2020 to 2024 and Forecast 2025 to 2035, By Region
    • Introduction
    • Historical Market Size Value (USD Million) & Volume (Units) Analysis By Region, 2020 to 2024
    • Current Market Size Value (USD Million) & Volume (Units) Analysis and Forecast By Region, 2025 to 2035
      • North America
      • Latin America
      • Europe
      • East Asia
      • South Asia & Pacific
      • Middle East and Africa
    • Market Attractiveness Analysis By Region
  12. North America Market Analysis 2020 to 2024 and Forecast 2025 to 2035, By Country
    • Historical Market Size Value (USD Million) & Volume (Units) Trend Analysis By Market Taxonomy, 2020 to 2024
    • Market Size Value (USD Million) & Volume (Units) Forecast By Market Taxonomy, 2025 to 2035
      • By Country
        • USA
        • Canada
      • By Mode of Action
      • By Source
      • By Delivery System
      • By Physical Form
      • By Application
      • By End Use
    • Market Attractiveness Analysis
      • By Country
      • By Mode of Action
      • By Source
      • By Delivery System
      • By Physical Form
      • By Application
      • By End Use
    • Key Takeaways
  13. Latin America Market Analysis 2020 to 2024 and Forecast 2025 to 2035, By Country
    • Historical Market Size Value (USD Million) & Volume (Units) Trend Analysis By Market Taxonomy, 2020 to 2024
    • Market Size Value (USD Million) & Volume (Units) Forecast By Market Taxonomy, 2025 to 2035
      • By Country
        • Brazil
        • Mexico
        • Colombia
        • Rest of Latin America
      • By Mode of Action
      • By Source
      • By Delivery System
      • By Physical Form
      • By Application
      • By End Use
    • Market Attractiveness Analysis
      • By Country
      • By Mode of Action
      • By Source
      • By Delivery System
      • By Physical Form
      • By Application
      • By End Use
    • Key Takeaways
  14. Europe Market Analysis 2020 to 2024 and Forecast 2025 to 2035, By Country
    • Historical Market Size Value (USD Million) & Volume (Units) Trend Analysis By Market Taxonomy, 2020 to 2024
    • Market Size Value (USD Million) & Volume (Units) Forecast By Market Taxonomy, 2025 to 2035
      • By Country
        • Germany
        • UK
        • France
        • Italy
        • Spain
        • Belgium
        • Netherlands
        • Nordic
        • Switzerland
        • Russia
        • Poland
        • Rest of Europe
      • By Mode of Action
      • By Source
      • By Delivery System
      • By Physical Form
      • By Application
      • By End Use
    • Market Attractiveness Analysis
      • By Country
      • By Mode of Action
      • By Source
      • By Delivery System
      • By Physical Form
      • By Application
      • By End Use
    • Key Takeaways
  15. East Asia Market Analysis 2020 to 2024 and Forecast 2025 to 2035, By Country
    • Historical Market Size Value (USD Million) & Volume (Units) Trend Analysis By Market Taxonomy, 2020 to 2024
    • Market Size Value (USD Million) & Volume (Units) Forecast By Market Taxonomy, 2025 to 2035
      • By Country
        • China
        • Japan
        • South Korea
      • By Mode of Action
      • By Source
      • By Delivery System
      • By Physical Form
      • By Application
      • By End Use
    • Market Attractiveness Analysis
      • By Country
      • By Mode of Action
      • By Source
      • By Delivery System
      • By Physical Form
      • By Application
      • By End Use
    • Key Takeaways
  16. South Asia & Pacific Market Analysis 2020 to 2024 and Forecast 2025 to 2035, By Country
    • Historical Market Size Value (USD Million) & Volume (Units) Trend Analysis By Market Taxonomy, 2020 to 2024
    • Market Size Value (USD Million) & Volume (Units) Forecast By Market Taxonomy, 2025 to 2035
      • By Country
        • India
        • Thailand
        • Malaysia
        • Indonesia
        • Singapore
        • Vietnam
        • Australia
        • New Zealand
        • Rest of South Asia
      • By Mode of Action
      • By Source
      • By Delivery System
      • By Physical Form
      • By Application
      • By End Use
    • Market Attractiveness Analysis
      • By Country
      • By Mode of Action
      • By Source
      • By Delivery System
      • By Physical Form
      • By Application
      • By End Use
    • Key Takeaways
  17. Middle East and Africa Market Analysis 2020 to 2024 and Forecast 2025 to 2035, By Country
    • Historical Market Size Value (USD Million) & Volume (Units) Trend Analysis By Market Taxonomy, 2020 to 2024
    • Market Size Value (USD Million) & Volume (Units) Forecast By Market Taxonomy, 2025 to 2035
      • By Country
        • Turkey
        • UAE
        • Saudi Arabia
        • Israel
        • Other GCC Countries
        • North Africa
        • South Africa
      • By Mode of Action
      • By Source
      • By Delivery System
      • By Physical Form
      • By Application
      • By End Use
    • Market Attractiveness Analysis
      • By Country
      • By Mode of Action
      • By Source
      • By Delivery System
      • By Physical Form
      • By Application
      • By End Use
    • Key Takeaways
  18. Key Countries Market Analysis
    • USA
      • Pricing Analysis
      • Market Share Analysis, 2024
        • By Mode of Action
        • By Source
        • By Delivery System
        • By Physical Form
        • By Application
        • By End Use
    • Canada
      • Pricing Analysis
      • Market Share Analysis, 2024
        • By Mode of Action
        • By Source
        • By Delivery System
        • By Physical Form
        • By Application
        • By End Use
    • Brazil
      • Pricing Analysis
      • Market Share Analysis, 2024
        • By Mode of Action
        • By Source
        • By Delivery System
        • By Physical Form
        • By Application
        • By End Use
    • Mexico
      • Pricing Analysis
      • Market Share Analysis, 2024
        • By Mode of Action
        • By Source
        • By Delivery System
        • By Physical Form
        • By Application
        • By End Use
    • Colombia
      • Pricing Analysis
      • Market Share Analysis, 2024
        • By Mode of Action
        • By Source
        • By Delivery System
        • By Physical Form
        • By Application
        • By End Use
    • Germany
      • Pricing Analysis
      • Market Share Analysis, 2024
        • By Mode of Action
        • By Source
        • By Delivery System
        • By Physical Form
        • By Application
        • By End Use
    • UK
      • Pricing Analysis
      • Market Share Analysis, 2024
        • By Mode of Action
        • By Source
        • By Delivery System
        • By Physical Form
        • By Application
        • By End Use
    • France
      • Pricing Analysis
      • Market Share Analysis, 2024
        • By Mode of Action
        • By Source
        • By Delivery System
        • By Physical Form
        • By Application
        • By End Use
    • Italy
      • Pricing Analysis
      • Market Share Analysis, 2024
        • By Mode of Action
        • By Source
        • By Delivery System
        • By Physical Form
        • By Application
        • By End Use
    • Spain
      • Pricing Analysis
      • Market Share Analysis, 2024
        • By Mode of Action
        • By Source
        • By Delivery System
        • By Physical Form
        • By Application
        • By End Use
    • Belgium
      • Pricing Analysis
      • Market Share Analysis, 2024
        • By Mode of Action
        • By Source
        • By Delivery System
        • By Physical Form
        • By Application
        • By End Use
    • Netherlands
      • Pricing Analysis
      • Market Share Analysis, 2024
        • By Mode of Action
        • By Source
        • By Delivery System
        • By Physical Form
        • By Application
        • By End Use
    • Nordic
      • Pricing Analysis
      • Market Share Analysis, 2024
        • By Mode of Action
        • By Source
        • By Delivery System
        • By Physical Form
        • By Application
        • By End Use
    • Switzerland
      • Pricing Analysis
      • Market Share Analysis, 2024
        • By Mode of Action
        • By Source
        • By Delivery System
        • By Physical Form
        • By Application
        • By End Use
    • Russia
      • Pricing Analysis
      • Market Share Analysis, 2024
        • By Mode of Action
        • By Source
        • By Delivery System
        • By Physical Form
        • By Application
        • By End Use
    • Poland
      • Pricing Analysis
      • Market Share Analysis, 2024
        • By Mode of Action
        • By Source
        • By Delivery System
        • By Physical Form
        • By Application
        • By End Use
    • China
      • Pricing Analysis
      • Market Share Analysis, 2024
        • By Mode of Action
        • By Source
        • By Delivery System
        • By Physical Form
        • By Application
        • By End Use
    • Japan
      • Pricing Analysis
      • Market Share Analysis, 2024
        • By Mode of Action
        • By Source
        • By Delivery System
        • By Physical Form
        • By Application
        • By End Use
    • South Korea
      • Pricing Analysis
      • Market Share Analysis, 2024
        • By Mode of Action
        • By Source
        • By Delivery System
        • By Physical Form
        • By Application
        • By End Use
    • India
      • Pricing Analysis
      • Market Share Analysis, 2024
        • By Mode of Action
        • By Source
        • By Delivery System
        • By Physical Form
        • By Application
        • By End Use
    • Thailand
      • Pricing Analysis
      • Market Share Analysis, 2024
        • By Mode of Action
        • By Source
        • By Delivery System
        • By Physical Form
        • By Application
        • By End Use
    • Indonesia
      • Pricing Analysis
      • Market Share Analysis, 2024
        • By Mode of Action
        • By Source
        • By Delivery System
        • By Physical Form
        • By Application
        • By End Use
    • Australia
      • Pricing Analysis
      • Market Share Analysis, 2024
        • By Mode of Action
        • By Source
        • By Delivery System
        • By Physical Form
        • By Application
        • By End Use
    • New Zealand
      • Pricing Analysis
      • Market Share Analysis, 2024
        • By Mode of Action
        • By Source
        • By Delivery System
        • By Physical Form
        • By Application
        • By End Use
    • Turkey
      • Pricing Analysis
      • Market Share Analysis, 2024
        • By Mode of Action
        • By Source
        • By Delivery System
        • By Physical Form
        • By Application
        • By End Use
    • UAE
      • Pricing Analysis
      • Market Share Analysis, 2024
        • By Mode of Action
        • By Source
        • By Delivery System
        • By Physical Form
        • By Application
        • By End Use
    • Saudi Arabia
      • Pricing Analysis
      • Market Share Analysis, 2024
        • By Mode of Action
        • By Source
        • By Delivery System
        • By Physical Form
        • By Application
        • By End Use
    • Israel
      • Pricing Analysis
      • Market Share Analysis, 2024
        • By Mode of Action
        • By Source
        • By Delivery System
        • By Physical Form
        • By Application
        • By End Use
    • North Africa
      • Pricing Analysis
      • Market Share Analysis, 2024
        • By Mode of Action
        • By Source
        • By Delivery System
        • By Physical Form
        • By Application
        • By End Use
    • South Africa
      • Pricing Analysis
      • Market Share Analysis, 2024
        • By Mode of Action
        • By Source
        • By Delivery System
        • By Physical Form
        • By Application
        • By End Use
  19. Market Structure Analysis
    • Competition Dashboard
    • Competition Benchmarking
    • Market Share Analysis of Top Players
      • By Regional
      • By Mode of Action
      • By Source
      • By Delivery System
      • By Physical Form
      • By Application
      • By End Use
  20. Competition Analysis
    • Competition Deep Dive
      • DSM-Firmenich
        • Overview
        • Product Portfolio
        • Profitability by Market Segments (Product/Age /Sales Channel/Region)
        • Sales Footprint
        • Strategy Overview
          • Marketing Strategy
          • Product Strategy
          • Channel Strategy
      • Givaudan
        • Overview
        • Product Portfolio
        • Profitability by Market Segments (Product/Age /Sales Channel/Region)
        • Sales Footprint
        • Strategy Overview
          • Marketing Strategy
          • Product Strategy
          • Channel Strategy
      • Croda
        • Overview
        • Product Portfolio
        • Profitability by Market Segments (Product/Age /Sales Channel/Region)
        • Sales Footprint
        • Strategy Overview
          • Marketing Strategy
          • Product Strategy
          • Channel Strategy
      • BASF
        • Overview
        • Product Portfolio
        • Profitability by Market Segments (Product/Age /Sales Channel/Region)
        • Sales Footprint
        • Strategy Overview
          • Marketing Strategy
          • Product Strategy
          • Channel Strategy
      • Symrise
        • Overview
        • Product Portfolio
        • Profitability by Market Segments (Product/Age /Sales Channel/Region)
        • Sales Footprint
        • Strategy Overview
          • Marketing Strategy
          • Product Strategy
          • Channel Strategy
      • Ashland
        • Overview
        • Product Portfolio
        • Profitability by Market Segments (Product/Age /Sales Channel/Region)
        • Sales Footprint
        • Strategy Overview
          • Marketing Strategy
          • Product Strategy
          • Channel Strategy
      • Clariant
        • Overview
        • Product Portfolio
        • Profitability by Market Segments (Product/Age /Sales Channel/Region)
        • Sales Footprint
        • Strategy Overview
          • Marketing Strategy
          • Product Strategy
          • Channel Strategy
      • Evonik
        • Overview
        • Product Portfolio
        • Profitability by Market Segments (Product/Age /Sales Channel/Region)
        • Sales Footprint
        • Strategy Overview
          • Marketing Strategy
          • Product Strategy
          • Channel Strategy
      • Seppic
        • Overview
        • Product Portfolio
        • Profitability by Market Segments (Product/Age /Sales Channel/Region)
        • Sales Footprint
        • Strategy Overview
          • Marketing Strategy
          • Product Strategy
          • Channel Strategy
      • Lubrizol
        • Overview
        • Product Portfolio
        • Profitability by Market Segments (Product/Age /Sales Channel/Region)
        • Sales Footprint
        • Strategy Overview
          • Marketing Strategy
          • Product Strategy
          • Channel Strategy
      • Others
        • Overview
        • Product Portfolio
        • Profitability by Market Segments (Product/Age /Sales Channel/Region)
        • Sales Footprint
        • Strategy Overview
          • Marketing Strategy
          • Product Strategy
          • Channel Strategy
  21. Assumptions & Acronyms Used
  22. Research Methodology

List of Tables

  • Table 1: Global Market Value (USD Million) Forecast by Region, 2020-2035
  • Table 2: Global Market Volume (Units) Forecast by Region, 2020-2035
  • Table 3: Global Market Value (USD Million) Forecast by Mode of Action, 2020-2035
  • Table 4: Global Market Volume (Units) Forecast by Mode of Action, 2020-2035
  • Table 5: Global Market Value (USD Million) Forecast by Source, 2020-2035
  • Table 6: Global Market Volume (Units) Forecast by Source, 2020-2035
  • Table 7: Global Market Value (USD Million) Forecast by Delivery System, 2020-2035
  • Table 8: Global Market Volume (Units) Forecast by Delivery System, 2020-2035
  • Table 9: Global Market Value (USD Million) Forecast by Physical Form, 2020-2035
  • Table 10: Global Market Volume (Units) Forecast by Physical Form, 2020-2035
  • Table 11: Global Market Value (USD Million) Forecast by Application, 2020-2035
  • Table 12: Global Market Volume (Units) Forecast by Application, 2020-2035
  • Table 13: Global Market Value (USD Million) Forecast by End Use, 2020-2035
  • Table 14: Global Market Volume (Units) Forecast by End Use, 2020-2035
  • Table 15: North America Market Value (USD Million) Forecast by Country, 2020-2035
  • Table 16: North America Market Volume (Units) Forecast by Country, 2020-2035
  • Table 17: North America Market Value (USD Million) Forecast by Mode of Action, 2020-2035
  • Table 18: North America Market Volume (Units) Forecast by Mode of Action, 2020-2035
  • Table 19: North America Market Value (USD Million) Forecast by Source, 2020-2035
  • Table 20: North America Market Volume (Units) Forecast by Source, 2020-2035
  • Table 21: North America Market Value (USD Million) Forecast by Delivery System, 2020-2035
  • Table 22: North America Market Volume (Units) Forecast by Delivery System, 2020-2035
  • Table 23: North America Market Value (USD Million) Forecast by Physical Form, 2020-2035
  • Table 24: North America Market Volume (Units) Forecast by Physical Form, 2020-2035
  • Table 25: North America Market Value (USD Million) Forecast by Application, 2020-2035
  • Table 26: North America Market Volume (Units) Forecast by Application, 2020-2035
  • Table 27: North America Market Value (USD Million) Forecast by End Use, 2020-2035
  • Table 28: North America Market Volume (Units) Forecast by End Use, 2020-2035
  • Table 29: Latin America Market Value (USD Million) Forecast by Country, 2020-2035
  • Table 30: Latin America Market Volume (Units) Forecast by Country, 2020-2035
  • Table 31: Latin America Market Value (USD Million) Forecast by Mode of Action, 2020-2035
  • Table 32: Latin America Market Volume (Units) Forecast by Mode of Action, 2020-2035
  • Table 33: Latin America Market Value (USD Million) Forecast by Source, 2020-2035
  • Table 34: Latin America Market Volume (Units) Forecast by Source, 2020-2035
  • Table 35: Latin America Market Value (USD Million) Forecast by Delivery System, 2020-2035
  • Table 36: Latin America Market Volume (Units) Forecast by Delivery System, 2020-2035
  • Table 37: Latin America Market Value (USD Million) Forecast by Physical Form, 2020-2035
  • Table 38: Latin America Market Volume (Units) Forecast by Physical Form, 2020-2035
  • Table 39: Latin America Market Value (USD Million) Forecast by Application, 2020-2035
  • Table 40: Latin America Market Volume (Units) Forecast by Application, 2020-2035
  • Table 41: Latin America Market Value (USD Million) Forecast by End Use, 2020-2035
  • Table 42: Latin America Market Volume (Units) Forecast by End Use, 2020-2035
  • Table 43: Europe Market Value (USD Million) Forecast by Country, 2020-2035
  • Table 44: Europe Market Volume (Units) Forecast by Country, 2020-2035
  • Table 45: Europe Market Value (USD Million) Forecast by Mode of Action, 2020-2035
  • Table 46: Europe Market Volume (Units) Forecast by Mode of Action, 2020-2035
  • Table 47: Europe Market Value (USD Million) Forecast by Source, 2020-2035
  • Table 48: Europe Market Volume (Units) Forecast by Source, 2020-2035
  • Table 49: Europe Market Value (USD Million) Forecast by Delivery System, 2020-2035
  • Table 50: Europe Market Volume (Units) Forecast by Delivery System, 2020-2035
  • Table 51: Europe Market Value (USD Million) Forecast by Physical Form, 2020-2035
  • Table 52: Europe Market Volume (Units) Forecast by Physical Form, 2020-2035
  • Table 53: Europe Market Value (USD Million) Forecast by Application, 2020-2035
  • Table 54: Europe Market Volume (Units) Forecast by Application, 2020-2035
  • Table 55: Europe Market Value (USD Million) Forecast by End Use, 2020-2035
  • Table 56: Europe Market Volume (Units) Forecast by End Use, 2020-2035
  • Table 57: East Asia Market Value (USD Million) Forecast by Country, 2020-2035
  • Table 58: East Asia Market Volume (Units) Forecast by Country, 2020-2035
  • Table 59: East Asia Market Value (USD Million) Forecast by Mode of Action, 2020-2035
  • Table 60: East Asia Market Volume (Units) Forecast by Mode of Action, 2020-2035
  • Table 61: East Asia Market Value (USD Million) Forecast by Source, 2020-2035
  • Table 62: East Asia Market Volume (Units) Forecast by Source, 2020-2035
  • Table 63: East Asia Market Value (USD Million) Forecast by Delivery System, 2020-2035
  • Table 64: East Asia Market Volume (Units) Forecast by Delivery System, 2020-2035
  • Table 65: East Asia Market Value (USD Million) Forecast by Physical Form, 2020-2035
  • Table 66: East Asia Market Volume (Units) Forecast by Physical Form, 2020-2035
  • Table 67: East Asia Market Value (USD Million) Forecast by Application, 2020-2035
  • Table 68: East Asia Market Volume (Units) Forecast by Application, 2020-2035
  • Table 69: East Asia Market Value (USD Million) Forecast by End Use, 2020-2035
  • Table 70: East Asia Market Volume (Units) Forecast by End Use, 2020-2035
  • Table 71: South Asia & Pacific Market Value (USD Million) Forecast by Country, 2020-2035
  • Table 72: South Asia & Pacific Market Volume (Units) Forecast by Country, 2020-2035
  • Table 73: South Asia & Pacific Market Value (USD Million) Forecast by Mode of Action, 2020-2035
  • Table 74: South Asia & Pacific Market Volume (Units) Forecast by Mode of Action, 2020-2035
  • Table 75: South Asia & Pacific Market Value (USD Million) Forecast by Source, 2020-2035
  • Table 76: South Asia & Pacific Market Volume (Units) Forecast by Source, 2020-2035
  • Table 77: South Asia & Pacific Market Value (USD Million) Forecast by Delivery System, 2020-2035
  • Table 78: South Asia & Pacific Market Volume (Units) Forecast by Delivery System, 2020-2035
  • Table 79: South Asia & Pacific Market Value (USD Million) Forecast by Physical Form, 2020-2035
  • Table 80: South Asia & Pacific Market Volume (Units) Forecast by Physical Form, 2020-2035
  • Table 81: South Asia & Pacific Market Value (USD Million) Forecast by Application, 2020-2035
  • Table 82: South Asia & Pacific Market Volume (Units) Forecast by Application, 2020-2035
  • Table 83: South Asia & Pacific Market Value (USD Million) Forecast by End Use, 2020-2035
  • Table 84: South Asia & Pacific Market Volume (Units) Forecast by End Use, 2020-2035
  • Table 85: Middle East and Africa Market Value (USD Million) Forecast by Country, 2020-2035
  • Table 86: Middle East and Africa Market Volume (Units) Forecast by Country, 2020-2035
  • Table 87: Middle East and Africa Market Value (USD Million) Forecast by Mode of Action, 2020-2035
  • Table 88: Middle East and Africa Market Volume (Units) Forecast by Mode of Action, 2020-2035
  • Table 89: Middle East and Africa Market Value (USD Million) Forecast by Source, 2020-2035
  • Table 90: Middle East and Africa Market Volume (Units) Forecast by Source, 2020-2035
  • Table 91: Middle East and Africa Market Value (USD Million) Forecast by Delivery System, 2020-2035
  • Table 92: Middle East and Africa Market Volume (Units) Forecast by Delivery System, 2020-2035
  • Table 93: Middle East and Africa Market Value (USD Million) Forecast by Physical Form, 2020-2035
  • Table 94: Middle East and Africa Market Volume (Units) Forecast by Physical Form, 2020-2035
  • Table 95: Middle East and Africa Market Value (USD Million) Forecast by Application, 2020-2035
  • Table 96: Middle East and Africa Market Volume (Units) Forecast by Application, 2020-2035
  • Table 97: Middle East and Africa Market Value (USD Million) Forecast by End Use, 2020-2035
  • Table 98: Middle East and Africa Market Volume (Units) Forecast by End Use, 2020-2035

List of Figures

  • Figure 1: Global Market Value (USD Million) by Mode of Action, 2025-2035
  • Figure 2: Global Market Value (USD Million) by Source, 2025-2035
  • Figure 3: Global Market Value (USD Million) by Delivery System, 2025-2035
  • Figure 4: Global Market Value (USD Million) by Physical Form, 2025-2035
  • Figure 5: Global Market Value (USD Million) by Application, 2025-2035
  • Figure 6: Global Market Value (USD Million) by End Use, 2025-2035
  • Figure 7: Global Market Value (USD Million) by Region, 2025-2035
  • Figure 8: Global Market Value (USD Million) Analysis by Region, 2020-2035
  • Figure 9: Global Market Volume (Units) Analysis by Region, 2020-2035
  • Figure 10: Global Market Value Share (%) and BPS Analysis by Region, 2025-2035
  • Figure 11: Global Market Y-o-Y Growth (%) Projections by Region, 2025-2035
  • Figure 12: Global Market Value (USD Million) Analysis by Mode of Action, 2020-2035
  • Figure 13: Global Market Volume (Units) Analysis by Mode of Action, 2020-2035
  • Figure 14: Global Market Value Share (%) and BPS Analysis by Mode of Action, 2025-2035
  • Figure 15: Global Market Y-o-Y Growth (%) Projections by Mode of Action, 2025-2035
  • Figure 16: Global Market Value (USD Million) Analysis by Source, 2020-2035
  • Figure 17: Global Market Volume (Units) Analysis by Source, 2020-2035
  • Figure 18: Global Market Value Share (%) and BPS Analysis by Source, 2025-2035
  • Figure 19: Global Market Y-o-Y Growth (%) Projections by Source, 2025-2035
  • Figure 20: Global Market Value (USD Million) Analysis by Delivery System, 2020-2035
  • Figure 21: Global Market Volume (Units) Analysis by Delivery System, 2020-2035
  • Figure 22: Global Market Value Share (%) and BPS Analysis by Delivery System, 2025-2035
  • Figure 23: Global Market Y-o-Y Growth (%) Projections by Delivery System, 2025-2035
  • Figure 24: Global Market Value (USD Million) Analysis by Physical Form, 2020-2035
  • Figure 25: Global Market Volume (Units) Analysis by Physical Form, 2020-2035
  • Figure 26: Global Market Value Share (%) and BPS Analysis by Physical Form, 2025-2035
  • Figure 27: Global Market Y-o-Y Growth (%) Projections by Physical Form, 2025-2035
  • Figure 28: Global Market Value (USD Million) Analysis by Application, 2020-2035
  • Figure 29: Global Market Volume (Units) Analysis by Application, 2020-2035
  • Figure 30: Global Market Value Share (%) and BPS Analysis by Application, 2025-2035
  • Figure 31: Global Market Y-o-Y Growth (%) Projections by Application, 2025-2035
  • Figure 32: Global Market Value (USD Million) Analysis by End Use, 2020-2035
  • Figure 33: Global Market Volume (Units) Analysis by End Use, 2020-2035
  • Figure 34: Global Market Value Share (%) and BPS Analysis by End Use, 2025-2035
  • Figure 35: Global Market Y-o-Y Growth (%) Projections by End Use, 2025-2035
  • Figure 36: Global Market Attractiveness by Mode of Action, 2025-2035
  • Figure 37: Global Market Attractiveness by Source, 2025-2035
  • Figure 38: Global Market Attractiveness by Delivery System, 2025-2035
  • Figure 39: Global Market Attractiveness by Physical Form, 2025-2035
  • Figure 40: Global Market Attractiveness by Application, 2025-2035
  • Figure 41: Global Market Attractiveness by End Use, 2025-2035
  • Figure 42: Global Market Attractiveness by Region, 2025-2035
  • Figure 43: North America Market Value (USD Million) by Mode of Action, 2025-2035
  • Figure 44: North America Market Value (USD Million) by Source, 2025-2035
  • Figure 45: North America Market Value (USD Million) by Delivery System, 2025-2035
  • Figure 46: North America Market Value (USD Million) by Physical Form, 2025-2035
  • Figure 47: North America Market Value (USD Million) by Application, 2025-2035
  • Figure 48: North America Market Value (USD Million) by End Use, 2025-2035
  • Figure 49: North America Market Value (USD Million) by Country, 2025-2035
  • Figure 50: North America Market Value (USD Million) Analysis by Country, 2020-2035
  • Figure 51: North America Market Volume (Units) Analysis by Country, 2020-2035
  • Figure 52: North America Market Value Share (%) and BPS Analysis by Country, 2025-2035
  • Figure 53: North America Market Y-o-Y Growth (%) Projections by Country, 2025-2035
  • Figure 54: North America Market Value (USD Million) Analysis by Mode of Action, 2020-2035
  • Figure 55: North America Market Volume (Units) Analysis by Mode of Action, 2020-2035
  • Figure 56: North America Market Value Share (%) and BPS Analysis by Mode of Action, 2025-2035
  • Figure 57: North America Market Y-o-Y Growth (%) Projections by Mode of Action, 2025-2035
  • Figure 58: North America Market Value (USD Million) Analysis by Source, 2020-2035
  • Figure 59: North America Market Volume (Units) Analysis by Source, 2020-2035
  • Figure 60: North America Market Value Share (%) and BPS Analysis by Source, 2025-2035
  • Figure 61: North America Market Y-o-Y Growth (%) Projections by Source, 2025-2035
  • Figure 62: North America Market Value (USD Million) Analysis by Delivery System, 2020-2035
  • Figure 63: North America Market Volume (Units) Analysis by Delivery System, 2020-2035
  • Figure 64: North America Market Value Share (%) and BPS Analysis by Delivery System, 2025-2035
  • Figure 65: North America Market Y-o-Y Growth (%) Projections by Delivery System, 2025-2035
  • Figure 66: North America Market Value (USD Million) Analysis by Physical Form, 2020-2035
  • Figure 67: North America Market Volume (Units) Analysis by Physical Form, 2020-2035
  • Figure 68: North America Market Value Share (%) and BPS Analysis by Physical Form, 2025-2035
  • Figure 69: North America Market Y-o-Y Growth (%) Projections by Physical Form, 2025-2035
  • Figure 70: North America Market Value (USD Million) Analysis by Application, 2020-2035
  • Figure 71: North America Market Volume (Units) Analysis by Application, 2020-2035
  • Figure 72: North America Market Value Share (%) and BPS Analysis by Application, 2025-2035
  • Figure 73: North America Market Y-o-Y Growth (%) Projections by Application, 2025-2035
  • Figure 74: North America Market Value (USD Million) Analysis by End Use, 2020-2035
  • Figure 75: North America Market Volume (Units) Analysis by End Use, 2020-2035
  • Figure 76: North America Market Value Share (%) and BPS Analysis by End Use, 2025-2035
  • Figure 77: North America Market Y-o-Y Growth (%) Projections by End Use, 2025-2035
  • Figure 78: North America Market Attractiveness by Mode of Action, 2025-2035
  • Figure 79: North America Market Attractiveness by Source, 2025-2035
  • Figure 80: North America Market Attractiveness by Delivery System, 2025-2035
  • Figure 81: North America Market Attractiveness by Physical Form, 2025-2035
  • Figure 82: North America Market Attractiveness by Application, 2025-2035
  • Figure 83: North America Market Attractiveness by End Use, 2025-2035
  • Figure 84: North America Market Attractiveness by Country, 2025-2035
  • Figure 85: Latin America Market Value (USD Million) by Mode of Action, 2025-2035
  • Figure 86: Latin America Market Value (USD Million) by Source, 2025-2035
  • Figure 87: Latin America Market Value (USD Million) by Delivery System, 2025-2035
  • Figure 88: Latin America Market Value (USD Million) by Physical Form, 2025-2035
  • Figure 89: Latin America Market Value (USD Million) by Application, 2025-2035
  • Figure 90: Latin America Market Value (USD Million) by End Use, 2025-2035
  • Figure 91: Latin America Market Value (USD Million) by Country, 2025-2035
  • Figure 92: Latin America Market Value (USD Million) Analysis by Country, 2020-2035
  • Figure 93: Latin America Market Volume (Units) Analysis by Country, 2020-2035
  • Figure 94: Latin America Market Value Share (%) and BPS Analysis by Country, 2025-2035
  • Figure 95: Latin America Market Y-o-Y Growth (%) Projections by Country, 2025-2035
  • Figure 96: Latin America Market Value (USD Million) Analysis by Mode of Action, 2020-2035
  • Figure 97: Latin America Market Volume (Units) Analysis by Mode of Action, 2020-2035
  • Figure 98: Latin America Market Value Share (%) and BPS Analysis by Mode of Action, 2025-2035
  • Figure 99: Latin America Market Y-o-Y Growth (%) Projections by Mode of Action, 2025-2035
  • Figure 100: Latin America Market Value (USD Million) Analysis by Source, 2020-2035
  • Figure 101: Latin America Market Volume (Units) Analysis by Source, 2020-2035
  • Figure 102: Latin America Market Value Share (%) and BPS Analysis by Source, 2025-2035
  • Figure 103: Latin America Market Y-o-Y Growth (%) Projections by Source, 2025-2035
  • Figure 104: Latin America Market Value (USD Million) Analysis by Delivery System, 2020-2035
  • Figure 105: Latin America Market Volume (Units) Analysis by Delivery System, 2020-2035
  • Figure 106: Latin America Market Value Share (%) and BPS Analysis by Delivery System, 2025-2035
  • Figure 107: Latin America Market Y-o-Y Growth (%) Projections by Delivery System, 2025-2035
  • Figure 108: Latin America Market Value (USD Million) Analysis by Physical Form, 2020-2035
  • Figure 109: Latin America Market Volume (Units) Analysis by Physical Form, 2020-2035
  • Figure 110: Latin America Market Value Share (%) and BPS Analysis by Physical Form, 2025-2035
  • Figure 111: Latin America Market Y-o-Y Growth (%) Projections by Physical Form, 2025-2035
  • Figure 112: Latin America Market Value (USD Million) Analysis by Application, 2020-2035
  • Figure 113: Latin America Market Volume (Units) Analysis by Application, 2020-2035
  • Figure 114: Latin America Market Value Share (%) and BPS Analysis by Application, 2025-2035
  • Figure 115: Latin America Market Y-o-Y Growth (%) Projections by Application, 2025-2035
  • Figure 116: Latin America Market Value (USD Million) Analysis by End Use, 2020-2035
  • Figure 117: Latin America Market Volume (Units) Analysis by End Use, 2020-2035
  • Figure 118: Latin America Market Value Share (%) and BPS Analysis by End Use, 2025-2035
  • Figure 119: Latin America Market Y-o-Y Growth (%) Projections by End Use, 2025-2035
  • Figure 120: Latin America Market Attractiveness by Mode of Action, 2025-2035
  • Figure 121: Latin America Market Attractiveness by Source, 2025-2035
  • Figure 122: Latin America Market Attractiveness by Delivery System, 2025-2035
  • Figure 123: Latin America Market Attractiveness by Physical Form, 2025-2035
  • Figure 124: Latin America Market Attractiveness by Application, 2025-2035
  • Figure 125: Latin America Market Attractiveness by End Use, 2025-2035
  • Figure 126: Latin America Market Attractiveness by Country, 2025-2035
  • Figure 127: Europe Market Value (USD Million) by Mode of Action, 2025-2035
  • Figure 128: Europe Market Value (USD Million) by Source, 2025-2035
  • Figure 129: Europe Market Value (USD Million) by Delivery System, 2025-2035
  • Figure 130: Europe Market Value (USD Million) by Physical Form, 2025-2035
  • Figure 131: Europe Market Value (USD Million) by Application, 2025-2035
  • Figure 132: Europe Market Value (USD Million) by End Use, 2025-2035
  • Figure 133: Europe Market Value (USD Million) by Country, 2025-2035
  • Figure 134: Europe Market Value (USD Million) Analysis by Country, 2020-2035
  • Figure 135: Europe Market Volume (Units) Analysis by Country, 2020-2035
  • Figure 136: Europe Market Value Share (%) and BPS Analysis by Country, 2025-2035
  • Figure 137: Europe Market Y-o-Y Growth (%) Projections by Country, 2025-2035
  • Figure 138: Europe Market Value (USD Million) Analysis by Mode of Action, 2020-2035
  • Figure 139: Europe Market Volume (Units) Analysis by Mode of Action, 2020-2035
  • Figure 140: Europe Market Value Share (%) and BPS Analysis by Mode of Action, 2025-2035
  • Figure 141: Europe Market Y-o-Y Growth (%) Projections by Mode of Action, 2025-2035
  • Figure 142: Europe Market Value (USD Million) Analysis by Source, 2020-2035
  • Figure 143: Europe Market Volume (Units) Analysis by Source, 2020-2035
  • Figure 144: Europe Market Value Share (%) and BPS Analysis by Source, 2025-2035
  • Figure 145: Europe Market Y-o-Y Growth (%) Projections by Source, 2025-2035
  • Figure 146: Europe Market Value (USD Million) Analysis by Delivery System, 2020-2035
  • Figure 147: Europe Market Volume (Units) Analysis by Delivery System, 2020-2035
  • Figure 148: Europe Market Value Share (%) and BPS Analysis by Delivery System, 2025-2035
  • Figure 149: Europe Market Y-o-Y Growth (%) Projections by Delivery System, 2025-2035
  • Figure 150: Europe Market Value (USD Million) Analysis by Physical Form, 2020-2035
  • Figure 151: Europe Market Volume (Units) Analysis by Physical Form, 2020-2035
  • Figure 152: Europe Market Value Share (%) and BPS Analysis by Physical Form, 2025-2035
  • Figure 153: Europe Market Y-o-Y Growth (%) Projections by Physical Form, 2025-2035
  • Figure 154: Europe Market Value (USD Million) Analysis by Application, 2020-2035
  • Figure 155: Europe Market Volume (Units) Analysis by Application, 2020-2035
  • Figure 156: Europe Market Value Share (%) and BPS Analysis by Application, 2025-2035
  • Figure 157: Europe Market Y-o-Y Growth (%) Projections by Application, 2025-2035
  • Figure 158: Europe Market Value (USD Million) Analysis by End Use, 2020-2035
  • Figure 159: Europe Market Volume (Units) Analysis by End Use, 2020-2035
  • Figure 160: Europe Market Value Share (%) and BPS Analysis by End Use, 2025-2035
  • Figure 161: Europe Market Y-o-Y Growth (%) Projections by End Use, 2025-2035
  • Figure 162: Europe Market Attractiveness by Mode of Action, 2025-2035
  • Figure 163: Europe Market Attractiveness by Source, 2025-2035
  • Figure 164: Europe Market Attractiveness by Delivery System, 2025-2035
  • Figure 165: Europe Market Attractiveness by Physical Form, 2025-2035
  • Figure 166: Europe Market Attractiveness by Application, 2025-2035
  • Figure 167: Europe Market Attractiveness by End Use, 2025-2035
  • Figure 168: Europe Market Attractiveness by Country, 2025-2035
  • Figure 169: East Asia Market Value (USD Million) by Mode of Action, 2025-2035
  • Figure 170: East Asia Market Value (USD Million) by Source, 2025-2035
  • Figure 171: East Asia Market Value (USD Million) by Delivery System, 2025-2035
  • Figure 172: East Asia Market Value (USD Million) by Physical Form, 2025-2035
  • Figure 173: East Asia Market Value (USD Million) by Application, 2025-2035
  • Figure 174: East Asia Market Value (USD Million) by End Use, 2025-2035
  • Figure 175: East Asia Market Value (USD Million) by Country, 2025-2035
  • Figure 176: East Asia Market Value (USD Million) Analysis by Country, 2020-2035
  • Figure 177: East Asia Market Volume (Units) Analysis by Country, 2020-2035
  • Figure 178: East Asia Market Value Share (%) and BPS Analysis by Country, 2025-2035
  • Figure 179: East Asia Market Y-o-Y Growth (%) Projections by Country, 2025-2035
  • Figure 180: East Asia Market Value (USD Million) Analysis by Mode of Action, 2020-2035
  • Figure 181: East Asia Market Volume (Units) Analysis by Mode of Action, 2020-2035
  • Figure 182: East Asia Market Value Share (%) and BPS Analysis by Mode of Action, 2025-2035
  • Figure 183: East Asia Market Y-o-Y Growth (%) Projections by Mode of Action, 2025-2035
  • Figure 184: East Asia Market Value (USD Million) Analysis by Source, 2020-2035
  • Figure 185: East Asia Market Volume (Units) Analysis by Source, 2020-2035
  • Figure 186: East Asia Market Value Share (%) and BPS Analysis by Source, 2025-2035
  • Figure 187: East Asia Market Y-o-Y Growth (%) Projections by Source, 2025-2035
  • Figure 188: East Asia Market Value (USD Million) Analysis by Delivery System, 2020-2035
  • Figure 189: East Asia Market Volume (Units) Analysis by Delivery System, 2020-2035
  • Figure 190: East Asia Market Value Share (%) and BPS Analysis by Delivery System, 2025-2035
  • Figure 191: East Asia Market Y-o-Y Growth (%) Projections by Delivery System, 2025-2035
  • Figure 192: East Asia Market Value (USD Million) Analysis by Physical Form, 2020-2035
  • Figure 193: East Asia Market Volume (Units) Analysis by Physical Form, 2020-2035
  • Figure 194: East Asia Market Value Share (%) and BPS Analysis by Physical Form, 2025-2035
  • Figure 195: East Asia Market Y-o-Y Growth (%) Projections by Physical Form, 2025-2035
  • Figure 196: East Asia Market Value (USD Million) Analysis by Application, 2020-2035
  • Figure 197: East Asia Market Volume (Units) Analysis by Application, 2020-2035
  • Figure 198: East Asia Market Value Share (%) and BPS Analysis by Application, 2025-2035
  • Figure 199: East Asia Market Y-o-Y Growth (%) Projections by Application, 2025-2035
  • Figure 200: East Asia Market Value (USD Million) Analysis by End Use, 2020-2035
  • Figure 201: East Asia Market Volume (Units) Analysis by End Use, 2020-2035
  • Figure 202: East Asia Market Value Share (%) and BPS Analysis by End Use, 2025-2035
  • Figure 203: East Asia Market Y-o-Y Growth (%) Projections by End Use, 2025-2035
  • Figure 204: East Asia Market Attractiveness by Mode of Action, 2025-2035
  • Figure 205: East Asia Market Attractiveness by Source, 2025-2035
  • Figure 206: East Asia Market Attractiveness by Delivery System, 2025-2035
  • Figure 207: East Asia Market Attractiveness by Physical Form, 2025-2035
  • Figure 208: East Asia Market Attractiveness by Application, 2025-2035
  • Figure 209: East Asia Market Attractiveness by End Use, 2025-2035
  • Figure 210: East Asia Market Attractiveness by Country, 2025-2035
  • Figure 211: South Asia & Pacific Market Value (USD Million) by Mode of Action, 2025-2035
  • Figure 212: South Asia & Pacific Market Value (USD Million) by Source, 2025-2035
  • Figure 213: South Asia & Pacific Market Value (USD Million) by Delivery System, 2025-2035
  • Figure 214: South Asia & Pacific Market Value (USD Million) by Physical Form, 2025-2035
  • Figure 215: South Asia & Pacific Market Value (USD Million) by Application, 2025-2035
  • Figure 216: South Asia & Pacific Market Value (USD Million) by End Use, 2025-2035
  • Figure 217: South Asia & Pacific Market Value (USD Million) by Country, 2025-2035
  • Figure 218: South Asia & Pacific Market Value (USD Million) Analysis by Country, 2020-2035
  • Figure 219: South Asia & Pacific Market Volume (Units) Analysis by Country, 2020-2035
  • Figure 220: South Asia & Pacific Market Value Share (%) and BPS Analysis by Country, 2025-2035
  • Figure 221: South Asia & Pacific Market Y-o-Y Growth (%) Projections by Country, 2025-2035
  • Figure 222: South Asia & Pacific Market Value (USD Million) Analysis by Mode of Action, 2020-2035
  • Figure 223: South Asia & Pacific Market Volume (Units) Analysis by Mode of Action, 2020-2035
  • Figure 224: South Asia & Pacific Market Value Share (%) and BPS Analysis by Mode of Action, 2025-2035
  • Figure 225: South Asia & Pacific Market Y-o-Y Growth (%) Projections by Mode of Action, 2025-2035
  • Figure 226: South Asia & Pacific Market Value (USD Million) Analysis by Source, 2020-2035
  • Figure 227: South Asia & Pacific Market Volume (Units) Analysis by Source, 2020-2035
  • Figure 228: South Asia & Pacific Market Value Share (%) and BPS Analysis by Source, 2025-2035
  • Figure 229: South Asia & Pacific Market Y-o-Y Growth (%) Projections by Source, 2025-2035
  • Figure 230: South Asia & Pacific Market Value (USD Million) Analysis by Delivery System, 2020-2035
  • Figure 231: South Asia & Pacific Market Volume (Units) Analysis by Delivery System, 2020-2035
  • Figure 232: South Asia & Pacific Market Value Share (%) and BPS Analysis by Delivery System, 2025-2035
  • Figure 233: South Asia & Pacific Market Y-o-Y Growth (%) Projections by Delivery System, 2025-2035
  • Figure 234: South Asia & Pacific Market Value (USD Million) Analysis by Physical Form, 2020-2035
  • Figure 235: South Asia & Pacific Market Volume (Units) Analysis by Physical Form, 2020-2035
  • Figure 236: South Asia & Pacific Market Value Share (%) and BPS Analysis by Physical Form, 2025-2035
  • Figure 237: South Asia & Pacific Market Y-o-Y Growth (%) Projections by Physical Form, 2025-2035
  • Figure 238: South Asia & Pacific Market Value (USD Million) Analysis by Application, 2020-2035
  • Figure 239: South Asia & Pacific Market Volume (Units) Analysis by Application, 2020-2035
  • Figure 240: South Asia & Pacific Market Value Share (%) and BPS Analysis by Application, 2025-2035
  • Figure 241: South Asia & Pacific Market Y-o-Y Growth (%) Projections by Application, 2025-2035
  • Figure 242: South Asia & Pacific Market Value (USD Million) Analysis by End Use, 2020-2035
  • Figure 243: South Asia & Pacific Market Volume (Units) Analysis by End Use, 2020-2035
  • Figure 244: South Asia & Pacific Market Value Share (%) and BPS Analysis by End Use, 2025-2035
  • Figure 245: South Asia & Pacific Market Y-o-Y Growth (%) Projections by End Use, 2025-2035
  • Figure 246: South Asia & Pacific Market Attractiveness by Mode of Action, 2025-2035
  • Figure 247: South Asia & Pacific Market Attractiveness by Source, 2025-2035
  • Figure 248: South Asia & Pacific Market Attractiveness by Delivery System, 2025-2035
  • Figure 249: South Asia & Pacific Market Attractiveness by Physical Form, 2025-2035
  • Figure 250: South Asia & Pacific Market Attractiveness by Application, 2025-2035
  • Figure 251: South Asia & Pacific Market Attractiveness by End Use, 2025-2035
  • Figure 252: South Asia & Pacific Market Attractiveness by Country, 2025-2035
  • Figure 253: Middle East and Africa Market Value (USD Million) by Mode of Action, 2025-2035
  • Figure 254: Middle East and Africa Market Value (USD Million) by Source, 2025-2035
  • Figure 255: Middle East and Africa Market Value (USD Million) by Delivery System, 2025-2035
  • Figure 256: Middle East and Africa Market Value (USD Million) by Physical Form, 2025-2035
  • Figure 257: Middle East and Africa Market Value (USD Million) by Application, 2025-2035
  • Figure 258: Middle East and Africa Market Value (USD Million) by End Use, 2025-2035
  • Figure 259: Middle East and Africa Market Value (USD Million) by Country, 2025-2035
  • Figure 260: Middle East and Africa Market Value (USD Million) Analysis by Country, 2020-2035
  • Figure 261: Middle East and Africa Market Volume (Units) Analysis by Country, 2020-2035
  • Figure 262: Middle East and Africa Market Value Share (%) and BPS Analysis by Country, 2025-2035
  • Figure 263: Middle East and Africa Market Y-o-Y Growth (%) Projections by Country, 2025-2035
  • Figure 264: Middle East and Africa Market Value (USD Million) Analysis by Mode of Action, 2020-2035
  • Figure 265: Middle East and Africa Market Volume (Units) Analysis by Mode of Action, 2020-2035
  • Figure 266: Middle East and Africa Market Value Share (%) and BPS Analysis by Mode of Action, 2025-2035
  • Figure 267: Middle East and Africa Market Y-o-Y Growth (%) Projections by Mode of Action, 2025-2035
  • Figure 268: Middle East and Africa Market Value (USD Million) Analysis by Source, 2020-2035
  • Figure 269: Middle East and Africa Market Volume (Units) Analysis by Source, 2020-2035
  • Figure 270: Middle East and Africa Market Value Share (%) and BPS Analysis by Source, 2025-2035
  • Figure 271: Middle East and Africa Market Y-o-Y Growth (%) Projections by Source, 2025-2035
  • Figure 272: Middle East and Africa Market Value (USD Million) Analysis by Delivery System, 2020-2035
  • Figure 273: Middle East and Africa Market Volume (Units) Analysis by Delivery System, 2020-2035
  • Figure 274: Middle East and Africa Market Value Share (%) and BPS Analysis by Delivery System, 2025-2035
  • Figure 275: Middle East and Africa Market Y-o-Y Growth (%) Projections by Delivery System, 2025-2035
  • Figure 276: Middle East and Africa Market Value (USD Million) Analysis by Physical Form, 2020-2035
  • Figure 277: Middle East and Africa Market Volume (Units) Analysis by Physical Form, 2020-2035
  • Figure 278: Middle East and Africa Market Value Share (%) and BPS Analysis by Physical Form, 2025-2035
  • Figure 279: Middle East and Africa Market Y-o-Y Growth (%) Projections by Physical Form, 2025-2035
  • Figure 280: Middle East and Africa Market Value (USD Million) Analysis by Application, 2020-2035
  • Figure 281: Middle East and Africa Market Volume (Units) Analysis by Application, 2020-2035
  • Figure 282: Middle East and Africa Market Value Share (%) and BPS Analysis by Application, 2025-2035
  • Figure 283: Middle East and Africa Market Y-o-Y Growth (%) Projections by Application, 2025-2035
  • Figure 284: Middle East and Africa Market Value (USD Million) Analysis by End Use, 2020-2035
  • Figure 285: Middle East and Africa Market Volume (Units) Analysis by End Use, 2020-2035
  • Figure 286: Middle East and Africa Market Value Share (%) and BPS Analysis by End Use, 2025-2035
  • Figure 287: Middle East and Africa Market Y-o-Y Growth (%) Projections by End Use, 2025-2035
  • Figure 288: Middle East and Africa Market Attractiveness by Mode of Action, 2025-2035
  • Figure 289: Middle East and Africa Market Attractiveness by Source, 2025-2035
  • Figure 290: Middle East and Africa Market Attractiveness by Delivery System, 2025-2035
  • Figure 291: Middle East and Africa Market Attractiveness by Physical Form, 2025-2035
  • Figure 292: Middle East and Africa Market Attractiveness by Application, 2025-2035
  • Figure 293: Middle East and Africa Market Attractiveness by End Use, 2025-2035
  • Figure 294: Middle East and Africa Market Attractiveness by Country, 2025-2035

Frequently Asked Questions

How big is the Anti-Aging Agents Market in 2025?

The global Anti-Aging Agents Market is estimated to be valued at USD 5,903.8 million in 2025, supported by rising demand for clinically validated actives and expanding use of encapsulated delivery systems.

What will be the size of the Anti-Aging Agents Market in 2035?

The market size for the Anti-Aging Agents Market is projected to reach USD 12,802.4 million by 2035, reflecting more than a twofold increase over the decade.

How much will be the Anti-Aging Agents Market growth between 2025 and 2035?

The Anti-Aging Agents Market is expected to grow at a CAGR of 8.0% between 2025 and 2035, reflecting strong long-term adoption of biotechnology-derived and encapsulated actives.

What are the key product types in the Anti-Aging Agents Market?

The key product types in the Anti-Aging Agents Market include collagen and ECM stimulators, antioxidant systems, cell renewal and resurfacing agents, firming and elasticity enhancers, and long-lasting hydration systems.

Which segment is expected to contribute a significant share in the Anti-Aging Agents Market in 2025?

In terms of delivery system, the encapsulated segment is expected to command 48.0% share in 2025, supported by superior stability, enhanced bioavailability, and claim substantiation in premium formulations.

Explore Similar Insights

Future Market Insights

Anti-Aging Agents Market

Chat With

MaRIA

Hi There, I am MaRIA, Your Market Research Intelligence Assistant. How may I help you?