Antioxidant-Rich Sea Buckthorn Market Size and Share Forecast Outlook 2025 to 2035

A global valuation of USD 1,153.1 million is projected for the Antioxidant-Rich Sea Buckthorn Market in 2025, and the size is expected to advance to USD 3,800.7 million by 2035. This growth translates into an overall addition of USD 2,647.6 million across the decade, equivalent to a more than threefold increase. The expansion will be sustained by a CAGR of 12.7% between 2025 and 2035, reflecting consistent demand momentum across wellness, nutraceutical, and cosmetic applications.
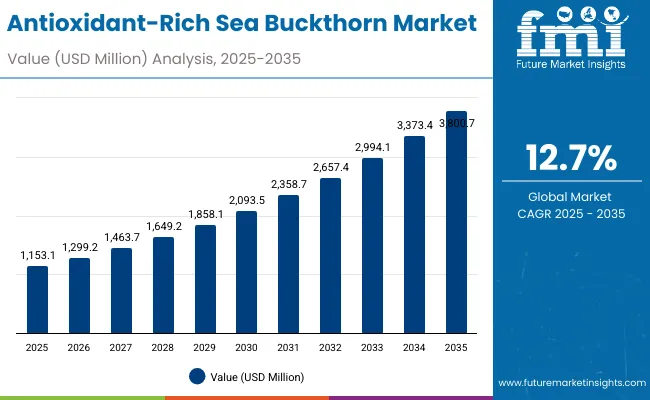
Quick Stats for Antioxidant-Rich Sea Buckthorn Market

  • Antioxidant-Rich Sea Buckthorn Market Value (2025): USD 1,153.1 million
  • Antioxidant-Rich Sea Buckthorn Market Forecast Value (2035): USD 3,800.7 million
  • Antioxidant-Rich Sea Buckthorn Market Forecast CAGR: 12.7%
  • Leading Segment in Antioxidant-Rich Sea Buckthorn Market in 2025: Anti-aging (52.5%)
  • Key Growth Regions in the Antioxidant-Rich Sea Buckthorn Market: Asia-Pacific, North America, Europe
  • Top Key Players in Antioxidant-Rich Sea Buckthorn Market: SeabuckWonders, BASF, DSM-Firmenich, Croda, Botanic Healthcare, Aromtech, Ashland, Flavex, Bionap, Greentech

Antioxidant Rich Sea Buckthorn Market

Antioxidant-Rich Sea Buckthorn Market Key Takeaways

Metric Value
Market Estimated Value in (2025E) USD 1,153.1 million
Market Forecast Value in (2035F) USD 3,800.7 million
Forecast CAGR (2025 to 2035) 12.70%

During the initial period from 2025 to 2030, the market is anticipated to expand from USD 1,153.1 million to USD 2,093.5 million, thereby adding USD 940.4 million. This segment of growth represents nearly 35.5% of the total decade’s value creation, with rising adoption in premium skincare serums, clean-label nutricosmetics, and plant-derived wellness solutions reinforcing the pace. Consumer inclination toward anti-aging benefits is expected to remain the prime driver in this early stage.

The second half of the decade, spanning 2030 to 2035, is projected to contribute an additional USD 1,707.2 million, as the market rises from USD 2,093.5 million to USD 3,800.7 million. This phase accounts for nearly 64.5% of decade growth, emphasizing the acceleration anticipated in advanced product formats and broader distribution via e-commerce and pharmacies. Strong penetration of certified organic and multifunctional claims is expected to dominate this outlook, while Asian markets led by China and India are forecasted to remain pivotal growth engines.

From 2020 to 2024, the Antioxidant-Rich Sea Buckthorn Market expanded from a niche botanical category into a recognized global segment, propelled by clean-label and natural ingredient adoption. During this period, premium skincare and nutricosmetics accounted for the majority of demand, with anti-aging claims dominating consumer preference. Companies such as SeabuckWonders strengthened presence in the USA, while European and Asian suppliers emphasized organic-certified sourcing. Competitive differentiation relied on transparency, supply chain sustainability, and clinical substantiation.

By 2025, demand is expected to accelerate to USD 1,153.1 million, and the revenue mix will shift toward multifunctional claims, eco-certified products, and digital-first distribution. Traditional players are adapting by expanding certified organic portfolios, while global ingredient leaders emphasize scalability and advanced extraction methods. Competitive advantage is expected to move toward sustainability credentials, integrated science-backed marketing, and the ability to deliver premium yet accessible formulations. Emerging entrants specializing in D2C and niche applications are projected to gain share.

Why the Antioxidant-Rich Sea Buckthorn Market is growing?

The growth of the Antioxidant-Rich Sea Buckthorn Market is being propelled by rising consumer demand for natural, multifunctional ingredients that align with wellness and clean-label trends. Increasing recognition of sea buckthorn’s antioxidant, anti-aging, and skin-repair properties has positioned it as a preferred choice across skincare and nutraceutical formulations. Expansion in e-commerce and specialty retail channels has accelerated accessibility, enabling wider consumer reach and enhancing product adoption. Certified organic and vegan claims are increasingly influencing purchasing behavior, reinforcing trust and creating opportunities for premium positioning.

Clinical validation of bioactive compounds has elevated credibility, while alignment with sustainable sourcing practices has attracted environmentally conscious consumers. Strong growth is also being supported by emerging economies, where herbal traditions and rising disposable incomes are driving adoption. Continuous innovation in serums, concentrates, and nutricosmetics is expected to diversify applications. This combination of health awareness, digital expansion, and sustainability focus is expected to sustain double-digit growth through 2035.

Segmental Analysis

The Antioxidant-Rich Sea Buckthorn Market has been segmented to reflect consumer preferences and application areas shaping long-term growth. Segmentation has been carried out by function, product type, and claims, representing the key pillars influencing adoption. In function, anti-aging applications are anticipated to lead, supported by preventive wellness and scientific validation of antioxidants. Within product types, serums and concentrates are projected to gain traction, reflecting their targeted efficacy and alignment with premium skincare routines. From a claims perspective, organic-certified products are expected to capture a strong position, as sustainability and transparency emerge as critical factors shaping consumer trust and brand loyalty. Together, these segments illustrate how science-driven innovation and clean-label positioning are expected to define competitive advantage.
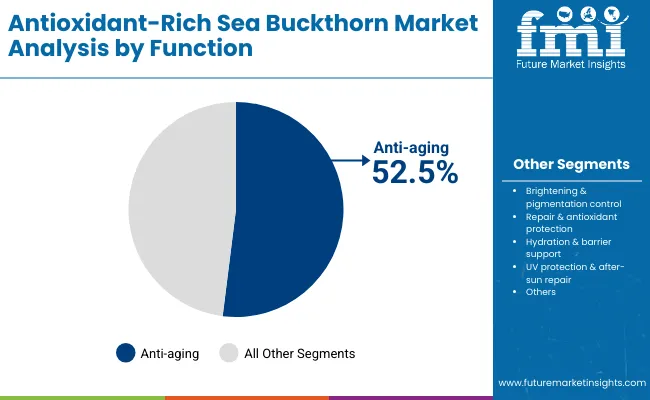
Insights into the Function Segment with Anti-aging Leading in Market Share

Antioxidant Rich Sea Buckthorn Market By Function

Segment Market Value Share, 2025
Anti-aging 52.5%
Others 47.5%

The function segment is expected to be led by anti-aging, projected to account for 52.5% of revenues in 2025, equal to USD 616.3 million. Growth is being reinforced by preventive skincare adoption and the integration of botanical antioxidants into advanced formulations. As clinical substantiation becomes central, anti-aging is anticipated to remain the cornerstone of functional demand. This growth is being reinforced by expanding consumer awareness of the role antioxidants play in delaying visible signs of aging and strengthening skin barrier health. The segment’s momentum is further supported by innovations in clinically validated formulations that enhance credibility and trust. As preventive skincare becomes a global priority, anti-aging applications are anticipated to remain the cornerstone of functional growth within the sea buckthorn market.
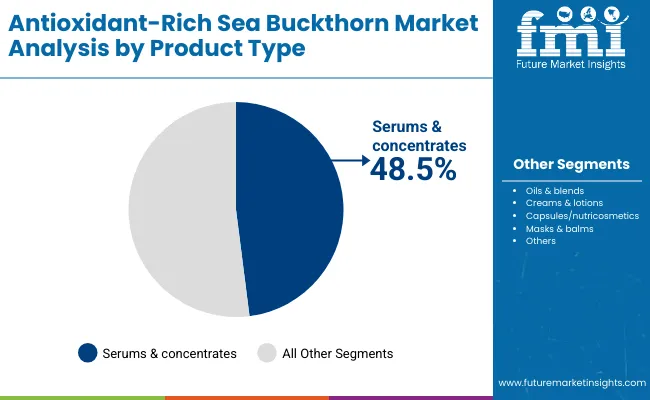
Insights into the Product Type Segment with Serums & Concentrates Gaining Prominence

Antioxidant Rich Sea Buckthorn Market By Product

Segment Market Value Share, 2025
Serums & concentrates 48.5%
Others 51.5%

Serums and concentrates are projected to hold 48.5% share of the Antioxidant-Rich Sea Buckthorn Market in 2025, valued at USD 557.6 million, while other product types account for 51.5% share, equal to USD 594.02 million. Product preferences are being shaped by rising consumer inclination toward targeted, high-efficacy formats. Serums and concentrates are anticipated to gain momentum as concentrated antioxidant doses deliver visible results with precision and premium positioning is reinforced through transparency and clinical validation. Although other formats maintain a slightly larger share overall, serums and concentrates are expected to grow faster, reflecting their alignment with modern skincare routines. As personalization continues to define beauty and wellness, this category is likely to remain strategically important in driving long-term adoption.
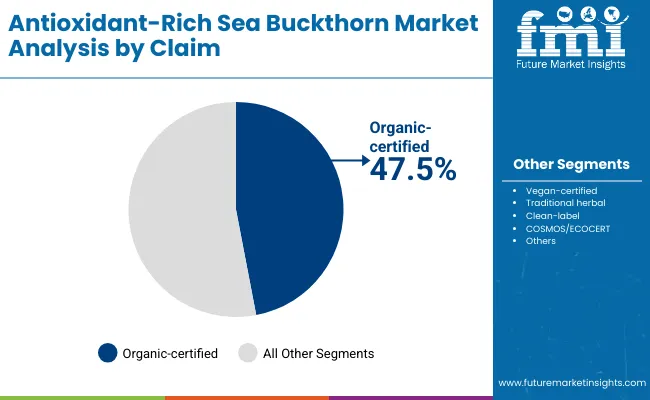
Insights into the Claim Segment with Organic-certified Products Driving Trust

Antioxidant Rich Sea Buckthorn Market By Claim

Segment Market Value Share, 2025
Organic-certified 47.5%
Others 52.5%

Organic-certified products are projected to account for 47.5% share of the Antioxidant-Rich Sea Buckthorn Market in 2025, valued at USD 546.5 million, while other claims hold 52.5% share, equal to USD 605.67 million. The claim-based segmentation highlights the critical role of certifications in shaping consumer purchasing behavior. The rising influence of eco-conscious lifestyles and demand for clean-label authenticity are expected to reinforce the appeal of organic-certified offerings. Certifications such as COSMOS and ECOCERT are enhancing transparency, strengthening trust, and supporting premium positioning for brands. Although other claims maintain a slightly larger share overall, the organic-certified category is anticipated to expand at a faster pace, supported by sustainability priorities and ethical sourcing standards. With growing awareness of health and environmental impacts, certified organic claims are projected to become a defining element of brand competitiveness in the decade ahead.

What are the Drivers, Restraints, and Key Trends of the Antioxidant-Rich Sea Buckthorn Market?

The Antioxidant-Rich Sea Buckthorn Market is evolving as advanced botanical formulations reshape skincare and nutraceuticals, though challenges such as sourcing constraints and certification complexities persist alongside surging interest in sustainable wellness and evidence-backed anti-aging solutions.

Expansion of Evidence-Based Marketing and Clinical Validation

Market growth is being reinforced by the increasing use of peer-reviewed clinical studies to substantiate claims surrounding sea buckthorn’s antioxidant efficacy. Scientific validation has begun to shift consumer perception from traditional herbal use toward modern, evidence-backed solutions. This dynamic is strengthening brand credibility and facilitating acceptance in premium markets where transparency and proof of performance are critical. With clinical endorsements being leveraged across product labels, marketing campaigns, and digital platforms, the capacity to translate scientific data into consumer trust is expected to accelerate adoption in skincare and nutricosmetics. Future growth is projected to be driven by companies that strategically invest in research collaborations and third-party testing to differentiate their offerings and secure stronger positioning in regulatory-sensitive regions.

Supply Chain Vulnerability and Geographic Dependence

Despite promising demand, growth is constrained by the geographical concentration of sea buckthorn cultivation, which is heavily reliant on regions such as China, Mongolia, and parts of Eastern Europe. Climate variability, soil-specific requirements, and seasonal harvesting windows have introduced supply volatility, thereby limiting the scalability of production. This dependence exposes manufacturers to risks of raw material shortages and pricing instability, particularly during periods of adverse weather or regulatory shifts in key growing countries. Furthermore, the specialized processing required for oil extraction and bioactive preservation adds layers of complexity that increase operational costs. Unless sustainable agricultural practices and diversified sourcing strategies are adopted, these supply vulnerabilities could hinder the ability of producers to consistently meet global demand, restricting long-term expansion.
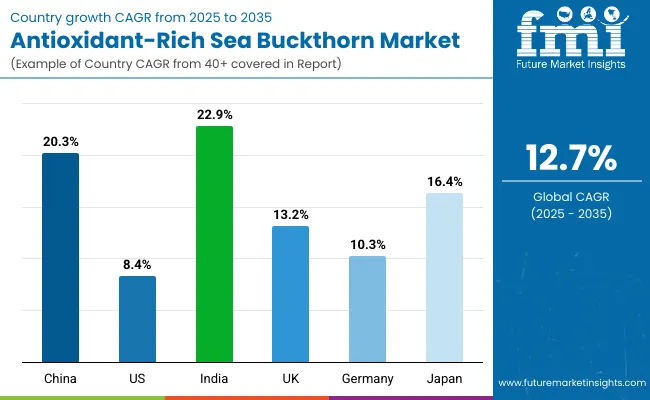
Analysis of Antioxidant-Rich Sea Buckthorn Market By Key Countries

Antioxidant Rich Sea Buckthorn Market By Country

Countries CAGR
China 20.3%
USA 8.4%
India 22.9%
UK 13.2%
Germany 10.3%
Japan 16.4%

The Antioxidant-Rich Sea Buckthorn Market demonstrates varying growth trajectories across major countries, influenced by consumer awareness, herbal traditions, and regulatory frameworks supporting natural health and wellness. Among all markets, India is projected to record the strongest expansion with a CAGR of 22.9%, supported by the integration of plant-based extracts into Ayurveda-inspired products and increasing acceptance in nutraceuticals. China follows closely with a CAGR of 20.3%, where government-backed emphasis on herbal medicine and functional nutrition is expected to position the country as a global hub for supply and consumption.

Japan is forecasted to expand at 16.4% CAGR, reflecting rising demand for anti-aging and preventive healthcare solutions in an aging population, with sea buckthorn gaining attention in both cosmeceuticals and functional foods. The UK, with a CAGR of 13.2%, is anticipated to advance steadily, supported by consumer preference for clean-label beauty and tightening EU-aligned regulations on natural product claims. Germany is projected at 10.3% CAGR, driven by demand for certified organic formulations and trust in sustainability standards. The USA, while showing maturity, is expected to expand at 8.4% CAGR, with growth supported by premium wellness and e-commerce channels rather than traditional retail. These country-level differences highlight both cultural drivers and structural opportunities shaping global market expansion.
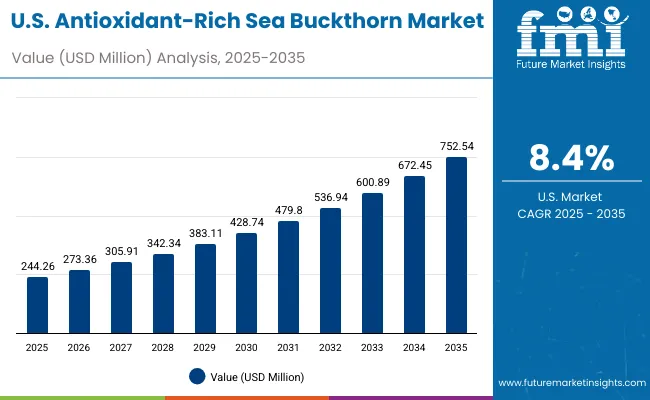
Sales Outlook for Antioxidant-Rich Sea Buckthorn in the United States

Antioxidant Rich Sea Buckthorn Market Usa

Year USA Antioxidant-Rich Sea Buckthorn Market (USD Million)
2025 244.26
2026 273.36
2027 305.91
2028 342.34
2029 383.11
2030 428.74
2031 479.80
2032 536.94
2033 600.89
2034 672.45
2035 752.54

The Antioxidant-Rich Sea Buckthorn Market in the United States is projected to grow at a CAGR of 8.4% between 2025 and 2035, reflecting steady but mature expansion. Market size is expected to increase from USD 244.26 million in 2025 to USD 752.54 million by 2035, underpinned by the rising adoption of botanical antioxidants in both preventive healthcare and premium skincare. Anti-aging applications are anticipated to lead growth, as clinically validated bioactive compounds strengthen consumer trust and enhance the positioning of sea buckthorn in nutricosmetics. Expansion of e-commerce channels and direct-to-consumer strategies is expected to accelerate accessibility, while regulatory oversight on clean-label certifications will reinforce credibility. By the end of the forecast period, the United States is likely to remain a stable yet innovation-driven market, where differentiation will be secured through premium formulations and transparent sourcing practices.

  • Nutricosmetics and anti-aging skincare are expected to remain the leading growth avenues.
  • Regulatory focus on certification and digital distribution is anticipated to enhance consumer confidence and sustain premium adoption.

Growth and Expansion Outlook for Antioxidant-Rich Sea Buckthorn Market in the United Kingdom

The Antioxidant-Rich Sea Buckthorn Market in the UK is projected to expand at a CAGR of 13.2% during 2025-2035. Growth is expected to be anchored in premium skincare and nutricosmetics, where efficacy substantiation, ingredient transparency, and sustainability credentials shape brand selection. Adoption is anticipated to be reinforced by pharmacy and specialty beauty retailers, with clean-label and sensitive-skin propositions gaining traction. Regulatory scrutiny of cosmetic claims is expected to favor clinically supported antioxidant messaging, while recyclable packaging and ethical sourcing are likely to influence retention. Digital channels are projected to complement brick-and-mortar, enabling subscription models and targeted education.

  • Anti-aging and barrier-support use cases are expected to remain category anchors.
  • Pharmacies and specialty retailers are projected to drive credibility and trial.
  • COSMOS/ECOCERT alignment and UKCA compliance are expected to guide listings.
  • E-commerce subscriptions and content-led education are anticipated to lift repeat rates.

Growth and Expansion Outlook for Antioxidant-Rich Sea Buckthorn Market in India

The Antioxidant-Rich Sea Buckthorn Market in India is projected to grow at a CAGR of 22.9% through 2035. Momentum is anticipated to stem from Ayurveda-aligned positioning, vegan certifications, and affordability-to-premium ladders that widen access. Nutricosmetics are expected to scale via pharmacies and modern trade, while D2C brands leverage social commerce for discovery and conversion. UV-care adjacency and after-sun repair narratives are projected to support season-agnostic demand. Regulatory clarity in nutraceutical labeling and claims is expected to reward evidence-backed formulations. Select domestic sourcing initiatives and import partnerships are likely to stabilize availability.

  • Ayurveda-compatible claims and vegan certification are expected to underpin trust.
  • Pharmacies, modern trade, and D2C are projected to operate as complementary routes.
  • Gummies/capsules and serum formats are anticipated to expand usage occasions.
  • Sourcing diversification is expected to mitigate cost and supply variability.

Sales Outlook for Antioxidant-Rich Sea Buckthorn in China

The Antioxidant-Rich Sea Buckthorn Market in China is projected to advance at a CAGR of 20.3% during 2025-2035. Scale is expected to be supported by integration into functional beauty and TCM-inspired wellness, framed with modern clinical evidence. Compliance with CSAR requirements is anticipated to favor brands investing in safety and efficacy dossiers. Social commerce and cross-border e-commerce are projected to accelerate penetration, while premium packaging and gifting occasions elevate value realization. Domestic extraction capabilities and quality standardization are expected to strengthen supply reliability.
  • CSAR-aligned efficacy documentation is expected to shape portfolio approvals.
  • Cross-border and social commerce are projected to compress adoption cycles.
  • TCM heritage reframed with clinical substantiation is anticipated to guide messaging.
  • Advanced extraction and QA protocols are expected to reinforce consistency.

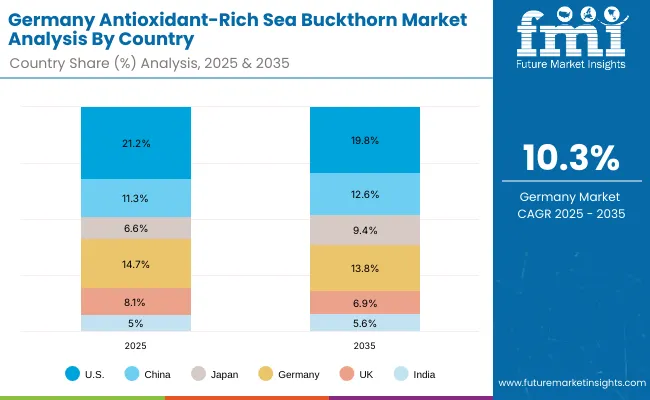
In-depth Analysis of Antioxidant-Rich Sea Buckthorn in Germany

Antioxidant Rich Sea Buckthorn Market Germany

Countries 2025
USA 21.2%
China 11.3%
Japan 6.6%
Germany 14.7%
UK 8.1%
India 5.0%
Countries 2035
USA 19.8%
China 12.6%
Japan 9.4%
Germany 13.8%
UK 6.9%
India 5.6%

The Antioxidant-Rich Sea Buckthorn Market in Germany is projected to expand at a CAGR of 10.3% through 2035. Adoption is expected to be guided by certified-organic credentials, life-cycle transparency, and conservative claim standards. Apothecary and drugstore channels are anticipated to anchor credibility, while naturkost and reform-oriented retailers broaden access. Packaging recyclability, traceable sourcing, and audited supply chains are projected to influence listing decisions. Private-label participation is expected to intensify price discipline, rewarding differentiated efficacy and clear label communication.
  • COSMOS/ECOCERT and Bio standards are expected to remain decisive for listings.
  • Apothecaries and drugstores are projected to drive trusted trial and repeat.
  • LCA-driven packaging and supply-chain transparency are anticipated to affect shelf space.
  • Private label competition is expected to reward clinically substantiated differentiation.

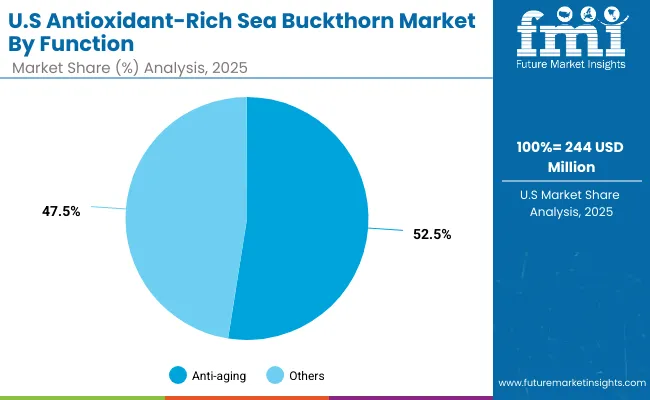
Growth Outlook for Antioxidant-Rich Sea Buckthorn Market in USA

Antioxidant Rich Sea Buckthorn Market Usa 2

Segment Market Value Share, 2025
Anti-aging 52.5%
Others 47.5%

The Antioxidant-Rich Sea Buckthorn Market in the United States is projected at USD 244 million in 2025, with anti-aging functions contributing USD 128 million (52.5%) and other uses accounting for USD 116 million (47.5%). The dominance of anti-aging is being reinforced by heightened consumer awareness of preventive wellness and the demand for natural solutions that support longevity. This segment is expected to retain leadership due to clinical validation of bioactive compounds, which continues to strengthen trust in premium offerings. Other functional uses, though smaller in scale, are projected to provide incremental growth, particularly in hydration and barrier support formulations. With regulatory focus on transparency and growing e-commerce penetration, the USA market is anticipated to maintain steady momentum, where premium anti-aging applications anchor overall expansion.
  • Market in the USA is valued at USD 244 million in 2025
  • Anti-aging accounts for 52.5% of total functional revenue
  • Clinical validation and preventive wellness are shaping dominant adoption
  • Niche opportunities exist in hydration and skin barrier care

Opportunity Analysis of China Antioxidant-Rich Sea Buckthorn Market

Antioxidant Rich Sea Buckthorn Market China

Segment Market Value Share, 2025
Serums & concentrates 48.5%
Others 51.5%

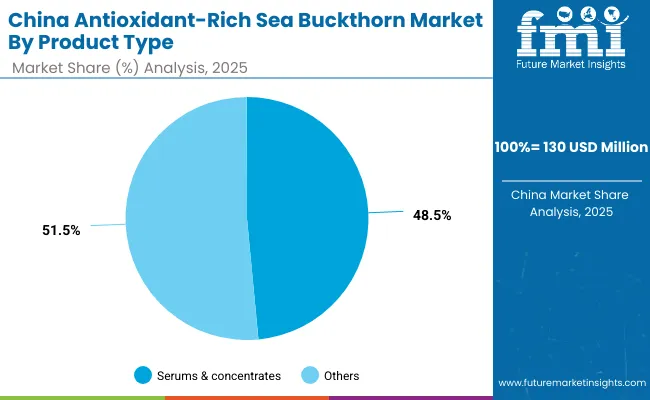
The Antioxidant-Rich Sea Buckthorn Market in China is projected at USD 130 million in 2025, with serums and concentrates contributing USD 63 million (48.5%) and other product types generating USD 67.12 million (51.5%). The close balance between both categories reflects how premium skincare and broader applications are evolving simultaneously. Serums and concentrates are anticipated to expand rapidly, supported by demand for high-efficacy formulations that deliver visible results and align with premium beauty positioning. Other categories, while slightly larger in share, are expected to benefit from affordability and adoption across mass-market and hybrid skincare-nutrition products. Regulatory alignment with CSAR and growing reliance on certified natural claims are projected to enhance adoption across both segments. By 2035, innovation-led differentiation in serums is expected to define premium leadership, while product diversity across lower-cost categories sustains inclusivity and wider reach.
  • Market in China is valued at USD 130 million in 2025
  • Serums and concentrates contribute 48.5% share with USD 63 million
  • Premium skincare demand is driving concentrated formats
  • Other product categories sustain growth through affordability and accessibility

Competitive Landscape of Antioxidant-Rich Sea Buckthorn Market

Antioxidant Rich Sea Buckthorn Market By Company

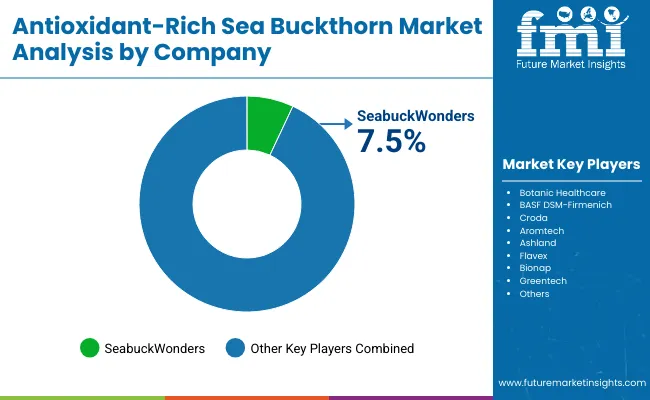
The Antioxidant-Rich Sea Buckthorn Market is moderately fragmented, with global leaders, mid-sized innovators, and specialized providers competing across functional nutrition, cosmetics, and wellness categories. SeabuckWonders is recognized as the leading company, holding a global market share of 7.5% in 2024, supported by its strong USA presence and well-established brand positioning in nutraceuticals and skincare. Its competitive edge is derived from vertically integrated sourcing and consumer trust in product authenticity.

Global players such as BASF, DSM-Firmenich, and Croda are actively engaged in ingredient innovation, leveraging their expertise in bioactives and sustainable formulations. These companies are expected to integrate sea buckthorn within broader botanical portfolios, emphasizing clinical substantiation, scalability, and B2B partnerships. Mid-sized firms including Botanic Healthcare, Aromtech, and Flavex are projected to expand by focusing on niche positioning in plant-based extracts and offering flexibility to regional brands. Specialists such as Bionap, Ashland, and Greentech are anticipated to reinforce competitiveness through eco-certified sourcing, customization, and targeted formulations for premium cosmetics and wellness applications.

Competitive differentiation is shifting toward sustainability credentials, organic certifications, and transparency in supply chains. Future success is expected to be defined less by raw ingredient supply and more by integrated ecosystems that combine science-backed claims, digital distribution, and brand storytelling.

Key Developments in Antioxidant-Rich Sea Buckthorn Market

  • In January 2025, SeabuckWonders introduced a line of functional beverages enhanced with standardized sea buckthorn extracts rich in antioxidants. This innovation was driven by consumer demand for fortified, ready-to-drink formats. Credibility was enhanced through third-party testing of vitamin and flavonoid content, reinforcing brand position in clean-label nutrition.
  • In June 2025, BASF unveiled an organic-certified sea buckthorn oil specially standardized for cosmeceutical use. This was aligned with EU COSMOS ingredient standards and supported by efficacy data in anti-aging assays. The launch was designed to meet rising formulation demands from premium skincare producers seeking clean-certified botanical actives.

Scope of the Report

Item Value
Quantitative Units USD 1,153.1 million in 2025, projected to reach USD 3,800.7 million by 2035
Extract Type Seed oil, Berry oil, Leaf extract, Whole fruit extract, Fermented derivatives
Function Anti-aging & wrinkle prevention, Brightening & pigmentation control, Repair & antioxidant protection, Hydration & barrier support, UV protection & after-sun repair
Product Type Serums & concentrates, Oils & blends, Creams & lotions, Capsules/nutricosmetics, Masks & balms
Claim Organic-certified, Vegan-certified, Traditional herbal, Clean-label, COSMOS/ECOCERT
End-use Industry Skincare & personal care, Nutraceuticals & dietary supplements, Functional foods & beverages, Pharmaceuticals, Professional spas, E-commerce and specialty retail channels
Regions Covered North America, Europe, Asia-Pacific, Latin America, Middle East & Africa
Countries Covered United States, Canada, Germany, France, United Kingdom, China, Japan, India, Brazil, South Korea, Italy
Key Companies Profiled SeabuckWonders, Botanic Healthcare, BASF, DSM-Firmenich, Croda, Aromtech, Ashland, Flavex, Bionap, Greentech
Additional Attributes Dollar sales by extract type and function, adoption trends in clean-label skincare and nutraceuticals, premium positioning of serums and nutricosmetics, strong growth in Asia-Pacific led by India and China, regulatory influence of COSMOS/ECOCERT certifications, expansion of e-commerce and D2C, scientific validation driving consumer trust, and sustainability-focused sourcing strategies.

Key Segments

By Extract Type:

  • Seed oil
  • Berry oil
  • Leaf extract
  • Whole fruit extract
  • Fermented derivatives
  • Function
  • Anti-aging & wrinkle prevention
  • Brightening & pigmentation control
  • Repair & antioxidant protection
  • Hydration & barrier support
    • Serums & concentrates
    • Oils & blends
    • Creams & lotions
    • Capsules/nutricosmetics
  • UV protection & after-sun repair
  • Product Type

By Masks & balms:

  • Channel
  • E-commerce
  • Pharmacies
  • Natural/organic stores
  • Specialty beauty retailers

By Mass retail:

  • Professional spas
  • Claim
  • Organic-certified

By Vegan-certified:

  • Traditional herbal
  • Clean-label
  • COSMOS/ECOCERT
  • End User

By Anti-aging (35+):

  • Sensitive skin
  • Haircare crossover

By Region:

  • North America
  • Latin America
  • Europe
  • East Asia
  • South Asia & Pacific
  • Middle East and Africa

Table of Content

  1. Executive Summary
    • Global Market Outlook
    • Demand-side Trends
    • Supply-side Trends
    • Technology Roadmap Analysis
    • Analysis and Recommendations
  2. Market Overview
    • Market Coverage / Taxonomy
    • Market Definition / Scope / Limitations
  3. Market Background
    • Market Dynamics
      • Drivers
      • Restraints
      • Opportunity
      • Trends
    • Scenario Forecast
      • Demand in Optimistic Scenario
      • Demand in Likely Scenario
      • Demand in Conservative Scenario
    • Opportunity Map Analysis
    • Product Life Cycle Analysis
    • Supply Chain Analysis
      • Supply Side Participants and their Roles
        • Producers
        • Mid-Level Participants (Traders/ Agents/ Brokers)
        • Wholesalers and Distributors
      • Value Added and Value Created at Node in the Supply Chain
      • List of Raw Material Suppliers
      • List of Existing and Potential Buyer’s
    • Investment Feasibility Matrix
    • Value Chain Analysis
      • Profit Margin Analysis
      • Wholesalers and Distributors
      • Retailers
    • PESTLE and Porter’s Analysis
    • Regulatory Landscape
      • By Key Regions
      • By Key Countries
    • Regional Parent Market Outlook
    • Production and Consumption Statistics
    • Import and Export Statistics
  4. Global Market Analysis 2020 to 2024 and Forecast, 2025 to 2035
    • Historical Market Size Value (USD Million) & Volume (Units) Analysis, 2020 to 2024
    • Current and Future Market Size Value (USD Million) & Volume (Units) Projections, 2025 to 2035
      • Y-o-Y Growth Trend Analysis
      • Absolute $ Opportunity Analysis
  5. Global Market Analysis 2020 to 2024 and Forecast 2025 to 2035, By Extract Type
    • Introduction / Key Findings
    • Historical Market Size Value (USD Million) & Volume (Units) Analysis By Extract Type, 2020 to 2024
    • Current and Future Market Size Value (USD Million) & Volume (Units) Analysis and Forecast By Extract Type, 2025 to 2035
      • Seed oil
      • Berry oil
      • Leaf extract
      • Whole fruit extract
      • Fermented derivatives
      • Function
      • Anti-aging & wrinkle prevention
      • Brightening & pigmentation control
      • Repair & antioxidant protection
      • Hydration & barrier support
        • Serums & concentrates
        • Oils & blends
        • Creams & lotions
        • Capsules/nutricosmetics
      • UV protection & after-sun repair
      • Product Type
    • Y-o-Y Growth Trend Analysis By Extract Type, 2020 to 2024
    • Absolute $ Opportunity Analysis By Extract Type, 2025 to 2035
  6. Global Market Analysis 2020 to 2024 and Forecast 2025 to 2035, By Masks & balms
    • Introduction / Key Findings
    • Historical Market Size Value (USD Million) & Volume (Units) Analysis By Masks & balms, 2020 to 2024
    • Current and Future Market Size Value (USD Million) & Volume (Units) Analysis and Forecast By Masks & balms, 2025 to 2035
      • Channel
      • E-commerce
      • Pharmacies
      • Natural/organic stores
      • Specialty beauty retailers
    • Y-o-Y Growth Trend Analysis By Masks & balms, 2020 to 2024
    • Absolute $ Opportunity Analysis By Masks & balms, 2025 to 2035
  7. Global Market Analysis 2020 to 2024 and Forecast 2025 to 2035, By Mass retail
    • Introduction / Key Findings
    • Historical Market Size Value (USD Million) & Volume (Units) Analysis By Mass retail, 2020 to 2024
    • Current and Future Market Size Value (USD Million) & Volume (Units) Analysis and Forecast By Mass retail, 2025 to 2035
      • Professional spas
      • Claim
      • Organic-certified
    • Y-o-Y Growth Trend Analysis By Mass retail, 2020 to 2024
    • Absolute $ Opportunity Analysis By Mass retail, 2025 to 2035
  8. Global Market Analysis 2020 to 2024 and Forecast 2025 to 2035, By Vegan-certified
    • Introduction / Key Findings
    • Historical Market Size Value (USD Million) & Volume (Units) Analysis By Vegan-certified, 2020 to 2024
    • Current and Future Market Size Value (USD Million) & Volume (Units) Analysis and Forecast By Vegan-certified, 2025 to 2035
      • Traditional herbal
      • Clean-label
      • COSMOS/ECOCERT
      • End User
    • Y-o-Y Growth Trend Analysis By Vegan-certified, 2020 to 2024
    • Absolute $ Opportunity Analysis By Vegan-certified, 2025 to 2035
  9. Global Market Analysis 2020 to 2024 and Forecast 2025 to 2035, By Anti-aging (35+)
    • Introduction / Key Findings
    • Historical Market Size Value (USD Million) & Volume (Units) Analysis By Anti-aging (35+), 2020 to 2024
    • Current and Future Market Size Value (USD Million) & Volume (Units) Analysis and Forecast By Anti-aging (35+), 2025 to 2035
      • Sensitive skin
      • Haircare crossover
    • Y-o-Y Growth Trend Analysis By Anti-aging (35+), 2020 to 2024
    • Absolute $ Opportunity Analysis By Anti-aging (35+), 2025 to 2035
  10. Global Market Analysis 2020 to 2024 and Forecast 2025 to 2035, By Region
    • Introduction
    • Historical Market Size Value (USD Million) & Volume (Units) Analysis By Region, 2020 to 2024
    • Current Market Size Value (USD Million) & Volume (Units) Analysis and Forecast By Region, 2025 to 2035
      • North America
      • Latin America
      • Europe
      • East Asia
      • South Asia & Pacific
      • Middle East and Africa
    • Market Attractiveness Analysis By Region
  11. North America Market Analysis 2020 to 2024 and Forecast 2025 to 2035, By Country
    • Historical Market Size Value (USD Million) & Volume (Units) Trend Analysis By Market Taxonomy, 2020 to 2024
    • Market Size Value (USD Million) & Volume (Units) Forecast By Market Taxonomy, 2025 to 2035
      • By Country
        • USA
        • Canada
      • By Extract Type
      • By Masks & balms
      • By Mass retail
      • By Vegan-certified
      • By Anti-aging (35+)
    • Market Attractiveness Analysis
      • By Country
      • By Extract Type
      • By Masks & balms
      • By Mass retail
      • By Vegan-certified
      • By Anti-aging (35+)
    • Key Takeaways
  12. Latin America Market Analysis 2020 to 2024 and Forecast 2025 to 2035, By Country
    • Historical Market Size Value (USD Million) & Volume (Units) Trend Analysis By Market Taxonomy, 2020 to 2024
    • Market Size Value (USD Million) & Volume (Units) Forecast By Market Taxonomy, 2025 to 2035
      • By Country
        • Brazil
        • Mexico
        • Colombia
        • Rest of Latin America
      • By Extract Type
      • By Masks & balms
      • By Mass retail
      • By Vegan-certified
      • By Anti-aging (35+)
    • Market Attractiveness Analysis
      • By Country
      • By Extract Type
      • By Masks & balms
      • By Mass retail
      • By Vegan-certified
      • By Anti-aging (35+)
    • Key Takeaways
  13. Europe Market Analysis 2020 to 2024 and Forecast 2025 to 2035, By Country
    • Historical Market Size Value (USD Million) & Volume (Units) Trend Analysis By Market Taxonomy, 2020 to 2024
    • Market Size Value (USD Million) & Volume (Units) Forecast By Market Taxonomy, 2025 to 2035
      • By Country
        • Germany
        • UK
        • France
        • Italy
        • Spain
        • Belgium
        • Netherlands
        • Nordic
        • Switzerland
        • Russia
        • Poland
        • Rest of Europe
      • By Extract Type
      • By Masks & balms
      • By Mass retail
      • By Vegan-certified
      • By Anti-aging (35+)
    • Market Attractiveness Analysis
      • By Country
      • By Extract Type
      • By Masks & balms
      • By Mass retail
      • By Vegan-certified
      • By Anti-aging (35+)
    • Key Takeaways
  14. East Asia Market Analysis 2020 to 2024 and Forecast 2025 to 2035, By Country
    • Historical Market Size Value (USD Million) & Volume (Units) Trend Analysis By Market Taxonomy, 2020 to 2024
    • Market Size Value (USD Million) & Volume (Units) Forecast By Market Taxonomy, 2025 to 2035
      • By Country
        • China
        • Japan
        • South Korea
      • By Extract Type
      • By Masks & balms
      • By Mass retail
      • By Vegan-certified
      • By Anti-aging (35+)
    • Market Attractiveness Analysis
      • By Country
      • By Extract Type
      • By Masks & balms
      • By Mass retail
      • By Vegan-certified
      • By Anti-aging (35+)
    • Key Takeaways
  15. South Asia & Pacific Market Analysis 2020 to 2024 and Forecast 2025 to 2035, By Country
    • Historical Market Size Value (USD Million) & Volume (Units) Trend Analysis By Market Taxonomy, 2020 to 2024
    • Market Size Value (USD Million) & Volume (Units) Forecast By Market Taxonomy, 2025 to 2035
      • By Country
        • India
        • Thailand
        • Malaysia
        • Indonesia
        • Singapore
        • Vietnam
        • Australia
        • New Zealand
        • Rest of South Asia
      • By Extract Type
      • By Masks & balms
      • By Mass retail
      • By Vegan-certified
      • By Anti-aging (35+)
    • Market Attractiveness Analysis
      • By Country
      • By Extract Type
      • By Masks & balms
      • By Mass retail
      • By Vegan-certified
      • By Anti-aging (35+)
    • Key Takeaways
  16. Middle East and Africa Market Analysis 2020 to 2024 and Forecast 2025 to 2035, By Country
    • Historical Market Size Value (USD Million) & Volume (Units) Trend Analysis By Market Taxonomy, 2020 to 2024
    • Market Size Value (USD Million) & Volume (Units) Forecast By Market Taxonomy, 2025 to 2035
      • By Country
        • Turkey
        • UAE
        • Saudi Arabia
        • Israel
        • Other GCC Countries
        • North Africa
        • South Africa
      • By Extract Type
      • By Masks & balms
      • By Mass retail
      • By Vegan-certified
      • By Anti-aging (35+)
    • Market Attractiveness Analysis
      • By Country
      • By Extract Type
      • By Masks & balms
      • By Mass retail
      • By Vegan-certified
      • By Anti-aging (35+)
    • Key Takeaways
  17. Key Countries Market Analysis
    • USA
      • Pricing Analysis
      • Market Share Analysis, 2024
        • By Extract Type
        • By Masks & balms
        • By Mass retail
        • By Vegan-certified
        • By Anti-aging (35+)
    • Canada
      • Pricing Analysis
      • Market Share Analysis, 2024
        • By Extract Type
        • By Masks & balms
        • By Mass retail
        • By Vegan-certified
        • By Anti-aging (35+)
    • Brazil
      • Pricing Analysis
      • Market Share Analysis, 2024
        • By Extract Type
        • By Masks & balms
        • By Mass retail
        • By Vegan-certified
        • By Anti-aging (35+)
    • Mexico
      • Pricing Analysis
      • Market Share Analysis, 2024
        • By Extract Type
        • By Masks & balms
        • By Mass retail
        • By Vegan-certified
        • By Anti-aging (35+)
    • Colombia
      • Pricing Analysis
      • Market Share Analysis, 2024
        • By Extract Type
        • By Masks & balms
        • By Mass retail
        • By Vegan-certified
        • By Anti-aging (35+)
    • Germany
      • Pricing Analysis
      • Market Share Analysis, 2024
        • By Extract Type
        • By Masks & balms
        • By Mass retail
        • By Vegan-certified
        • By Anti-aging (35+)
    • UK
      • Pricing Analysis
      • Market Share Analysis, 2024
        • By Extract Type
        • By Masks & balms
        • By Mass retail
        • By Vegan-certified
        • By Anti-aging (35+)
    • France
      • Pricing Analysis
      • Market Share Analysis, 2024
        • By Extract Type
        • By Masks & balms
        • By Mass retail
        • By Vegan-certified
        • By Anti-aging (35+)
    • Italy
      • Pricing Analysis
      • Market Share Analysis, 2024
        • By Extract Type
        • By Masks & balms
        • By Mass retail
        • By Vegan-certified
        • By Anti-aging (35+)
    • Spain
      • Pricing Analysis
      • Market Share Analysis, 2024
        • By Extract Type
        • By Masks & balms
        • By Mass retail
        • By Vegan-certified
        • By Anti-aging (35+)
    • Belgium
      • Pricing Analysis
      • Market Share Analysis, 2024
        • By Extract Type
        • By Masks & balms
        • By Mass retail
        • By Vegan-certified
        • By Anti-aging (35+)
    • Netherlands
      • Pricing Analysis
      • Market Share Analysis, 2024
        • By Extract Type
        • By Masks & balms
        • By Mass retail
        • By Vegan-certified
        • By Anti-aging (35+)
    • Nordic
      • Pricing Analysis
      • Market Share Analysis, 2024
        • By Extract Type
        • By Masks & balms
        • By Mass retail
        • By Vegan-certified
        • By Anti-aging (35+)
    • Switzerland
      • Pricing Analysis
      • Market Share Analysis, 2024
        • By Extract Type
        • By Masks & balms
        • By Mass retail
        • By Vegan-certified
        • By Anti-aging (35+)
    • Russia
      • Pricing Analysis
      • Market Share Analysis, 2024
        • By Extract Type
        • By Masks & balms
        • By Mass retail
        • By Vegan-certified
        • By Anti-aging (35+)
    • Poland
      • Pricing Analysis
      • Market Share Analysis, 2024
        • By Extract Type
        • By Masks & balms
        • By Mass retail
        • By Vegan-certified
        • By Anti-aging (35+)
    • China
      • Pricing Analysis
      • Market Share Analysis, 2024
        • By Extract Type
        • By Masks & balms
        • By Mass retail
        • By Vegan-certified
        • By Anti-aging (35+)
    • Japan
      • Pricing Analysis
      • Market Share Analysis, 2024
        • By Extract Type
        • By Masks & balms
        • By Mass retail
        • By Vegan-certified
        • By Anti-aging (35+)
    • South Korea
      • Pricing Analysis
      • Market Share Analysis, 2024
        • By Extract Type
        • By Masks & balms
        • By Mass retail
        • By Vegan-certified
        • By Anti-aging (35+)
    • India
      • Pricing Analysis
      • Market Share Analysis, 2024
        • By Extract Type
        • By Masks & balms
        • By Mass retail
        • By Vegan-certified
        • By Anti-aging (35+)
    • Thailand
      • Pricing Analysis
      • Market Share Analysis, 2024
        • By Extract Type
        • By Masks & balms
        • By Mass retail
        • By Vegan-certified
        • By Anti-aging (35+)
    • Indonesia
      • Pricing Analysis
      • Market Share Analysis, 2024
        • By Extract Type
        • By Masks & balms
        • By Mass retail
        • By Vegan-certified
        • By Anti-aging (35+)
    • Australia
      • Pricing Analysis
      • Market Share Analysis, 2024
        • By Extract Type
        • By Masks & balms
        • By Mass retail
        • By Vegan-certified
        • By Anti-aging (35+)
    • New Zealand
      • Pricing Analysis
      • Market Share Analysis, 2024
        • By Extract Type
        • By Masks & balms
        • By Mass retail
        • By Vegan-certified
        • By Anti-aging (35+)
    • Turkey
      • Pricing Analysis
      • Market Share Analysis, 2024
        • By Extract Type
        • By Masks & balms
        • By Mass retail
        • By Vegan-certified
        • By Anti-aging (35+)
    • UAE
      • Pricing Analysis
      • Market Share Analysis, 2024
        • By Extract Type
        • By Masks & balms
        • By Mass retail
        • By Vegan-certified
        • By Anti-aging (35+)
    • Saudi Arabia
      • Pricing Analysis
      • Market Share Analysis, 2024
        • By Extract Type
        • By Masks & balms
        • By Mass retail
        • By Vegan-certified
        • By Anti-aging (35+)
    • Israel
      • Pricing Analysis
      • Market Share Analysis, 2024
        • By Extract Type
        • By Masks & balms
        • By Mass retail
        • By Vegan-certified
        • By Anti-aging (35+)
    • North Africa
      • Pricing Analysis
      • Market Share Analysis, 2024
        • By Extract Type
        • By Masks & balms
        • By Mass retail
        • By Vegan-certified
        • By Anti-aging (35+)
    • South Africa
      • Pricing Analysis
      • Market Share Analysis, 2024
        • By Extract Type
        • By Masks & balms
        • By Mass retail
        • By Vegan-certified
        • By Anti-aging (35+)
  18. Market Structure Analysis
    • Competition Dashboard
    • Competition Benchmarking
    • Market Share Analysis of Top Players
      • By Regional
      • By Extract Type
      • By Masks & balms
      • By Mass retail
      • By Vegan-certified
      • By Anti-aging (35+)
  19. Competition Analysis
    • Competition Deep Dive
      • SeabuckWonders
        • Overview
        • Product Portfolio
        • Profitability by Market Segments (Product/Age /Sales Channel/Region)
        • Sales Footprint
        • Strategy Overview
          • Marketing Strategy
          • Product Strategy
          • Channel Strategy
      • Botanic Healthcare
        • Overview
        • Product Portfolio
        • Profitability by Market Segments (Product/Age /Sales Channel/Region)
        • Sales Footprint
        • Strategy Overview
          • Marketing Strategy
          • Product Strategy
          • Channel Strategy
      • BASF
        • Overview
        • Product Portfolio
        • Profitability by Market Segments (Product/Age /Sales Channel/Region)
        • Sales Footprint
        • Strategy Overview
          • Marketing Strategy
          • Product Strategy
          • Channel Strategy
      • DSM-Firmenich
        • Overview
        • Product Portfolio
        • Profitability by Market Segments (Product/Age /Sales Channel/Region)
        • Sales Footprint
        • Strategy Overview
          • Marketing Strategy
          • Product Strategy
          • Channel Strategy
      • Croda
        • Overview
        • Product Portfolio
        • Profitability by Market Segments (Product/Age /Sales Channel/Region)
        • Sales Footprint
        • Strategy Overview
          • Marketing Strategy
          • Product Strategy
          • Channel Strategy
      • Aromtech
        • Overview
        • Product Portfolio
        • Profitability by Market Segments (Product/Age /Sales Channel/Region)
        • Sales Footprint
        • Strategy Overview
          • Marketing Strategy
          • Product Strategy
          • Channel Strategy
      • Ashland
        • Overview
        • Product Portfolio
        • Profitability by Market Segments (Product/Age /Sales Channel/Region)
        • Sales Footprint
        • Strategy Overview
          • Marketing Strategy
          • Product Strategy
          • Channel Strategy
      • Flavex
        • Overview
        • Product Portfolio
        • Profitability by Market Segments (Product/Age /Sales Channel/Region)
        • Sales Footprint
        • Strategy Overview
          • Marketing Strategy
          • Product Strategy
          • Channel Strategy
      • Bionap
        • Overview
        • Product Portfolio
        • Profitability by Market Segments (Product/Age /Sales Channel/Region)
        • Sales Footprint
        • Strategy Overview
          • Marketing Strategy
          • Product Strategy
          • Channel Strategy
      • Greentech
        • Overview
        • Product Portfolio
        • Profitability by Market Segments (Product/Age /Sales Channel/Region)
        • Sales Footprint
        • Strategy Overview
          • Marketing Strategy
          • Product Strategy
          • Channel Strategy
      • Others
        • Overview
        • Product Portfolio
        • Profitability by Market Segments (Product/Age /Sales Channel/Region)
        • Sales Footprint
        • Strategy Overview
          • Marketing Strategy
          • Product Strategy
          • Channel Strategy
  20. Assumptions & Acronyms Used
  21. Research Methodology

List of Tables

  • Table 1: Global Market Value (USD Million) Forecast by Region, 2020-2035
  • Table 2: Global Market Volume (Units) Forecast by Region, 2020-2035
  • Table 3: Global Market Value (USD Million) Forecast by Extract Type, 2020-2035
  • Table 4: Global Market Volume (Units) Forecast by Extract Type, 2020-2035
  • Table 5: Global Market Value (USD Million) Forecast by Masks & balms, 2020-2035
  • Table 6: Global Market Volume (Units) Forecast by Masks & balms, 2020-2035
  • Table 7: Global Market Value (USD Million) Forecast by Mass retail, 2020-2035
  • Table 8: Global Market Volume (Units) Forecast by Mass retail, 2020-2035
  • Table 9: Global Market Value (USD Million) Forecast by Vegan-certified, 2020-2035
  • Table 10: Global Market Volume (Units) Forecast by Vegan-certified, 2020-2035
  • Table 11: Global Market Value (USD Million) Forecast by Anti-aging (35+), 2020-2035
  • Table 12: Global Market Volume (Units) Forecast by Anti-aging (35+), 2020-2035
  • Table 13: North America Market Value (USD Million) Forecast by Country, 2020-2035
  • Table 14: North America Market Volume (Units) Forecast by Country, 2020-2035
  • Table 15: North America Market Value (USD Million) Forecast by Extract Type, 2020-2035
  • Table 16: North America Market Volume (Units) Forecast by Extract Type, 2020-2035
  • Table 17: North America Market Value (USD Million) Forecast by Masks & balms, 2020-2035
  • Table 18: North America Market Volume (Units) Forecast by Masks & balms, 2020-2035
  • Table 19: North America Market Value (USD Million) Forecast by Mass retail, 2020-2035
  • Table 20: North America Market Volume (Units) Forecast by Mass retail, 2020-2035
  • Table 21: North America Market Value (USD Million) Forecast by Vegan-certified, 2020-2035
  • Table 22: North America Market Volume (Units) Forecast by Vegan-certified, 2020-2035
  • Table 23: North America Market Value (USD Million) Forecast by Anti-aging (35+), 2020-2035
  • Table 24: North America Market Volume (Units) Forecast by Anti-aging (35+), 2020-2035
  • Table 25: Latin America Market Value (USD Million) Forecast by Country, 2020-2035
  • Table 26: Latin America Market Volume (Units) Forecast by Country, 2020-2035
  • Table 27: Latin America Market Value (USD Million) Forecast by Extract Type, 2020-2035
  • Table 28: Latin America Market Volume (Units) Forecast by Extract Type, 2020-2035
  • Table 29: Latin America Market Value (USD Million) Forecast by Masks & balms, 2020-2035
  • Table 30: Latin America Market Volume (Units) Forecast by Masks & balms, 2020-2035
  • Table 31: Latin America Market Value (USD Million) Forecast by Mass retail, 2020-2035
  • Table 32: Latin America Market Volume (Units) Forecast by Mass retail, 2020-2035
  • Table 33: Latin America Market Value (USD Million) Forecast by Vegan-certified, 2020-2035
  • Table 34: Latin America Market Volume (Units) Forecast by Vegan-certified, 2020-2035
  • Table 35: Latin America Market Value (USD Million) Forecast by Anti-aging (35+), 2020-2035
  • Table 36: Latin America Market Volume (Units) Forecast by Anti-aging (35+), 2020-2035
  • Table 37: Europe Market Value (USD Million) Forecast by Country, 2020-2035
  • Table 38: Europe Market Volume (Units) Forecast by Country, 2020-2035
  • Table 39: Europe Market Value (USD Million) Forecast by Extract Type, 2020-2035
  • Table 40: Europe Market Volume (Units) Forecast by Extract Type, 2020-2035
  • Table 41: Europe Market Value (USD Million) Forecast by Masks & balms, 2020-2035
  • Table 42: Europe Market Volume (Units) Forecast by Masks & balms, 2020-2035
  • Table 43: Europe Market Value (USD Million) Forecast by Mass retail, 2020-2035
  • Table 44: Europe Market Volume (Units) Forecast by Mass retail, 2020-2035
  • Table 45: Europe Market Value (USD Million) Forecast by Vegan-certified, 2020-2035
  • Table 46: Europe Market Volume (Units) Forecast by Vegan-certified, 2020-2035
  • Table 47: Europe Market Value (USD Million) Forecast by Anti-aging (35+), 2020-2035
  • Table 48: Europe Market Volume (Units) Forecast by Anti-aging (35+), 2020-2035
  • Table 49: East Asia Market Value (USD Million) Forecast by Country, 2020-2035
  • Table 50: East Asia Market Volume (Units) Forecast by Country, 2020-2035
  • Table 51: East Asia Market Value (USD Million) Forecast by Extract Type, 2020-2035
  • Table 52: East Asia Market Volume (Units) Forecast by Extract Type, 2020-2035
  • Table 53: East Asia Market Value (USD Million) Forecast by Masks & balms, 2020-2035
  • Table 54: East Asia Market Volume (Units) Forecast by Masks & balms, 2020-2035
  • Table 55: East Asia Market Value (USD Million) Forecast by Mass retail, 2020-2035
  • Table 56: East Asia Market Volume (Units) Forecast by Mass retail, 2020-2035
  • Table 57: East Asia Market Value (USD Million) Forecast by Vegan-certified, 2020-2035
  • Table 58: East Asia Market Volume (Units) Forecast by Vegan-certified, 2020-2035
  • Table 59: East Asia Market Value (USD Million) Forecast by Anti-aging (35+), 2020-2035
  • Table 60: East Asia Market Volume (Units) Forecast by Anti-aging (35+), 2020-2035
  • Table 61: South Asia & Pacific Market Value (USD Million) Forecast by Country, 2020-2035
  • Table 62: South Asia & Pacific Market Volume (Units) Forecast by Country, 2020-2035
  • Table 63: South Asia & Pacific Market Value (USD Million) Forecast by Extract Type, 2020-2035
  • Table 64: South Asia & Pacific Market Volume (Units) Forecast by Extract Type, 2020-2035
  • Table 65: South Asia & Pacific Market Value (USD Million) Forecast by Masks & balms, 2020-2035
  • Table 66: South Asia & Pacific Market Volume (Units) Forecast by Masks & balms, 2020-2035
  • Table 67: South Asia & Pacific Market Value (USD Million) Forecast by Mass retail, 2020-2035
  • Table 68: South Asia & Pacific Market Volume (Units) Forecast by Mass retail, 2020-2035
  • Table 69: South Asia & Pacific Market Value (USD Million) Forecast by Vegan-certified, 2020-2035
  • Table 70: South Asia & Pacific Market Volume (Units) Forecast by Vegan-certified, 2020-2035
  • Table 71: South Asia & Pacific Market Value (USD Million) Forecast by Anti-aging (35+), 2020-2035
  • Table 72: South Asia & Pacific Market Volume (Units) Forecast by Anti-aging (35+), 2020-2035
  • Table 73: Middle East and Africa Market Value (USD Million) Forecast by Country, 2020-2035
  • Table 74: Middle East and Africa Market Volume (Units) Forecast by Country, 2020-2035
  • Table 75: Middle East and Africa Market Value (USD Million) Forecast by Extract Type, 2020-2035
  • Table 76: Middle East and Africa Market Volume (Units) Forecast by Extract Type, 2020-2035
  • Table 77: Middle East and Africa Market Value (USD Million) Forecast by Masks & balms, 2020-2035
  • Table 78: Middle East and Africa Market Volume (Units) Forecast by Masks & balms, 2020-2035
  • Table 79: Middle East and Africa Market Value (USD Million) Forecast by Mass retail, 2020-2035
  • Table 80: Middle East and Africa Market Volume (Units) Forecast by Mass retail, 2020-2035
  • Table 81: Middle East and Africa Market Value (USD Million) Forecast by Vegan-certified, 2020-2035
  • Table 82: Middle East and Africa Market Volume (Units) Forecast by Vegan-certified, 2020-2035
  • Table 83: Middle East and Africa Market Value (USD Million) Forecast by Anti-aging (35+), 2020-2035
  • Table 84: Middle East and Africa Market Volume (Units) Forecast by Anti-aging (35+), 2020-2035

List of Figures

  • Figure 1: Global Market Value (USD Million) by Extract Type, 2025-2035
  • Figure 2: Global Market Value (USD Million) by Masks & balms, 2025-2035
  • Figure 3: Global Market Value (USD Million) by Mass retail, 2025-2035
  • Figure 4: Global Market Value (USD Million) by Vegan-certified, 2025-2035
  • Figure 5: Global Market Value (USD Million) by Anti-aging (35+), 2025-2035
  • Figure 6: Global Market Value (USD Million) by Region, 2025-2035
  • Figure 7: Global Market Value (USD Million) Analysis by Region, 2020-2035
  • Figure 8: Global Market Volume (Units) Analysis by Region, 2020-2035
  • Figure 9: Global Market Value Share (%) and BPS Analysis by Region, 2025-2035
  • Figure 10: Global Market Y-o-Y Growth (%) Projections by Region, 2025-2035
  • Figure 11: Global Market Value (USD Million) Analysis by Extract Type, 2020-2035
  • Figure 12: Global Market Volume (Units) Analysis by Extract Type, 2020-2035
  • Figure 13: Global Market Value Share (%) and BPS Analysis by Extract Type, 2025-2035
  • Figure 14: Global Market Y-o-Y Growth (%) Projections by Extract Type, 2025-2035
  • Figure 15: Global Market Value (USD Million) Analysis by Masks & balms, 2020-2035
  • Figure 16: Global Market Volume (Units) Analysis by Masks & balms, 2020-2035
  • Figure 17: Global Market Value Share (%) and BPS Analysis by Masks & balms, 2025-2035
  • Figure 18: Global Market Y-o-Y Growth (%) Projections by Masks & balms, 2025-2035
  • Figure 19: Global Market Value (USD Million) Analysis by Mass retail, 2020-2035
  • Figure 20: Global Market Volume (Units) Analysis by Mass retail, 2020-2035
  • Figure 21: Global Market Value Share (%) and BPS Analysis by Mass retail, 2025-2035
  • Figure 22: Global Market Y-o-Y Growth (%) Projections by Mass retail, 2025-2035
  • Figure 23: Global Market Value (USD Million) Analysis by Vegan-certified, 2020-2035
  • Figure 24: Global Market Volume (Units) Analysis by Vegan-certified, 2020-2035
  • Figure 25: Global Market Value Share (%) and BPS Analysis by Vegan-certified, 2025-2035
  • Figure 26: Global Market Y-o-Y Growth (%) Projections by Vegan-certified, 2025-2035
  • Figure 27: Global Market Value (USD Million) Analysis by Anti-aging (35+), 2020-2035
  • Figure 28: Global Market Volume (Units) Analysis by Anti-aging (35+), 2020-2035
  • Figure 29: Global Market Value Share (%) and BPS Analysis by Anti-aging (35+), 2025-2035
  • Figure 30: Global Market Y-o-Y Growth (%) Projections by Anti-aging (35+), 2025-2035
  • Figure 31: Global Market Attractiveness by Extract Type, 2025-2035
  • Figure 32: Global Market Attractiveness by Masks & balms, 2025-2035
  • Figure 33: Global Market Attractiveness by Mass retail, 2025-2035
  • Figure 34: Global Market Attractiveness by Vegan-certified, 2025-2035
  • Figure 35: Global Market Attractiveness by Anti-aging (35+), 2025-2035
  • Figure 36: Global Market Attractiveness by Region, 2025-2035
  • Figure 37: North America Market Value (USD Million) by Extract Type, 2025-2035
  • Figure 38: North America Market Value (USD Million) by Masks & balms, 2025-2035
  • Figure 39: North America Market Value (USD Million) by Mass retail, 2025-2035
  • Figure 40: North America Market Value (USD Million) by Vegan-certified, 2025-2035
  • Figure 41: North America Market Value (USD Million) by Anti-aging (35+), 2025-2035
  • Figure 42: North America Market Value (USD Million) by Country, 2025-2035
  • Figure 43: North America Market Value (USD Million) Analysis by Country, 2020-2035
  • Figure 44: North America Market Volume (Units) Analysis by Country, 2020-2035
  • Figure 45: North America Market Value Share (%) and BPS Analysis by Country, 2025-2035
  • Figure 46: North America Market Y-o-Y Growth (%) Projections by Country, 2025-2035
  • Figure 47: North America Market Value (USD Million) Analysis by Extract Type, 2020-2035
  • Figure 48: North America Market Volume (Units) Analysis by Extract Type, 2020-2035
  • Figure 49: North America Market Value Share (%) and BPS Analysis by Extract Type, 2025-2035
  • Figure 50: North America Market Y-o-Y Growth (%) Projections by Extract Type, 2025-2035
  • Figure 51: North America Market Value (USD Million) Analysis by Masks & balms, 2020-2035
  • Figure 52: North America Market Volume (Units) Analysis by Masks & balms, 2020-2035
  • Figure 53: North America Market Value Share (%) and BPS Analysis by Masks & balms, 2025-2035
  • Figure 54: North America Market Y-o-Y Growth (%) Projections by Masks & balms, 2025-2035
  • Figure 55: North America Market Value (USD Million) Analysis by Mass retail, 2020-2035
  • Figure 56: North America Market Volume (Units) Analysis by Mass retail, 2020-2035
  • Figure 57: North America Market Value Share (%) and BPS Analysis by Mass retail, 2025-2035
  • Figure 58: North America Market Y-o-Y Growth (%) Projections by Mass retail, 2025-2035
  • Figure 59: North America Market Value (USD Million) Analysis by Vegan-certified, 2020-2035
  • Figure 60: North America Market Volume (Units) Analysis by Vegan-certified, 2020-2035
  • Figure 61: North America Market Value Share (%) and BPS Analysis by Vegan-certified, 2025-2035
  • Figure 62: North America Market Y-o-Y Growth (%) Projections by Vegan-certified, 2025-2035
  • Figure 63: North America Market Value (USD Million) Analysis by Anti-aging (35+), 2020-2035
  • Figure 64: North America Market Volume (Units) Analysis by Anti-aging (35+), 2020-2035
  • Figure 65: North America Market Value Share (%) and BPS Analysis by Anti-aging (35+), 2025-2035
  • Figure 66: North America Market Y-o-Y Growth (%) Projections by Anti-aging (35+), 2025-2035
  • Figure 67: North America Market Attractiveness by Extract Type, 2025-2035
  • Figure 68: North America Market Attractiveness by Masks & balms, 2025-2035
  • Figure 69: North America Market Attractiveness by Mass retail, 2025-2035
  • Figure 70: North America Market Attractiveness by Vegan-certified, 2025-2035
  • Figure 71: North America Market Attractiveness by Anti-aging (35+), 2025-2035
  • Figure 72: North America Market Attractiveness by Country, 2025-2035
  • Figure 73: Latin America Market Value (USD Million) by Extract Type, 2025-2035
  • Figure 74: Latin America Market Value (USD Million) by Masks & balms, 2025-2035
  • Figure 75: Latin America Market Value (USD Million) by Mass retail, 2025-2035
  • Figure 76: Latin America Market Value (USD Million) by Vegan-certified, 2025-2035
  • Figure 77: Latin America Market Value (USD Million) by Anti-aging (35+), 2025-2035
  • Figure 78: Latin America Market Value (USD Million) by Country, 2025-2035
  • Figure 79: Latin America Market Value (USD Million) Analysis by Country, 2020-2035
  • Figure 80: Latin America Market Volume (Units) Analysis by Country, 2020-2035
  • Figure 81: Latin America Market Value Share (%) and BPS Analysis by Country, 2025-2035
  • Figure 82: Latin America Market Y-o-Y Growth (%) Projections by Country, 2025-2035
  • Figure 83: Latin America Market Value (USD Million) Analysis by Extract Type, 2020-2035
  • Figure 84: Latin America Market Volume (Units) Analysis by Extract Type, 2020-2035
  • Figure 85: Latin America Market Value Share (%) and BPS Analysis by Extract Type, 2025-2035
  • Figure 86: Latin America Market Y-o-Y Growth (%) Projections by Extract Type, 2025-2035
  • Figure 87: Latin America Market Value (USD Million) Analysis by Masks & balms, 2020-2035
  • Figure 88: Latin America Market Volume (Units) Analysis by Masks & balms, 2020-2035
  • Figure 89: Latin America Market Value Share (%) and BPS Analysis by Masks & balms, 2025-2035
  • Figure 90: Latin America Market Y-o-Y Growth (%) Projections by Masks & balms, 2025-2035
  • Figure 91: Latin America Market Value (USD Million) Analysis by Mass retail, 2020-2035
  • Figure 92: Latin America Market Volume (Units) Analysis by Mass retail, 2020-2035
  • Figure 93: Latin America Market Value Share (%) and BPS Analysis by Mass retail, 2025-2035
  • Figure 94: Latin America Market Y-o-Y Growth (%) Projections by Mass retail, 2025-2035
  • Figure 95: Latin America Market Value (USD Million) Analysis by Vegan-certified, 2020-2035
  • Figure 96: Latin America Market Volume (Units) Analysis by Vegan-certified, 2020-2035
  • Figure 97: Latin America Market Value Share (%) and BPS Analysis by Vegan-certified, 2025-2035
  • Figure 98: Latin America Market Y-o-Y Growth (%) Projections by Vegan-certified, 2025-2035
  • Figure 99: Latin America Market Value (USD Million) Analysis by Anti-aging (35+), 2020-2035
  • Figure 100: Latin America Market Volume (Units) Analysis by Anti-aging (35+), 2020-2035
  • Figure 101: Latin America Market Value Share (%) and BPS Analysis by Anti-aging (35+), 2025-2035
  • Figure 102: Latin America Market Y-o-Y Growth (%) Projections by Anti-aging (35+), 2025-2035
  • Figure 103: Latin America Market Attractiveness by Extract Type, 2025-2035
  • Figure 104: Latin America Market Attractiveness by Masks & balms, 2025-2035
  • Figure 105: Latin America Market Attractiveness by Mass retail, 2025-2035
  • Figure 106: Latin America Market Attractiveness by Vegan-certified, 2025-2035
  • Figure 107: Latin America Market Attractiveness by Anti-aging (35+), 2025-2035
  • Figure 108: Latin America Market Attractiveness by Country, 2025-2035
  • Figure 109: Europe Market Value (USD Million) by Extract Type, 2025-2035
  • Figure 110: Europe Market Value (USD Million) by Masks & balms, 2025-2035
  • Figure 111: Europe Market Value (USD Million) by Mass retail, 2025-2035
  • Figure 112: Europe Market Value (USD Million) by Vegan-certified, 2025-2035
  • Figure 113: Europe Market Value (USD Million) by Anti-aging (35+), 2025-2035
  • Figure 114: Europe Market Value (USD Million) by Country, 2025-2035
  • Figure 115: Europe Market Value (USD Million) Analysis by Country, 2020-2035
  • Figure 116: Europe Market Volume (Units) Analysis by Country, 2020-2035
  • Figure 117: Europe Market Value Share (%) and BPS Analysis by Country, 2025-2035
  • Figure 118: Europe Market Y-o-Y Growth (%) Projections by Country, 2025-2035
  • Figure 119: Europe Market Value (USD Million) Analysis by Extract Type, 2020-2035
  • Figure 120: Europe Market Volume (Units) Analysis by Extract Type, 2020-2035
  • Figure 121: Europe Market Value Share (%) and BPS Analysis by Extract Type, 2025-2035
  • Figure 122: Europe Market Y-o-Y Growth (%) Projections by Extract Type, 2025-2035
  • Figure 123: Europe Market Value (USD Million) Analysis by Masks & balms, 2020-2035
  • Figure 124: Europe Market Volume (Units) Analysis by Masks & balms, 2020-2035
  • Figure 125: Europe Market Value Share (%) and BPS Analysis by Masks & balms, 2025-2035
  • Figure 126: Europe Market Y-o-Y Growth (%) Projections by Masks & balms, 2025-2035
  • Figure 127: Europe Market Value (USD Million) Analysis by Mass retail, 2020-2035
  • Figure 128: Europe Market Volume (Units) Analysis by Mass retail, 2020-2035
  • Figure 129: Europe Market Value Share (%) and BPS Analysis by Mass retail, 2025-2035
  • Figure 130: Europe Market Y-o-Y Growth (%) Projections by Mass retail, 2025-2035
  • Figure 131: Europe Market Value (USD Million) Analysis by Vegan-certified, 2020-2035
  • Figure 132: Europe Market Volume (Units) Analysis by Vegan-certified, 2020-2035
  • Figure 133: Europe Market Value Share (%) and BPS Analysis by Vegan-certified, 2025-2035
  • Figure 134: Europe Market Y-o-Y Growth (%) Projections by Vegan-certified, 2025-2035
  • Figure 135: Europe Market Value (USD Million) Analysis by Anti-aging (35+), 2020-2035
  • Figure 136: Europe Market Volume (Units) Analysis by Anti-aging (35+), 2020-2035
  • Figure 137: Europe Market Value Share (%) and BPS Analysis by Anti-aging (35+), 2025-2035
  • Figure 138: Europe Market Y-o-Y Growth (%) Projections by Anti-aging (35+), 2025-2035
  • Figure 139: Europe Market Attractiveness by Extract Type, 2025-2035
  • Figure 140: Europe Market Attractiveness by Masks & balms, 2025-2035
  • Figure 141: Europe Market Attractiveness by Mass retail, 2025-2035
  • Figure 142: Europe Market Attractiveness by Vegan-certified, 2025-2035
  • Figure 143: Europe Market Attractiveness by Anti-aging (35+), 2025-2035
  • Figure 144: Europe Market Attractiveness by Country, 2025-2035
  • Figure 145: East Asia Market Value (USD Million) by Extract Type, 2025-2035
  • Figure 146: East Asia Market Value (USD Million) by Masks & balms, 2025-2035
  • Figure 147: East Asia Market Value (USD Million) by Mass retail, 2025-2035
  • Figure 148: East Asia Market Value (USD Million) by Vegan-certified, 2025-2035
  • Figure 149: East Asia Market Value (USD Million) by Anti-aging (35+), 2025-2035
  • Figure 150: East Asia Market Value (USD Million) by Country, 2025-2035
  • Figure 151: East Asia Market Value (USD Million) Analysis by Country, 2020-2035
  • Figure 152: East Asia Market Volume (Units) Analysis by Country, 2020-2035
  • Figure 153: East Asia Market Value Share (%) and BPS Analysis by Country, 2025-2035
  • Figure 154: East Asia Market Y-o-Y Growth (%) Projections by Country, 2025-2035
  • Figure 155: East Asia Market Value (USD Million) Analysis by Extract Type, 2020-2035
  • Figure 156: East Asia Market Volume (Units) Analysis by Extract Type, 2020-2035
  • Figure 157: East Asia Market Value Share (%) and BPS Analysis by Extract Type, 2025-2035
  • Figure 158: East Asia Market Y-o-Y Growth (%) Projections by Extract Type, 2025-2035
  • Figure 159: East Asia Market Value (USD Million) Analysis by Masks & balms, 2020-2035
  • Figure 160: East Asia Market Volume (Units) Analysis by Masks & balms, 2020-2035
  • Figure 161: East Asia Market Value Share (%) and BPS Analysis by Masks & balms, 2025-2035
  • Figure 162: East Asia Market Y-o-Y Growth (%) Projections by Masks & balms, 2025-2035
  • Figure 163: East Asia Market Value (USD Million) Analysis by Mass retail, 2020-2035
  • Figure 164: East Asia Market Volume (Units) Analysis by Mass retail, 2020-2035
  • Figure 165: East Asia Market Value Share (%) and BPS Analysis by Mass retail, 2025-2035
  • Figure 166: East Asia Market Y-o-Y Growth (%) Projections by Mass retail, 2025-2035
  • Figure 167: East Asia Market Value (USD Million) Analysis by Vegan-certified, 2020-2035
  • Figure 168: East Asia Market Volume (Units) Analysis by Vegan-certified, 2020-2035
  • Figure 169: East Asia Market Value Share (%) and BPS Analysis by Vegan-certified, 2025-2035
  • Figure 170: East Asia Market Y-o-Y Growth (%) Projections by Vegan-certified, 2025-2035
  • Figure 171: East Asia Market Value (USD Million) Analysis by Anti-aging (35+), 2020-2035
  • Figure 172: East Asia Market Volume (Units) Analysis by Anti-aging (35+), 2020-2035
  • Figure 173: East Asia Market Value Share (%) and BPS Analysis by Anti-aging (35+), 2025-2035
  • Figure 174: East Asia Market Y-o-Y Growth (%) Projections by Anti-aging (35+), 2025-2035
  • Figure 175: East Asia Market Attractiveness by Extract Type, 2025-2035
  • Figure 176: East Asia Market Attractiveness by Masks & balms, 2025-2035
  • Figure 177: East Asia Market Attractiveness by Mass retail, 2025-2035
  • Figure 178: East Asia Market Attractiveness by Vegan-certified, 2025-2035
  • Figure 179: East Asia Market Attractiveness by Anti-aging (35+), 2025-2035
  • Figure 180: East Asia Market Attractiveness by Country, 2025-2035
  • Figure 181: South Asia & Pacific Market Value (USD Million) by Extract Type, 2025-2035
  • Figure 182: South Asia & Pacific Market Value (USD Million) by Masks & balms, 2025-2035
  • Figure 183: South Asia & Pacific Market Value (USD Million) by Mass retail, 2025-2035
  • Figure 184: South Asia & Pacific Market Value (USD Million) by Vegan-certified, 2025-2035
  • Figure 185: South Asia & Pacific Market Value (USD Million) by Anti-aging (35+), 2025-2035
  • Figure 186: South Asia & Pacific Market Value (USD Million) by Country, 2025-2035
  • Figure 187: South Asia & Pacific Market Value (USD Million) Analysis by Country, 2020-2035
  • Figure 188: South Asia & Pacific Market Volume (Units) Analysis by Country, 2020-2035
  • Figure 189: South Asia & Pacific Market Value Share (%) and BPS Analysis by Country, 2025-2035
  • Figure 190: South Asia & Pacific Market Y-o-Y Growth (%) Projections by Country, 2025-2035
  • Figure 191: South Asia & Pacific Market Value (USD Million) Analysis by Extract Type, 2020-2035
  • Figure 192: South Asia & Pacific Market Volume (Units) Analysis by Extract Type, 2020-2035
  • Figure 193: South Asia & Pacific Market Value Share (%) and BPS Analysis by Extract Type, 2025-2035
  • Figure 194: South Asia & Pacific Market Y-o-Y Growth (%) Projections by Extract Type, 2025-2035
  • Figure 195: South Asia & Pacific Market Value (USD Million) Analysis by Masks & balms, 2020-2035
  • Figure 196: South Asia & Pacific Market Volume (Units) Analysis by Masks & balms, 2020-2035
  • Figure 197: South Asia & Pacific Market Value Share (%) and BPS Analysis by Masks & balms, 2025-2035
  • Figure 198: South Asia & Pacific Market Y-o-Y Growth (%) Projections by Masks & balms, 2025-2035
  • Figure 199: South Asia & Pacific Market Value (USD Million) Analysis by Mass retail, 2020-2035
  • Figure 200: South Asia & Pacific Market Volume (Units) Analysis by Mass retail, 2020-2035
  • Figure 201: South Asia & Pacific Market Value Share (%) and BPS Analysis by Mass retail, 2025-2035
  • Figure 202: South Asia & Pacific Market Y-o-Y Growth (%) Projections by Mass retail, 2025-2035
  • Figure 203: South Asia & Pacific Market Value (USD Million) Analysis by Vegan-certified, 2020-2035
  • Figure 204: South Asia & Pacific Market Volume (Units) Analysis by Vegan-certified, 2020-2035
  • Figure 205: South Asia & Pacific Market Value Share (%) and BPS Analysis by Vegan-certified, 2025-2035
  • Figure 206: South Asia & Pacific Market Y-o-Y Growth (%) Projections by Vegan-certified, 2025-2035
  • Figure 207: South Asia & Pacific Market Value (USD Million) Analysis by Anti-aging (35+), 2020-2035
  • Figure 208: South Asia & Pacific Market Volume (Units) Analysis by Anti-aging (35+), 2020-2035
  • Figure 209: South Asia & Pacific Market Value Share (%) and BPS Analysis by Anti-aging (35+), 2025-2035
  • Figure 210: South Asia & Pacific Market Y-o-Y Growth (%) Projections by Anti-aging (35+), 2025-2035
  • Figure 211: South Asia & Pacific Market Attractiveness by Extract Type, 2025-2035
  • Figure 212: South Asia & Pacific Market Attractiveness by Masks & balms, 2025-2035
  • Figure 213: South Asia & Pacific Market Attractiveness by Mass retail, 2025-2035
  • Figure 214: South Asia & Pacific Market Attractiveness by Vegan-certified, 2025-2035
  • Figure 215: South Asia & Pacific Market Attractiveness by Anti-aging (35+), 2025-2035
  • Figure 216: South Asia & Pacific Market Attractiveness by Country, 2025-2035
  • Figure 217: Middle East and Africa Market Value (USD Million) by Extract Type, 2025-2035
  • Figure 218: Middle East and Africa Market Value (USD Million) by Masks & balms, 2025-2035
  • Figure 219: Middle East and Africa Market Value (USD Million) by Mass retail, 2025-2035
  • Figure 220: Middle East and Africa Market Value (USD Million) by Vegan-certified, 2025-2035
  • Figure 221: Middle East and Africa Market Value (USD Million) by Anti-aging (35+), 2025-2035
  • Figure 222: Middle East and Africa Market Value (USD Million) by Country, 2025-2035
  • Figure 223: Middle East and Africa Market Value (USD Million) Analysis by Country, 2020-2035
  • Figure 224: Middle East and Africa Market Volume (Units) Analysis by Country, 2020-2035
  • Figure 225: Middle East and Africa Market Value Share (%) and BPS Analysis by Country, 2025-2035
  • Figure 226: Middle East and Africa Market Y-o-Y Growth (%) Projections by Country, 2025-2035
  • Figure 227: Middle East and Africa Market Value (USD Million) Analysis by Extract Type, 2020-2035
  • Figure 228: Middle East and Africa Market Volume (Units) Analysis by Extract Type, 2020-2035
  • Figure 229: Middle East and Africa Market Value Share (%) and BPS Analysis by Extract Type, 2025-2035
  • Figure 230: Middle East and Africa Market Y-o-Y Growth (%) Projections by Extract Type, 2025-2035
  • Figure 231: Middle East and Africa Market Value (USD Million) Analysis by Masks & balms, 2020-2035
  • Figure 232: Middle East and Africa Market Volume (Units) Analysis by Masks & balms, 2020-2035
  • Figure 233: Middle East and Africa Market Value Share (%) and BPS Analysis by Masks & balms, 2025-2035
  • Figure 234: Middle East and Africa Market Y-o-Y Growth (%) Projections by Masks & balms, 2025-2035
  • Figure 235: Middle East and Africa Market Value (USD Million) Analysis by Mass retail, 2020-2035
  • Figure 236: Middle East and Africa Market Volume (Units) Analysis by Mass retail, 2020-2035
  • Figure 237: Middle East and Africa Market Value Share (%) and BPS Analysis by Mass retail, 2025-2035
  • Figure 238: Middle East and Africa Market Y-o-Y Growth (%) Projections by Mass retail, 2025-2035
  • Figure 239: Middle East and Africa Market Value (USD Million) Analysis by Vegan-certified, 2020-2035
  • Figure 240: Middle East and Africa Market Volume (Units) Analysis by Vegan-certified, 2020-2035
  • Figure 241: Middle East and Africa Market Value Share (%) and BPS Analysis by Vegan-certified, 2025-2035
  • Figure 242: Middle East and Africa Market Y-o-Y Growth (%) Projections by Vegan-certified, 2025-2035
  • Figure 243: Middle East and Africa Market Value (USD Million) Analysis by Anti-aging (35+), 2020-2035
  • Figure 244: Middle East and Africa Market Volume (Units) Analysis by Anti-aging (35+), 2020-2035
  • Figure 245: Middle East and Africa Market Value Share (%) and BPS Analysis by Anti-aging (35+), 2025-2035
  • Figure 246: Middle East and Africa Market Y-o-Y Growth (%) Projections by Anti-aging (35+), 2025-2035
  • Figure 247: Middle East and Africa Market Attractiveness by Extract Type, 2025-2035
  • Figure 248: Middle East and Africa Market Attractiveness by Masks & balms, 2025-2035
  • Figure 249: Middle East and Africa Market Attractiveness by Mass retail, 2025-2035
  • Figure 250: Middle East and Africa Market Attractiveness by Vegan-certified, 2025-2035
  • Figure 251: Middle East and Africa Market Attractiveness by Anti-aging (35+), 2025-2035
  • Figure 252: Middle East and Africa Market Attractiveness by Country, 2025-2035

Frequently Asked Questions

How big is the Antioxidant-Rich Sea Buckthorn Market in 2025?

The global Antioxidant-Rich Sea Buckthorn Market is estimated to be valued at USD 1,153.1 million in 2025.

What will be the size of the Antioxidant-Rich Sea Buckthorn Market in 2035?

The market size for the Antioxidant-Rich Sea Buckthorn Market is projected to reach USD 3,800.7 million by 2035.

How much will be the Antioxidant-Rich Sea Buckthorn Market growth between 2025 and 2035?

The Antioxidant-Rich Sea Buckthorn Market is expected to grow at a CAGR of 12.7% between 2025 and 2035.

What are the key product types in the Antioxidant-Rich Sea Buckthorn Market?

The key product types in the Antioxidant-Rich Sea Buckthorn Market are serums & concentrates, oils & blends, creams & lotions, capsules/nutricosmetics, and masks & balms.

Which function segment is projected to contribute significant share in the Antioxidant-Rich Sea Buckthorn Market in 2025?

In terms of function, the anti-aging segment is projected to command 52.5% share in the Antioxidant-Rich Sea Buckthorn Market in 2025.

Explore Similar Insights

Future Market Insights

Antioxidant-Rich Sea Buckthorn Market