
- Market Size (2026)
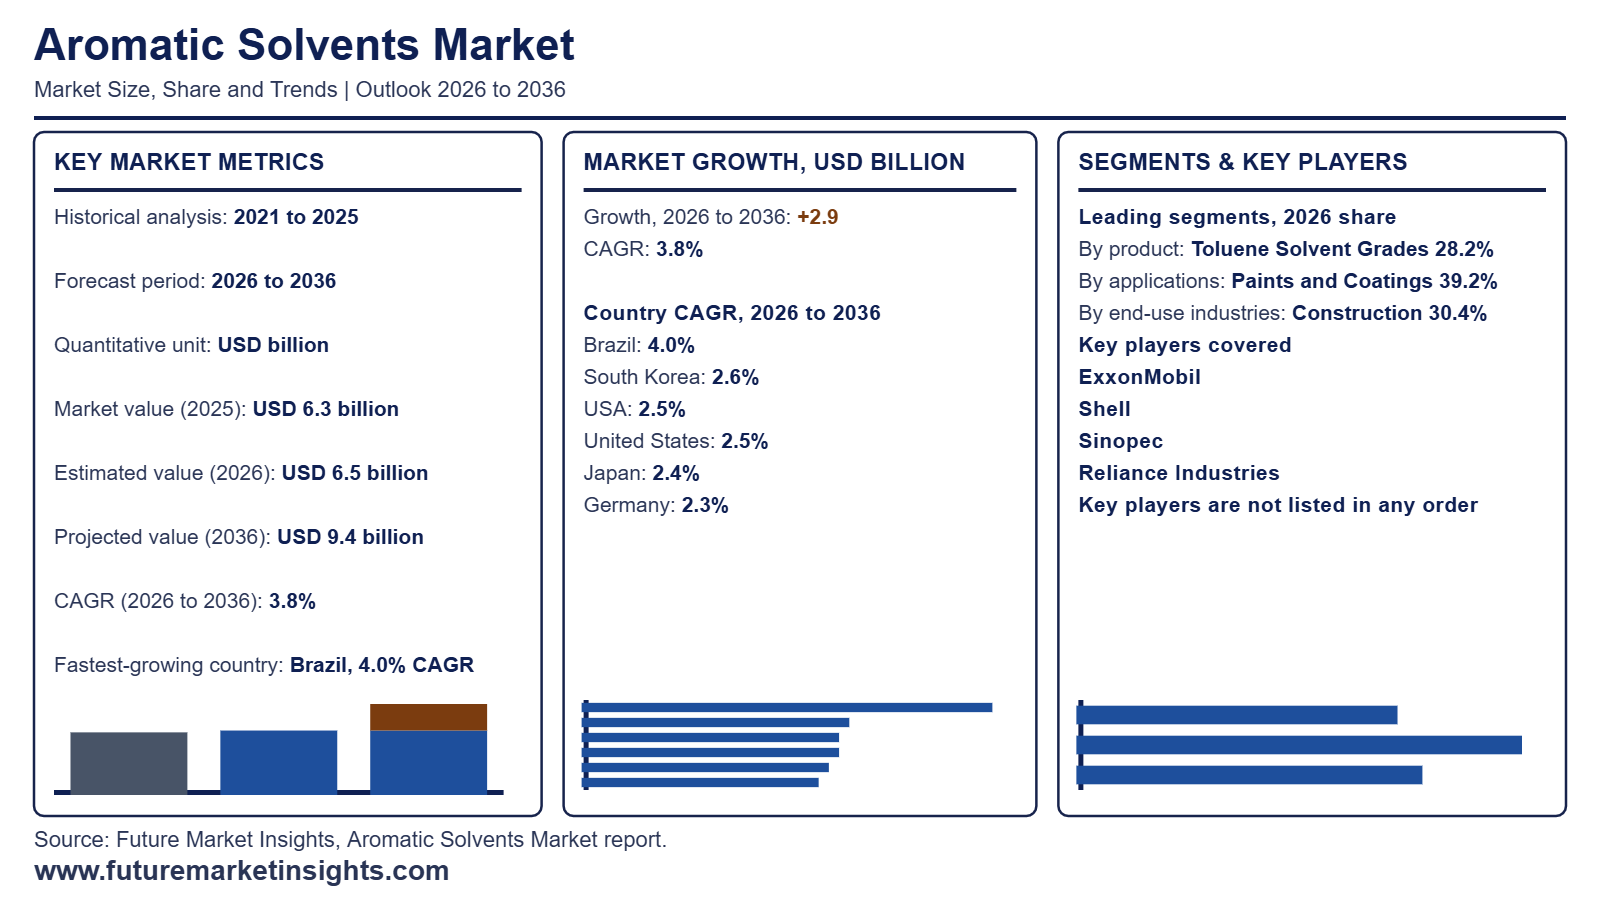
- USD 6.5 Bn
- Forecast (2036)
- USD 9.4 Bn
- CAGR (2026 to 2036)
- 3.8%
How Big Is the Aromatic Solvents Market in 2026?
The global aromatic solvents market is valued at USD 6.5 billion in 2026, up from USD 6.3 billion in 2025, and is projected by Future Market Insights (FMI) to reach USD 9.4 billion by 2036, expanding at a 3.8% CAGR to generate USD 2.9 billion in incremental revenue over the forecast decade.
| Market Metric | Valuation / Share / Forecast Benchmark |
|---|---|
| 2025 Market Size (Historical) | USD 6.3 billion |
| 2026 Market Size (Estimated) | USD 6.5 billion |
| 2036 Market Size (Projected) | USD 9.4 billion |
| Compound Annual Growth Rate (2026 to 2036) | 3.8% CAGR |
| Incremental Dollar Opportunity (2026 to 2036) | USD 2.9 billion |
| Dominant Product (2026 to 2036 Share) | Toluene Solvent Grades (28.2% in 2026, easing to 27.4% by 2036) |
| Leading & Fastest-Growing Applications | Paints and Coatings (39.2% share in 2026; 3.1% CAGR) | Agrochemical Formulations (4.9% CAGR) |
| Leading & Fastest-Growing End-Use Industries | Construction (30.4% share in 2026; 3.3% CAGR) | Agriculture (4.7% CAGR) |
| Largest Country Markets (2026 Global Share) | USA (15.0%), Japan (8.5%), Germany (6.5%) |
| Fastest-Growing Country Markets (2026 to 2036) | Brazil (4.0% CAGR), South Korea (2.6% CAGR), USA (2.5% CAGR) |
| Leading Tier-1 Companies | ExxonMobil, Shell, Sinopec, Reliance Industries |
Source: Future Market Insights analysis of the aromatic solvents market, 2026.
Executive Market Overview
Global demand for aromatic solvents rests on their ability to dissolve resins and active ingredients at a predictable evaporation rate, so formulators of solventborne systems such as anti-corrosion coatings keep qualified grades in recipes rather than switch on price. North America leads because refinery-integrated supply from ExxonMobil and Shell sits close to large coatings and industrial cleaning buyers, while Latin America is emerging as agrochemical formulation and local solvent sourcing expand. The USA is the largest country market at a 15.0% share, followed by Japan at 8.5% and Germany at 6.5%. Brazil grows fastest at a 4.0% CAGR on crop-protection formulation alongside agricultural adjuvants, ahead of South Korea at 2.6% and the USA at 2.5%.
Tightening VOC rules and the shift to waterborne, high-solids and green solvents alternatives are the main restraint, capping volume in the largest application, while swings in mixed xylene feedstock squeeze converter margins. Producers are responding by steering tonnage to formulation-critical grades, notably heavy aromatic naphtha for agrochemical carriers, and by locking in formulators through long-term contracts with documented composition. FMI projects Agrochemical Formulations at a 4.9% CAGR and Heavy Aromatic Naphtha at a 4.6% CAGR, against 3.8% for the market. Market sizing covers toluene and xylene solvent grades and heavy and light aromatic naphtha sold into coatings, agrochemicals, adhesives, cleaning and chemical processing, while excluding benzene, petrochemical-feedstock toluene and xylene, aliphatic and oxygenated solvents, and fuel-blending streams.
Analyst Perspective
"Aromatic solvent suppliers will grow revenue faster than volume, because coatings, adhesives and agrochemical formulators pay more for tight-cut, low-benzene grades that meet tougher emission rules. The commercial risk is feedstock and regulation, where naphtha price swings and tightening VOC limits can push buyers toward low-aromatic and bio-based substitutes within a single contract cycle."
- Nikhil Kaitwade, Principal Consultant, Future Market Insights (FMI)
Major Market Trends and Insights
- Agrochemical Formulation Growth Outpaces Coatings as Brazil Registers Record Products: Emulsifiable concentrate and other solvent-based crop protection formulations need high-solvency carriers, so each new registered formulation adds a recurring solvent buyer, while coatings demand tracks housing starts. FMI projects agrochemical formulations at a 4.9% CAGR against 3.1% for paints and coatings, which hold a 39.2% share in 2026, and agriculture at 4.7% against 3.3% for construction. AgriBrasilis (January 2026), citing Brazil's Ministry of Agriculture, reports a record 912 pesticide registrations in 2025, up 38% on 2024, including 427 chemical formulated products. Generics made up 86.9% of those formulated approvals, which pushes formulators toward cost-led solvent sourcing. FMI places Brazil at a 4.0% CAGR to 2036, the fastest of any country tracked.
- Korean Cracker Cuts Tighten Aromatics Feedstock for Regional Solvent Buyers: Aromatic solvent producers draw toluene, xylene and heavier cuts from refinery and cracker streams, so shrinking naphtha cracking capacity in South Korea reduces spot availability and lifts formulator input costs. The Korea Times (July 2026), citing Yonhap, reports that the industry ministry approved a Yeosu restructuring plan after approving a Daesan plan in February that cuts combined cracking capacity by 1.1 million tons. The Yeosu plan carries over 700 billion won in government support, which makes the capacity exits policy-backed. FMI projects South Korea at a 2.6% CAGR, so local formulators face higher feedstock costs while demand growth stays modest. Suppliers with integrated refinery feeds, such as ExxonMobil and Sinopec, gain pricing leverage over non-integrated blenders.
- Integrated Producers Steer Aromatics Streams Toward Higher Value Chains: Refiners can direct aromatics into a paraxylene chain or into solvent grades depending on margin, so solvent buyers compete with polyester intermediates for the same molecules. Reliance Industries (April 2026) reported oil-to-chemicals revenue of ₹6,62,401 crore (about USD 69.9 billion) for FY2025-26, up 5.7%, with EBITDA of ₹60,546 crore, up 10.1%. The company said paraxylene margins rose on tight supply and lower naphtha prices, and that it optimized aromatics output to capture higher deltas across the value chain. FMI lists Reliance among tier-1 suppliers and shows toluene solvent grades, the dominant product at 28.2% share in 2026, easing to 27.4% by 2036. Solvent-grade revenue therefore depends on securing contract allocations before refiners commit streams to polyester.
What Are the Main Drivers, Restraints, and Opportunities?
Coating resin and crop-protection formulation needs sustain recurring consumption of aromatic solvents, while VOC limits, consumer-use restrictions and workplace exposure controls raise qualification costs, which leaves documented low-impurity grades as the specification-led route to retained demand in technically demanding solventborne systems.
Driver: Recurring Solvent Demand from Coating and Crop-Protection Formulations
Coatings and crop-protection concentrates need solvents that keep resins and active ingredients in solution, which ties aromatic demand to coating resins systems. ExxonMobil Chemical (2025) names agricultural chemicals and coatings as the two primary applications of heavy aromatic fluids, where high solvency is critical to good results. In emulsifiable concentrates, the solvent dissolves the active ingredient. Buyers reorder when validated recipes run, not simply when end markets expand. Sellers that hold boiling range and composition steady between shipments protect those recipes and the repeat volume attached to them.
Restraint: VOC Limits, Consumer-Use Restrictions and Workplace Exposure Controls
Rules bite at formulation approval and in the workplace, and reformulation also reshapes coating additives choices. ECHA's REACH Annex XVII, Entry 48, bars toluene at 0.1% by weight or more in adhesives and spray paints supplied to the general public. U.S. EPA (September 1998) set national VOC emission standards for architectural coatings, and OSHA sets a toluene limit of 200 ppm over an 8-hour shift in general industry. None of these bans industrial aromatic use outright, but each can force reformulation, extraction controls or a different grade. Suppliers absorb documentation and qualification cost, and buyers carry the risk of changing a proven binder system.
Opportunity: Documented Low-Impurity Grades for Demanding Solventborne Formulations
Matching stringent formulations with documented impurity profiles lifts specification value, and emulsifiable concentrates formulators are a natural buyer. ExxonMobil Chemical (2025) offers naphthalene-depleted grades below 1 wt% and ultra-low-naphthalene grades at 0.1 wt%, plus Solvesso 100 ULC with cumene below 0.1 wt%. Haltermann Carless (November 2025) positions its Caromax low- and extra-low-naphthalene grades for agrochemical formulations. FMI projects naphthalene-depleted grades at a 5.3% CAGR and agrochemical-grade solvents at 4.4% through 2036. Formulators still test solubility, storage stability and local regulatory fit for each ingredient mix before switching.
How Is the Aromatic Solvents Market Segmented?
The global aromatic solvents market is segmented by product, application, end-use industry, and sales route, with all figures stated as revenue shares of the same qualifying solvent sale.
| Segmentation Axis | Sub-Segments Covered | 2026 Leading Segment & Share | Main Growth Benchmark (2026 to 2036) |
|---|---|---|---|
| Product | Toluene Solvent Grades, Xylene Solvent Grades, Heavy Aromatic Naphtha, Light Aromatic Naphtha | Toluene Solvent Grades (28.2% revenue share) | Share eases to 27.4% by 2036; Heavy Aromatic Naphtha leads growth at 4.6% CAGR |
| Application | Paints and Coatings, Agrochemical Formulations, Adhesives and Sealants, Industrial Cleaning and Degreasing, Chemical Processing | Paints and Coatings (39.2% revenue share) | Agrochemical Formulations (4.9% CAGR) vs. Paints and Coatings (3.1% CAGR) |
| End-Use Industry | Construction, Industrial Manufacturing, Automotive and Transport, Agriculture, Packaging and Printing | Construction (30.4% revenue share) | Agriculture (4.7% CAGR) vs. Construction (3.3% CAGR) |
| Sales Route | Long-Term Supply Contracts, Spot and Distributor Sales, Direct Sales to Formulators, Packaged and Small-Lot Sales | Long-Term Supply Contracts (38.0% revenue share) | Packaged and Small-Lot Sales leads growth at 4.4% CAGR |
Source: Future Market Insights analysis of the aromatic solvents market, 2026.
Why Do Toluene Solvent Grades Lead by Product?
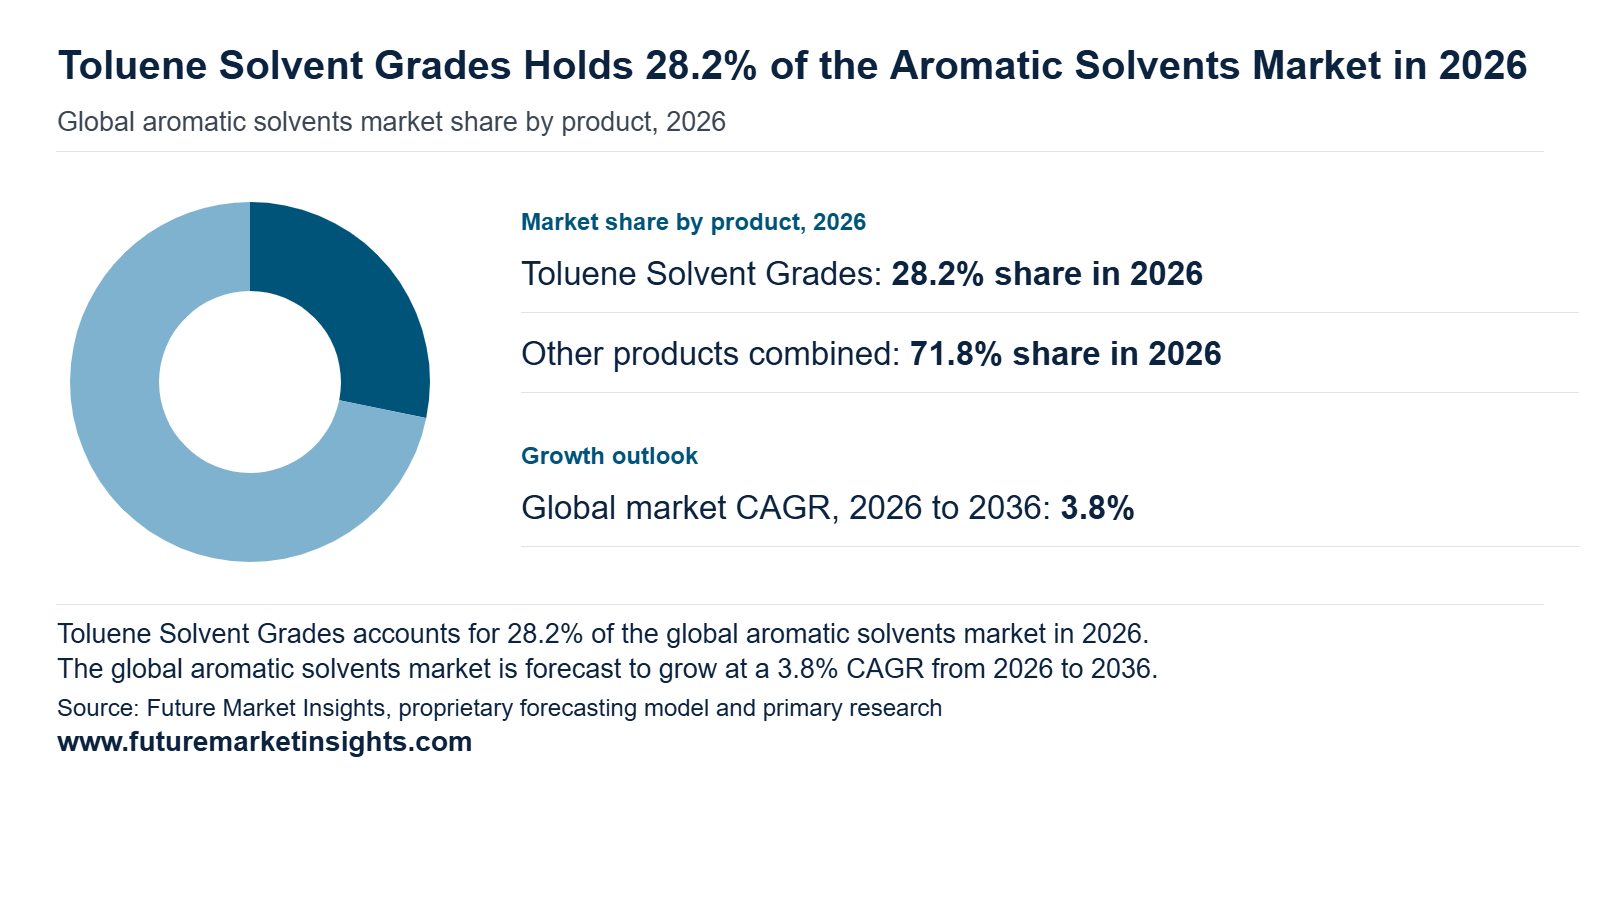
Xylene and naphtha grades win where slower release or complex active-ingredient systems matter, and OSHA lists paints and adhesives among toluene workplaces, which makes safe handling a purchase condition. Braskem (September 2025) listed toluene and xylene among its paint-sector solvents for ABRAFATI 2025, so mixed xylene sits beside it as a ready alternative. Toluene Solvent Grades hold 28.2% of product revenue in 2026, easing to 27.4% by 2036 at a 3.5% CAGR, while Heavy Aromatic Naphtha grows fastest at 4.6% CAGR. Toluene pairs strong resin solvency with fast evaporation, so formulators keep it in paint and adhesive systems where viscosity and drying are already qualified.
Why Does the Paints and Coatings Segment Lead by Application?
Paints and Coatings account for 39.2% of application revenue in 2026, easing to 36.6% by 2036 at a 3.1% CAGR, while Agrochemical Formulations grows fastest at 4.9% CAGR. Coatings buyers choose aromatic carriers by binder solubility, pigment wetting and drying curve, and those tests keep solventborne systems relevant in architectural and industrial work such as anti-corrosion coatings. ExxonMobil Chemical names coatings as one of two primary applications for its heavy aromatic fluids. ASTM International (February 2025) issued D3960-25 for VOC content of paints and related coatings, which narrows the formulation window without dictating which aromatic grade a buyer purchases.
Why Does the Construction Segment Lead by End-Use Industry?
Japan's Ministry of Land, Infrastructure, Transport and Tourism (August 2025) projected FY2025 construction investment of ¥75.57 trillion, a 3.2% rise. That is a downstream activity signal only, because solvent purchases depend on which specified systems use aromatic carriers. Construction represents 30.4% of end-use revenue in 2026, easing to 29.0% by 2036 at a 3.3% CAGR, while Agriculture grows fastest at 4.7% CAGR. Construction reaches solvent producers indirectly through decorative paints and protective finishes sold to contractors, so demand follows coating runs rather than building value, and repair and refurbishment add repeat batches.
Why Are Long-Term Supply Contracts Prominent by Sales Route?
Long-Term Supply Contracts lead sales route with 38.0% of revenue in 2026, easing to 36.9% by 2036 at a 3.5% CAGR. Buyers want predictable composition and timely bulk deliveries because shifts in evaporation or impurities change formulation results, and contracts reduce scheduling risk for regular batches. Shell Chemicals sells aromatic solvents direct, through distributors for smaller quantities and via e-channels, so contracts suit qualified recurring orders while chemical distribution serves shorter campaigns. Shell (May 2024) revised its ShellSol A150 cargo handling sheet, showing why logistics qualification matters to repeat shipments.
Aromatic Solvents Market by Region and Country (2026 to 2036)
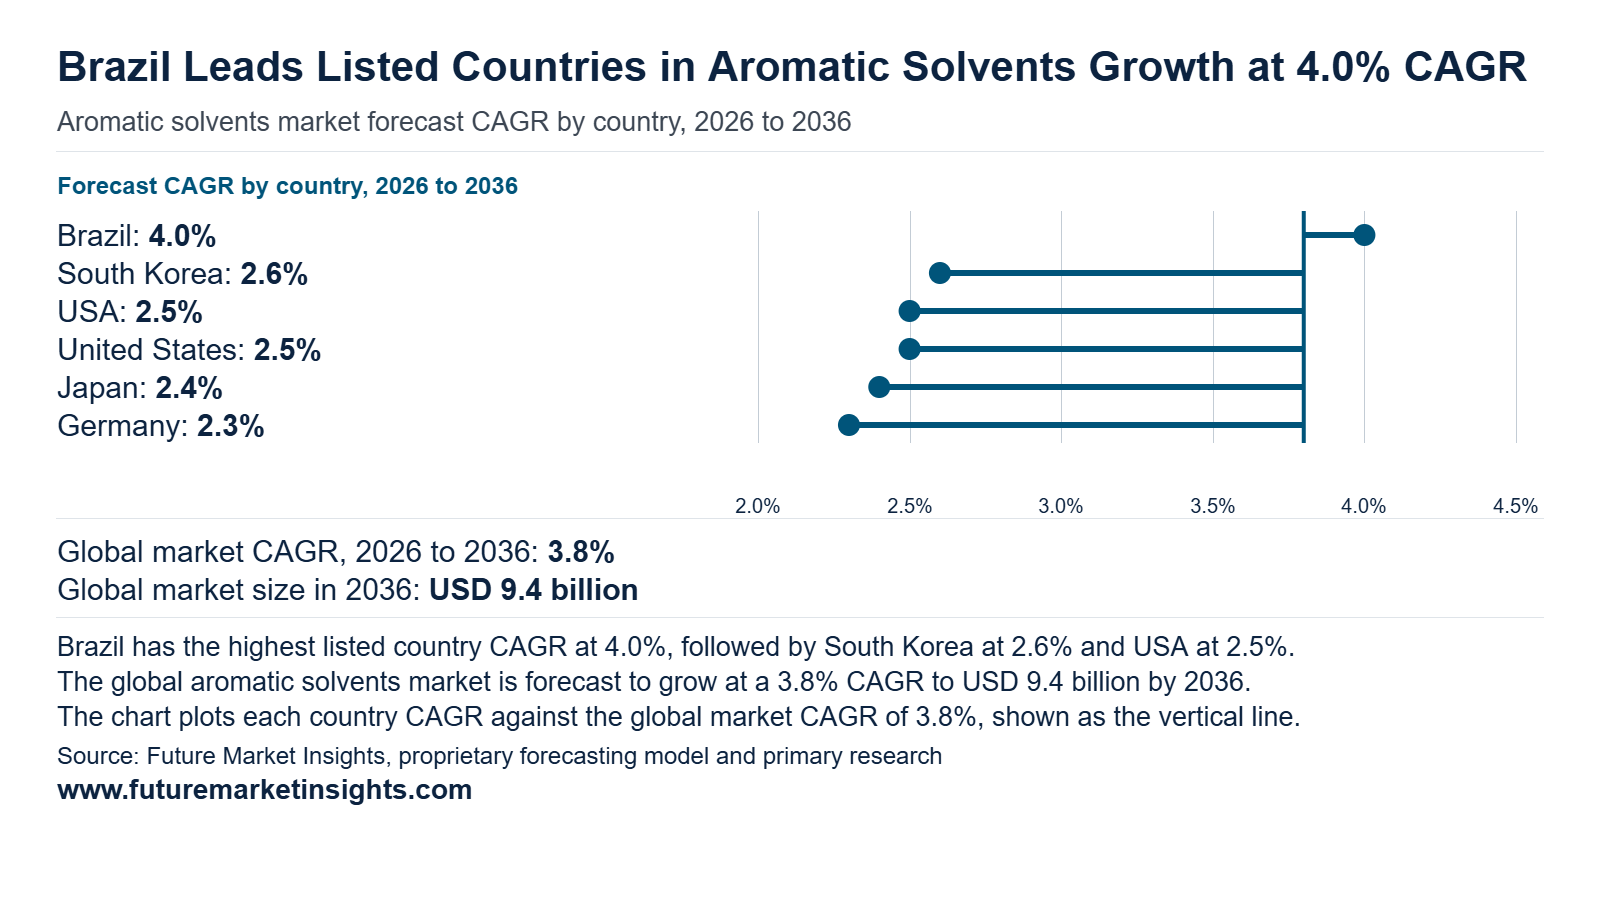
The five tracked countries hold 37.5% of global aromatic solvents revenue in 2026, so most demand sits outside the tracked set. That untracked share widens from 62.5% to 66.3% by 2036 as the tracked share eases to 33.7%. The United States remains the largest market, with its share easing from 15.0% to 13.3% while it adds USD 273 million. Japan and Germany lose share. The Brazil and South Korea cluster grows from USD 488 million to USD 685 million, an addition of USD 197 million.
| Country | 2026 Revenue | 2036 Revenue | 10-Year Addition | 2026 to 2036 CAGR | Global Share (2026 → 2036) |
|---|---|---|---|---|---|
| Brazil | USD 293 million | USD 433 million | USD 140 million | 4.0% | 4.5% → 4.6% |
| South Korea | USD 195 million | USD 252 million | USD 57 million | 2.6% | 3.0% → 2.7% |
| United States | USD 975 million | USD 1,248 million | USD 273 million | 2.5% | 15.0% → 13.3% |
| Japan | USD 553 million | USD 700 million | USD 147 million | 2.4% | 8.5% → 7.5% |
| Germany | USD 423 million | USD 530 million | USD 107 million | 2.3% | 6.5% → 5.6% |
Source: Future Market Insights analysis of the aromatic solvents market, 2026.
United States
The United States is projected to rise from USD 975 million in 2026 to USD 1,248 million in 2036, a 2.5% CAGR that adds USD 273 million, a 1.28-fold expansion. Its global share eases from 15.0% to 13.3%, yet it remains the largest country market. Coatings, construction and agrochemical formulation keep toluene and xylene grades in steady demand, while faster-growing economies dilute the US share. Regulation shapes procurement. The Environmental Protection Agency extended the deadline for manufacturers to report unpublished health and safety studies on 16 chemicals, including benzene and ethylbenzene, to May 22, 2026 (U.S. Environmental Protection Agency, June 2025). Those reviews raise compliance costs along aromatic streams, so formulators must weigh reformulation against supply security when they contract solvents.
Japan
Demand tracks paint, thinner and industrial coating consumption, which is mature and sensitive to construction and auto output. Shipments are volatile. Solvent-based and water-based synthetic resin paint shipments reached 75,331 tons in June 2026, up 6.0% year on year, while thinner shipments of 32,659 tons were 99.4% of the prior-year level (Japan Paint Manufacturers Association, August 2026). Thinners are the clearest solvent outlet, and their flat trend caps volume growth. Suppliers therefore compete on specification, delivery reliability and grade mix rather than headline tonnage. Japan grows from USD 553 million in 2026 to USD 700 million in 2036, a 2.4% CAGR with USD 147 million of addition, a 1.27-fold gain. Its share slips from 8.5% to 7.5%, though it keeps the second-largest position among the tracked countries.
Germany
Solvent demand is tied to chemical, coatings and industrial output, which remains weak. Capacity utilization at German chemical plants averaged 72.5% in 2025, and chemicals production declined 3.3% (VCI, March 2026). Germany rises from USD 423 million in 2026 to USD 530 million in 2036, a 2.3% CAGR and USD 107 million of addition, a 1.25-fold increase. Its share falls from 6.5% to 5.6% and the country stays third among those tracked. Plants running below the profitability threshold buy cautiously and push suppliers toward shorter contracts, so buyers favor spot and short-term cover over annual commitments. High location costs also encourage imports and consolidation of solvent distribution. Recovery in construction coatings would lift volumes, but the forecast assumes gradual improvement, which keeps growth near the group floor.
Brazil
Agrochemical formulation drives the solvent pull, since aromatic solvents carry active ingredients in emulsifiable concentrates. Brazil's statistics agency reported record 2025 soybean output of 166.1 million tons, up 14.6% (IBGE, January 2026), and later estimated the 2026 crop at 174.6 million tons (IBGE, June 2026). Larger harvests sustain crop protection spending. Brazil is the fastest-growing tracked market, rising from USD 293 million in 2026 to USD 433 million in 2036, a 4.0% CAGR, USD 140 million of addition and a 1.48-fold expansion. Its share climbs from 4.5% to 4.6%, the only gain in the set. Braskem produces benzene, toluene and xylenes at its crackers (Braskem, 2026), so local supply supports availability and shortens logistics for domestic formulators and paint producers.
South Korea
South Korea grows from USD 195 million in 2026 to USD 252 million in 2036, a 2.6% CAGR and USD 57 million of addition, a 1.29-fold increase. Its share eases from 3.0% to 2.7%. Supply is ample because refinery units extract benzene, toluene and xylene from reformed naphtha (S-OIL, 2026). The risk lies in restructuring of cracker capacity. The government approved the first petrochemical restructuring project with more than KRW 2.1 trillion of support (Ministry of Trade, Industry and Energy, February 2026), and LOTTE Chemical is integrating and reducing naphtha cracking facilities at Daesan and Yeosu (LOTTE Chemical, December 2025). Fewer crackers tighten by-product aromatics, while reformer-based producers gain pricing leverage, so solvent buyers should secure term supply early and diversify between domestic and imported grades.
Competitive Environment and Notable Companies
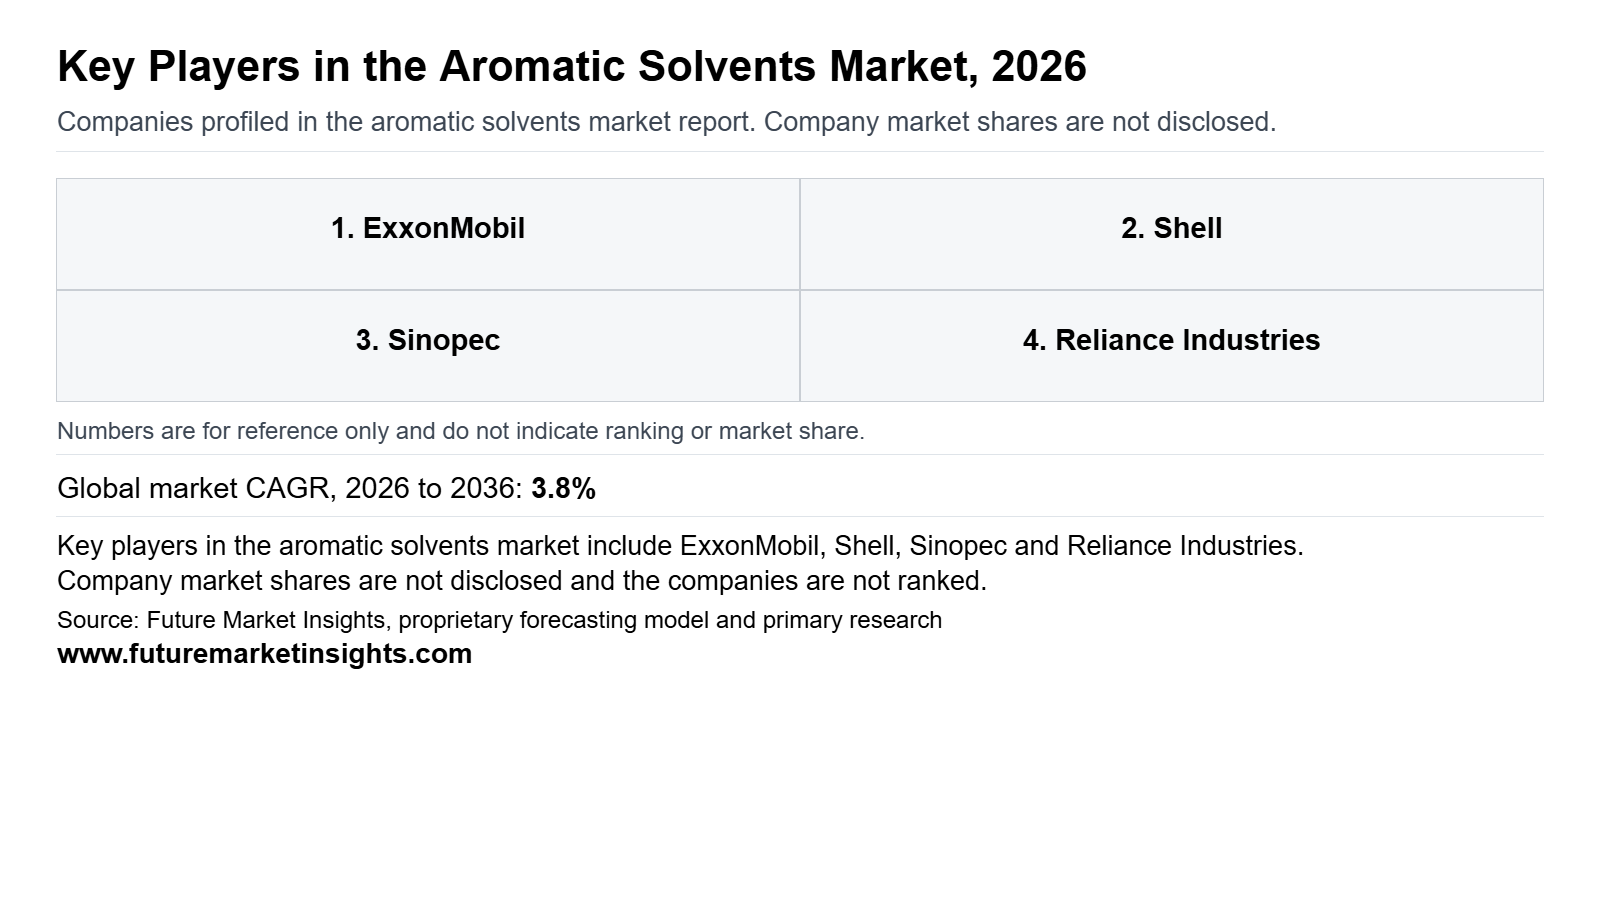
Notable companies operating in the global aromatic solvents market include ExxonMobil, Shell, Sinopec, Reliance Industries, Idemitsu Kosan, ENEOS, TotalEnergies, Braskem, Lotte Chemical and Haltermann Carless. The field divides into branded high-aromatic solvent portfolios, grade-specific solvent channels and integrated BTX and refinery-linked producers. Suppliers differ in grade breadth, naphthalene and cumene control, regulatory documentation and access to aromatic feedstock. Buyers in coatings, agrochemicals, inks and adhesives weigh these factors against delivered cost and supply continuity, so competitive standing depends on product specification as much as on upstream integration.
How Are Companies Positioned in the Aromatic Solvents Market?
Companies sit in three positions. ExxonMobil, Shell, TotalEnergies and Haltermann Carless lead with branded high-aromatic portfolios such as Solvesso, ShellSol, Solvarex and Caromax, where grade names carry buyer recognition. Idemitsu Kosan, ENEOS and Braskem compete through grade-specific channels, supplying defined C9 and C10 grades to regional formulators. Sinopec, Reliance Industries and Lotte Chemical operate integrated BTX and refinery-linked aromatics, where solvent sales are one outlet among several. Branded suppliers win on specification consistency, while integrated producers win on feedstock access and scale.
What Matters When a Buyer Selects an Aromatic Solvents Supplier?
A buyer selecting an aromatic solvent supplier first checks grade fit, then compliance depth. Formulators ask for C9 or C10 cuts, low naphthalene or ultra-low cumene variants, and current safety data sheets aligned with REACH and CLP. Delivered cost, batch consistency and storage or terminal access follow. Agrochemical customers add registration support, while coatings and ink customers focus on evaporation rate and solvency. Supplier continuity matters because reformulating around a different grade requires testing, so buyers favor vendors that document changes clearly and hold dependable regional inventory.
Which Capabilities Distinguish Product Offers?
Product offers are distinguished by grade range and impurity control. Branded portfolios span C9 and C10 fluids plus naphthalene-depleted and ultra-low cumene variants, which suit agrochemical and coating uses with strict content limits. Heavy aromatic grades with higher boiling ranges serve slow-evaporating applications. Technical datasheets, current safety documentation and application support separate premium suppliers from commodity sellers. Integrated producers can offer toluene and xylene alongside high-boiling cuts, which simplifies purchasing for buyers needing a broad solvent slate from one source.
How Does Geographic Reach Affect Competition?
Geographic reach shapes competition because aromatic solvents are shipped as flammable liquids and favor supply from nearby plants and terminals. ExxonMobil and TotalEnergies serve Europe and North America through established refinery sites, while Idemitsu Kosan and ENEOS anchor Japan and wider Asia. Sinopec, Reliance Industries and Lotte Chemical draw on large domestic aromatics bases in China, India and South Korea. Regional restructuring and feedstock shifts alter who can supply competitively, so buyers increasingly qualify a second source in a different region to protect continuity.
| Verified Company Evidence (2026) | Commercial Effect | Buyer Action |
|---|---|---|
| 29 April 2026: ExxonMobil issued version 2.09 of the Solvesso 100 ULC safety data sheet, replacing the 19 August 2025 issue, with identified uses spanning agrochemicals, coatings, cleaning agents, lubricants, metalworking fluids and fuels [ExxonMobil Chemical (April 2026)] | Confirms active supply and a refreshed compliance record for a flagship branded grade | Replace older SDS copies and confirm the revised version in REACH and CLP files |
| 11 December 2025: Haltermann Carless highlighted Caromax LN and XLN low and extra-low naphthalene grades for agrochemical use, and said it plans targeted investments to strengthen its European production sites in 2026 [Haltermann Carless (December 2025)] | Reinforces a niche in low-naphthalene heavy aromatics for regulated formulations | Qualify LN or XLN grades for agrochemical blends and request investment timing from the supplier |
| 29 March 2026: LOTTE Chemical announced a spin-off of its Daesan plant and merger into HD Hyundai Chemical, leaving LOTTE Chemical and HD Hyundai Oilbank with 50% each, with contract signing in June 2026 and merger completion targeted for September 2026 [LOTTE Chemical (March 2026)]. Separately, YNCC planned to suspend its No. 3 Yeosu aromatics unit (about 110,000 mt/year benzene, 60,000 mt/year toluene, 30,000 mt/year xylene) from late February [OPIS (January 2026)] | Korean BTX capacity is being consolidated and trimmed, which tightens regional toluene and xylene availability | Review toluene and xylene sourcing tied to Korean supply and line up an alternative region |
Source: Verified corporate disclosures and Future Market Insights analysis, 2026.
| Company | Core Positioning | Verified Activity & Source Attribution |
|---|---|---|
| ExxonMobil | Branded Solvesso C9 and C10 fluids, including ULC and ND variants | Solvesso 100 ULC SDS revised 29 April 2026 [ExxonMobil Chemical (April 2026)] |
| Shell | ShellSol A100 (C9) and A150 (C10) high-boiling aromatic solvents | Range described as high-boiling, fully aromatic C9 and C10 solvents for paints, adhesives, inks and insecticides [Shell Chemicals]. |
| Sinopec | Integrated aromatics and paraxylene producer in China | March 2026 paraxylene contract price settled at 9,750 yuan per metric ton, up 32% from February [Dow Jones/OPIS (April 2026)] |
| Reliance Industries | Refinery-linked aromatics within oil-to-chemicals | Aromatics production was optimized in October to December 2025 due to low margins, favoring transportation fuels [Polymer Update (January 2026)] |
| Idemitsu Kosan | Ipsol 100 (C9) and Ipsol 150 (C10) aromatic high-boiling solvents, plus solvent-grade toluene and xylene | Product lineup lists Ipsol 100, Ipsol 150, xylene and toluene for solvent use [Idemitsu Kosan]. |
| ENEOS | S100 and S150 high-boiling aromatic solvents | Positioning only [ENEOS product page]. No dated 2026 activity verified |
| TotalEnergies | Solvarex and ATOSOL aromatic ranges, including US supply from Texas | Positioning only [TotalEnergies Special Fluids]. |
| Braskem | Pluract aromatic solvent grades, toluene and xylene | Positioning only. Its September 2025 ABRAFATI showing falls outside the 12-month window |
| Lotte Chemical | BTX producer restructuring its Daesan complex | Daesan spin-off and merger with HD Hyundai Chemical announced 29 March 2026 [LOTTE Chemical (March 2026)] |
| Haltermann Carless | Caromax heavy aromatic solvents with low and extra-low naphthalene | Caromax LN and XLN grades promoted for agrochemicals, December 2025 [Haltermann Carless (December 2025)] |
Source: Verified corporate disclosures and Future Market Insights analysis, 2026.
Aromatic Solvents Market Report Scope and Research Methodology
FMI sizes the global aromatic solvents market from the revenue earned on toluene solvent grades, xylene solvent grades, heavy aromatic naphtha, and light aromatic naphtha sold as solvents, cross-checked against wider national solvent and refinery-linked aromatics industry totals. Sales into paints and coatings, agrochemical formulations, adhesives and sealants, industrial cleaning and degreasing, and chemical processing anchor the model because they account for the majority of global revenue. Revenue is counted only within the solvent sales transaction, with finished paints, pesticides, inks, and other downstream products excluded, along with aromatic intermediates sold solely for non-solvent conversion. Primary interviews with solvent producers, distributors, formulators, and procurement teams are combined with desk research on trade data, regulatory publications, standards, and company filings. Long-term contract, spot and distributor, direct, and packaged sales are reconciled so that segment and national figures sum to the global market total in every year. Company disclosures are used strictly to verify product positioning, grades, and production footprints rather than to estimate proprietary company revenues.
| Coverage Field | Report Scope |
|---|---|
| Market definition | Revenue from toluene solvent grades, xylene solvent grades, heavy aromatic naphtha, and light aromatic naphtha sold as solvents within the defined applications and industries. |
| Products | Toluene solvent grades, xylene solvent grades, heavy aromatic naphtha, and light aromatic naphtha. |
| Applications | Paints and coatings, agrochemical formulations, adhesives and sealants, industrial cleaning and degreasing, and chemical processing. |
| End-use industries | Construction, industrial manufacturing, automotive and transport, agriculture, and packaging and printing. |
| Sales routes | Long-term supply contracts, spot and distributor sales, direct sales to formulators, and packaged and small-lot sales. |
| Exclusions | Finished paints, pesticides, inks, and other downstream products, substitute or adjacent non-aromatic solvents, aromatic intermediates sold solely for non-solvent conversion, and freight or services outside the solvent sales transaction. |
| Quantitative units | USD billion for value. |
| Value basis | Revenue from solvent sales to buyers in each country, counted within the solvent sales transaction only. |
| Regions covered | North America, Latin America, Western Europe, Eastern Europe, East Asia, South Asia and Pacific, and Middle East and Africa. |
| National coverage | USA, China, India, Germany, Japan, South Korea, and Brazil. |
| Companies covered | ExxonMobil, Shell, Sinopec, Reliance Industries, Idemitsu Kosan, ENEOS, TotalEnergies, Braskem, Lotte Chemical, and Haltermann Carless. |
| Forecast period | 2026 to 2036. |
| Approach | Primary and secondary research with market triangulation, followed by data validation against independent indicators to avoid double counting. |
Source: Future Market Insights analysis of the aromatic solvents market, 2026.
Research Sources and Bibliography
- AgriBrasilis (January 2026). Brazil Approves Record Number of Pesticide Registrations in 2025. https://agribrasilis.com/2026/01/06/mapa-aprova-recorde-de-registros-de-agrotoxicos-em-2025-2/
- ASTM International (February 2025). ASTM D3960-25: Standard Practice for Determining Volatile Organic Compound (VOC) Content of Paints and Related Coatings. https://store.astm.org/d3960-25.html
- Braskem (September 2025). Braskem Reinforces Commitment to Innovation and Sustainable Development at ABRAFATI 2025. https://www.braskem.com/news-detail/braskem-reinforces-commitment-to-innovation-and-sustainable-development-at-abrafati-2025
- Braskem (2026). Olefins and Aromatics. https://www.braskem.com/olefinsandaromatics
- Dow Jones/OPIS (April 2026). Sinopec’s March Paraxylene CP Settles 32% Higher on Tight Supply. https://www.itiger.com/hans/news/2625620079
- European Chemicals Agency (n.d.). REACH Annex XVII, Entry 48, Toluene: Conditions of restriction. https://echa.europa.eu/documents/10162/f28ce048-676d-4d17-b939-0c08e9a0db9f
- ExxonMobil Chemical (April 2026). SOLVESSO 100 ULC Safety Data Sheet, version 2.09. https://www.exxonmobilchemical.com/en/chemicals/webapi/dps/v1/safetydatasheets/1289484/en
- ExxonMobil Chemical (2025). Solvesso™ heavy aromatic solvent fact sheet, Asia Pacific (ULC and ND grades). https://www.exxonmobilchemical.com/-/media/media-assets/media-library-assets/em_factsheet_solvesso100ulc.pdf
- ExxonMobil Chemical (2025). Solvesso™ Heavy Aromatic Solvents. https://www.exxonmobilchemical.com/en/products/fluids/heavy-aromatic-solvents
- Haltermann Carless (November 2025). Agrochemicals: Key benefits of low-naphthalene aromatic solvents. https://www.haltermann-carless.com/blog/tag/agrochemicals
- Haltermann Carless (December 2025). Haltermann Carless Pioneering Spirit: 2025 Review and Outlook for 2026. https://www.haltermann-carless.com/blog/haltermann-carless-pioneering-spirit-2025-review-and-outlook-for-2026
- IBGE (January 2026). Safra de 2025 é recorde e previsão para 2026 é 1,8% menor. https://agenciadenoticias.ibge.gov.br/agencia-noticias/2012-agencia-de-noticias/noticias/45674-safra-de-2025-e-recorde-e-previsao-para-2026-e-1-8-menor
- IBGE (June 2026). Soybean estimate points out to new record in time series. https://agenciadenoticias.ibge.gov.br/en/agencia-news/2184-news-agency/news/47094-soybean-estimate-points-out-to-new-record-in-time-series
- Idemitsu Kosan (n.d.). Solvents and derivatives product lineup. https://www.idemitsu.com/en/business/ipc/solvent_derivative/index.html
- Japan Paint Manufacturers Association (August 2026). 2026年6月の経済産業省統計 確報が公表されました. https://toryo.or.jp/jp/anzen/news/files/ME-20260817.pdf
- Korea Times (July 2026). Gov’t approves restructuring plan for Yeosu petrochemical complex. https://www.koreatimes.co.kr/business/20260722/govt-approves-restructuring-plan-for-yeosu-petrochemical-complex
- LOTTE Chemical (December 2025). LOTTE Chemical proactively restructuring its commodity petrochemical business. https://www.lottechem.com/en/media/news/1161/view.do
- LOTTE Chemical (March 2026). LOTTE Chemical to merge into integrated corporation after spinning off Daesan plant. https://www.lottechem.com/en/media/news/1190/view.do?page=2
- Ministry of Land, Infrastructure, Transport and Tourism, Japan (August 2025). FY2025 Construction Investment Outlook. https://www.mlit.go.jp/report/press/content/001907483.pdf
- Ministry of Trade, Industry and Resources, Republic of Korea (February 2026). MOTIR Approves First Petrochemical Restructuring Project, Unveils Support Package of Over KRW 2.1 Trillion. https://english.motir.go.kr/eng/article/EATCLdfa319ada/2512/view
- Occupational Safety and Health Administration (n.d.). Toluene. https://www.osha.gov/toluene
- Occupational Safety and Health Administration (n.d.). Toluene: Standards (29 CFR 1910.1000, Table Z-2). https://osha.gov/toluene/standards
- OPIS (January 2026). South Korea’s YNCC to Mothball No. 3 Aromatics Complex as Petchem Losses Mount. https://www.opis.com/resources/energy-market-news-from-opis/south-koreas-yncc-to-mothball-no-3-aromatics-complex-as-petchem-losses-mount/
- Polymer Update (January 2026). Reliance Industries’ O2C turnover up 8.4% on stronger fuel retail earnings. https://www.polymerupdate.com/Blogs/Details/1438396/All
- Reliance Industries Limited (April 2026). Media Release: RIL Q4 FY2025-26 Financial and Operational Performance. https://www.ril.com/sites/default/files/2026-04/24042026_Media_Release_RIL_Q4_FY2025-26_Financial_and_Operational_Performance.pdf
- Shell (May 2024). Cargo Handling Sheet: ShellSol A150, Revision 6. https://www.shell.com/business-customers/chemicals/safe-product-handling-and-transportation/marine-cargo-chemicals-handling.html
- Shell Chemicals (n.d.). Aromatic Solvents. https://www.shell.com/business-customers/chemicals/our-products/solvents-hydrocarbon/aromatic-solvents.html
- S-OIL (2026). Production Process. https://www.s-oil.com/en/m/energy/Process.aspx
- U.S. Environmental Protection Agency (June 2025). EPA to Provide Extension for Reporting of Health and Safety Data for 16 Chemicals Being Considered for Risk Evaluation under TSCA. https://www.epa.gov/chemicals-under-tsca/epa-provide-extension-reporting-health-and-safety-data-16-chemicals-being
- U.S. Environmental Protection Agency (September 1998). National Volatile Organic Compound Emission Standards for Architectural Coatings, 63 FR 48848. https://www.govinfo.gov/content/pkg/FR-1998-09-11/html/98-22659.htm
- VCI, German Chemical Industry Association (March 2026). Quarterly report 4.2025: Chemical industry still in trouble. https://www.vci.de/vci-online/presse/pressemitteilungen/quartely-report-4-2025.jsp
Table of Content
- Key Takeaways
- Market Size and CAGR
- Top Growth Driver
- Fastest Growing Segment
- Leading Region
- Key Companies
- Emerging Opportunities
- Executive Summary
- Global Market Outlook
- Demand-side Trends
- Supply-side Trends
- Technology Roadmap Analysis
- Analysis and Recommendations
- Analyst Perspective (What is happening? Why now? What should investors know?)
- Key Questions Answered
- How large is the market?
- What is the CAGR?
- What are key trends?
- Which region dominates?
- Who are the leaders?
Read More...
- Market Overview
- Market Coverage / Taxonomy
- Market Definition / Scope / Limitations
- Research Methodology
- Chapter Orientation
- Analytical Lens and Working Hypotheses
- Market Structure, Signals, and Trend Drivers
- Benchmarking and Cross-market Comparability
- Market Sizing, Forecasting, and Opportunity Mapping
- Research Design and Evidence Framework
- Desk Research Programme (Secondary Evidence)
- Expert Input and Fieldwork (Primary Evidence)
- Tooling, Models, and Reference Databases
- Data Engineering and Model Build
- Quality Assurance and Audit Trail
- Market Background
- Market Dynamics (Drivers, Restraints, Opportunity, Trends)
- Scenario Forecast (Optimistic, Likely, Conservative)
- Impact Analysis
- AI Impact
- Sustainability Impact
- Regulatory Impact
- Technology Impact
- Consumer / Buyer Analysis
- Purchase Drivers
- Adoption Barriers
- Buyer Journey
- Opportunity Map Analysis
- Product Life Cycle Analysis
- Supply Chain Analysis
- Investment Feasibility Matrix
- Value Chain Analysis
- PESTLE and Porter's Analysis
- Regulatory Landscape
- Regional Parent Market Outlook
- Production and Consumption Statistics
- Import and Export Statistics
- Global Market Analysis and Forecast, 2021 to 2036
- Historical Market Size Value (USD Million) Analysis, 2021 to 2025
- Current and Future Market Size Value (USD Million) Projections, 2026 to 2036
- Y-o-Y Growth Trend Analysis
- Absolute $ Opportunity Analysis
- Global Market Pricing Analysis, 2021 to 2036
- Global Market Analysis and Forecast, By Product, 2021 to 2036
- Introduction / Key Findings
- Historical Market Size Value (USD Million) Analysis By Product, 2021 to 2025
- Current and Future Market Size Value (USD Million) Analysis and Forecast By Product, 2026 to 2036
- Toluene Solvent Grades
- Xylene Solvent Grades
- Heavy Aromatic Naphtha
- Light Aromatic Naphtha
- Y-o-Y Growth Trend Analysis By Product, 2021 to 2025
- Absolute $ Opportunity Analysis By Product, 2026 to 2036
- Global Market Analysis and Forecast, By Application, 2021 to 2036
- Introduction / Key Findings
- Historical Market Size Value (USD Million) Analysis By Application, 2021 to 2025
- Current and Future Market Size Value (USD Million) Analysis and Forecast By Application, 2026 to 2036
- Paints and Coatings
- Agrochemical Formulations
- Adhesives and Sealants
- Industrial Cleaning and Degreasing
- Chemical Processing
- Y-o-Y Growth Trend Analysis By Application, 2021 to 2025
- Absolute $ Opportunity Analysis By Application, 2026 to 2036
- Global Market Analysis and Forecast, By End-Use Industry, 2021 to 2036
- Introduction / Key Findings
- Historical Market Size Value (USD Million) Analysis By End-Use Industry, 2021 to 2025
- Current and Future Market Size Value (USD Million) Analysis and Forecast By End-Use Industry, 2026 to 2036
- Construction
- Industrial Manufacturing
- Automotive and Transport
- Agriculture
- Packaging and Printing
- Y-o-Y Growth Trend Analysis By End-Use Industry, 2021 to 2025
- Absolute $ Opportunity Analysis By End-Use Industry, 2026 to 2036
- Global Market Analysis and Forecast, By Sales Route, 2021 to 2036
- Introduction / Key Findings
- Historical Market Size Value (USD Million) Analysis By Sales Route, 2021 to 2025
- Current and Future Market Size Value (USD Million) Analysis and Forecast By Sales Route, 2026 to 2036
- Long-Term Supply Contracts
- Spot and Distributor Sales
- Direct Sales to Formulators
- Packaged and Small-Lot Sales
- Y-o-Y Growth Trend Analysis By Sales Route, 2021 to 2025
- Absolute $ Opportunity Analysis By Sales Route, 2026 to 2036
- Global Market Analysis and Forecast, By Region, 2021 to 2036
- Introduction
- Historical Market Size Value (USD Million) Analysis By Region, 2021 to 2025
- Current Market Size Value (USD Million) Analysis and Forecast By Region, 2026 to 2036
- North America
- Latin America
- Western Europe
- Eastern Europe
- East Asia
- South Asia and Pacific
- Middle East and Africa
- Market Attractiveness Analysis By Region
- North America Market Analysis and Forecast, By Country, 2021 to 2036
- Historical Market Size Value (USD Million) Trend Analysis By Market Taxonomy, 2021 to 2025
- Market Size Value (USD Million) Forecast By Market Taxonomy, 2026 to 2036
- By Country
- United States
- Canada
- By Product
- By Application
- By End-Use Industry
- By Sales Route
- By Country
- Market Attractiveness Analysis
- By Country
- By Product
- By Application
- By End-Use Industry
- By Sales Route
- Key Takeaways
- Latin America Market Analysis and Forecast, By Country, 2021 to 2036
- Historical Market Size Value (USD Million) Trend Analysis By Market Taxonomy, 2021 to 2025
- Market Size Value (USD Million) Forecast By Market Taxonomy, 2026 to 2036
- By Country
- Brazil
- Mexico
- Argentina
- Chile
- By Product
- By Application
- By End-Use Industry
- By Sales Route
- By Country
- Market Attractiveness Analysis
- By Country
- By Product
- By Application
- By End-Use Industry
- By Sales Route
- Key Takeaways
- Western Europe Market Analysis and Forecast, By Country, 2021 to 2036
- Historical Market Size Value (USD Million) Trend Analysis By Market Taxonomy, 2021 to 2025
- Market Size Value (USD Million) Forecast By Market Taxonomy, 2026 to 2036
- By Country
- Germany
- France
- United Kingdom
- Italy
- Spain
- Benelux
- Nordics
- By Product
- By Application
- By End-Use Industry
- By Sales Route
- By Country
- Market Attractiveness Analysis
- By Country
- By Product
- By Application
- By End-Use Industry
- By Sales Route
- Key Takeaways
- Eastern Europe Market Analysis and Forecast, By Country, 2021 to 2036
- Historical Market Size Value (USD Million) Trend Analysis By Market Taxonomy, 2021 to 2025
- Market Size Value (USD Million) Forecast By Market Taxonomy, 2026 to 2036
- By Country
- Poland
- Czech Republic
- Romania
- Hungary
- By Product
- By Application
- By End-Use Industry
- By Sales Route
- By Country
- Market Attractiveness Analysis
- By Country
- By Product
- By Application
- By End-Use Industry
- By Sales Route
- Key Takeaways
- East Asia Market Analysis and Forecast, By Country, 2021 to 2036
- Historical Market Size Value (USD Million) Trend Analysis By Market Taxonomy, 2021 to 2025
- Market Size Value (USD Million) Forecast By Market Taxonomy, 2026 to 2036
- By Country
- China
- Japan
- South Korea
- By Product
- By Application
- By End-Use Industry
- By Sales Route
- By Country
- Market Attractiveness Analysis
- By Country
- By Product
- By Application
- By End-Use Industry
- By Sales Route
- Key Takeaways
- South Asia and Pacific Market Analysis and Forecast, By Country, 2021 to 2036
- Historical Market Size Value (USD Million) Trend Analysis By Market Taxonomy, 2021 to 2025
- Market Size Value (USD Million) Forecast By Market Taxonomy, 2026 to 2036
- By Country
- India
- ASEAN
- Australia and New Zealand
- By Product
- By Application
- By End-Use Industry
- By Sales Route
- By Country
- Market Attractiveness Analysis
- By Country
- By Product
- By Application
- By End-Use Industry
- By Sales Route
- Key Takeaways
- Middle East and Africa Market Analysis and Forecast, By Country, 2021 to 2036
- Historical Market Size Value (USD Million) Trend Analysis By Market Taxonomy, 2021 to 2025
- Market Size Value (USD Million) Forecast By Market Taxonomy, 2026 to 2036
- By Country
- GCC Countries
- South Africa
- Türkiye
- Israel
- By Product
- By Application
- By End-Use Industry
- By Sales Route
- By Country
- Market Attractiveness Analysis
- By Country
- By Product
- By Application
- By End-Use Industry
- By Sales Route
- Key Takeaways
- Key Countries Market Analysis
- United States
- Pricing Analysis
- Market Share Analysis, 2025
- By Product
- By Application
- By End-Use Industry
- By Sales Route
- Canada
- Pricing Analysis
- Market Share Analysis, 2025
- By Product
- By Application
- By End-Use Industry
- By Sales Route
- Brazil
- Pricing Analysis
- Market Share Analysis, 2025
- By Product
- By Application
- By End-Use Industry
- By Sales Route
- Mexico
- Pricing Analysis
- Market Share Analysis, 2025
- By Product
- By Application
- By End-Use Industry
- By Sales Route
- Argentina
- Pricing Analysis
- Market Share Analysis, 2025
- By Product
- By Application
- By End-Use Industry
- By Sales Route
- Chile
- Pricing Analysis
- Market Share Analysis, 2025
- By Product
- By Application
- By End-Use Industry
- By Sales Route
- Germany
- Pricing Analysis
- Market Share Analysis, 2025
- By Product
- By Application
- By End-Use Industry
- By Sales Route
- France
- Pricing Analysis
- Market Share Analysis, 2025
- By Product
- By Application
- By End-Use Industry
- By Sales Route
- United Kingdom
- Pricing Analysis
- Market Share Analysis, 2025
- By Product
- By Application
- By End-Use Industry
- By Sales Route
- Italy
- Pricing Analysis
- Market Share Analysis, 2025
- By Product
- By Application
- By End-Use Industry
- By Sales Route
- Spain
- Pricing Analysis
- Market Share Analysis, 2025
- By Product
- By Application
- By End-Use Industry
- By Sales Route
- Benelux
- Pricing Analysis
- Market Share Analysis, 2025
- By Product
- By Application
- By End-Use Industry
- By Sales Route
- Nordics
- Pricing Analysis
- Market Share Analysis, 2025
- By Product
- By Application
- By End-Use Industry
- By Sales Route
- Poland
- Pricing Analysis
- Market Share Analysis, 2025
- By Product
- By Application
- By End-Use Industry
- By Sales Route
- Czech Republic
- Pricing Analysis
- Market Share Analysis, 2025
- By Product
- By Application
- By End-Use Industry
- By Sales Route
- Romania
- Pricing Analysis
- Market Share Analysis, 2025
- By Product
- By Application
- By End-Use Industry
- By Sales Route
- Hungary
- Pricing Analysis
- Market Share Analysis, 2025
- By Product
- By Application
- By End-Use Industry
- By Sales Route
- China
- Pricing Analysis
- Market Share Analysis, 2025
- By Product
- By Application
- By End-Use Industry
- By Sales Route
- Japan
- Pricing Analysis
- Market Share Analysis, 2025
- By Product
- By Application
- By End-Use Industry
- By Sales Route
- South Korea
- Pricing Analysis
- Market Share Analysis, 2025
- By Product
- By Application
- By End-Use Industry
- By Sales Route
- India
- Pricing Analysis
- Market Share Analysis, 2025
- By Product
- By Application
- By End-Use Industry
- By Sales Route
- ASEAN
- Pricing Analysis
- Market Share Analysis, 2025
- By Product
- By Application
- By End-Use Industry
- By Sales Route
- Australia and New Zealand
- Pricing Analysis
- Market Share Analysis, 2025
- By Product
- By Application
- By End-Use Industry
- By Sales Route
- GCC Countries
- Pricing Analysis
- Market Share Analysis, 2025
- By Product
- By Application
- By End-Use Industry
- By Sales Route
- South Africa
- Pricing Analysis
- Market Share Analysis, 2025
- By Product
- By Application
- By End-Use Industry
- By Sales Route
- Türkiye
- Pricing Analysis
- Market Share Analysis, 2025
- By Product
- By Application
- By End-Use Industry
- By Sales Route
- Israel
- Pricing Analysis
- Market Share Analysis, 2025
- By Product
- By Application
- By End-Use Industry
- By Sales Route
- United States
- Market Structure Analysis
- Competition Dashboard
- Competition Benchmarking
- Market Share Analysis of Top Players
- By Region
- By Product
- By Application
- By End-Use Industry
- By Sales Route
- Emerging Startups
- Innovation Benchmarking
- Competition Analysis
- Competition Deep Dive
- ExxonMobil
- Overview
- Product Portfolio
- Profitability by Market Segments
- Sales Footprint
- Strategy Overview
- Marketing Strategy
- Product Strategy
- Channel Strategy
- Shell
- TotalEnergies
- Haltermann Carless
- Idemitsu Kosan
- ENEOS
- Braskem
- Sinopec
- Reliance Industries
- Lotte Chemical
- ExxonMobil
- Case Studies
- Success Stories
- Recent Developments
- Competition Deep Dive
- Assumptions & Acronyms Used
List of Tables
- Table 1: Global Market Value (USD Million) Forecast by Region, 2021 to 2036
- Table 2: Global Market Value (USD Million) Forecast by Product, 2021 to 2036
- Table 3: Global Market Value (USD Million) Forecast by Application, 2021 to 2036
- Table 4: Global Market Value (USD Million) Forecast by End-Use Industry, 2021 to 2036
- Table 5: Global Market Value (USD Million) Forecast by Sales Route, 2021 to 2036
- Table 6: North America Market Value (USD Million) Forecast by Country, 2021 to 2036
- Table 7: North America Market Value (USD Million) Forecast by Product, 2021 to 2036
- Table 8: North America Market Value (USD Million) Forecast by Application, 2021 to 2036
- Table 9: North America Market Value (USD Million) Forecast by End-Use Industry, 2021 to 2036
- Table 10: North America Market Value (USD Million) Forecast by Sales Route, 2021 to 2036
- Table 11: Latin America Market Value (USD Million) Forecast by Country, 2021 to 2036
- Table 12: Latin America Market Value (USD Million) Forecast by Product, 2021 to 2036
- Table 13: Latin America Market Value (USD Million) Forecast by Application, 2021 to 2036
- Table 14: Latin America Market Value (USD Million) Forecast by End-Use Industry, 2021 to 2036
- Table 15: Latin America Market Value (USD Million) Forecast by Sales Route, 2021 to 2036
- Table 16: Western Europe Market Value (USD Million) Forecast by Country, 2021 to 2036
- Table 17: Western Europe Market Value (USD Million) Forecast by Product, 2021 to 2036
- Table 18: Western Europe Market Value (USD Million) Forecast by Application, 2021 to 2036
- Table 19: Western Europe Market Value (USD Million) Forecast by End-Use Industry, 2021 to 2036
- Table 20: Western Europe Market Value (USD Million) Forecast by Sales Route, 2021 to 2036
- Table 21: Eastern Europe Market Value (USD Million) Forecast by Country, 2021 to 2036
- Table 22: Eastern Europe Market Value (USD Million) Forecast by Product, 2021 to 2036
- Table 23: Eastern Europe Market Value (USD Million) Forecast by Application, 2021 to 2036
- Table 24: Eastern Europe Market Value (USD Million) Forecast by End-Use Industry, 2021 to 2036
- Table 25: Eastern Europe Market Value (USD Million) Forecast by Sales Route, 2021 to 2036
- Table 26: East Asia Market Value (USD Million) Forecast by Country, 2021 to 2036
- Table 27: East Asia Market Value (USD Million) Forecast by Product, 2021 to 2036
- Table 28: East Asia Market Value (USD Million) Forecast by Application, 2021 to 2036
- Table 29: East Asia Market Value (USD Million) Forecast by End-Use Industry, 2021 to 2036
- Table 30: East Asia Market Value (USD Million) Forecast by Sales Route, 2021 to 2036
- Table 31: South Asia and Pacific Market Value (USD Million) Forecast by Country, 2021 to 2036
- Table 32: South Asia and Pacific Market Value (USD Million) Forecast by Product, 2021 to 2036
- Table 33: South Asia and Pacific Market Value (USD Million) Forecast by Application, 2021 to 2036
- Table 34: South Asia and Pacific Market Value (USD Million) Forecast by End-Use Industry, 2021 to 2036
- Table 35: South Asia and Pacific Market Value (USD Million) Forecast by Sales Route, 2021 to 2036
- Table 36: Middle East and Africa Market Value (USD Million) Forecast by Country, 2021 to 2036
- Table 37: Middle East and Africa Market Value (USD Million) Forecast by Product, 2021 to 2036
- Table 38: Middle East and Africa Market Value (USD Million) Forecast by Application, 2021 to 2036
- Table 39: Middle East and Africa Market Value (USD Million) Forecast by End-Use Industry, 2021 to 2036
- Table 40: Middle East and Africa Market Value (USD Million) Forecast by Sales Route, 2021 to 2036
List of Figures
- Figure 1: Global Market Pricing Analysis
- Figure 2: Global Market Value (USD Million) Forecast 2021-2036
- Figure 3: Global Market Value Share and BPS Analysis by Product, 2026 and 2036
- Figure 4: Global Market Y-o-Y Growth Comparison by Product, 2026-2036
- Figure 5: Global Market Attractiveness Analysis by Product
- Figure 6: Global Market Value Share and BPS Analysis by Application, 2026 and 2036
- Figure 7: Global Market Y-o-Y Growth Comparison by Application, 2026-2036
- Figure 8: Global Market Attractiveness Analysis by Application
- Figure 9: Global Market Value Share and BPS Analysis by End-Use Industry, 2026 and 2036
- Figure 10: Global Market Y-o-Y Growth Comparison by End-Use Industry, 2026-2036
- Figure 11: Global Market Attractiveness Analysis by End-Use Industry
- Figure 12: Global Market Value Share and BPS Analysis by Sales Route, 2026 and 2036
- Figure 13: Global Market Y-o-Y Growth Comparison by Sales Route, 2026-2036
- Figure 14: Global Market Attractiveness Analysis by Sales Route
- Figure 15: Global Market Value (USD Million) Share and BPS Analysis by Region, 2026 and 2036
- Figure 16: Global Market Y-o-Y Growth Comparison by Region, 2026-2036
- Figure 17: Global Market Attractiveness Analysis by Region
- Figure 18: North America Market Incremental Dollar Opportunity, 2026-2036
- Figure 19: Latin America Market Incremental Dollar Opportunity, 2026-2036
- Figure 20: Western Europe Market Incremental Dollar Opportunity, 2026-2036
- Figure 21: Eastern Europe Market Incremental Dollar Opportunity, 2026-2036
- Figure 22: East Asia Market Incremental Dollar Opportunity, 2026-2036
- Figure 23: South Asia and Pacific Market Incremental Dollar Opportunity, 2026-2036
- Figure 24: Middle East and Africa Market Incremental Dollar Opportunity, 2026-2036
- Figure 25: North America Market Value Share and BPS Analysis by Country, 2026 and 2036
- Figure 26: North America Market Value Share and BPS Analysis by Product, 2026 and 2036
- Figure 27: North America Market Y-o-Y Growth Comparison by Product, 2026-2036
- Figure 28: North America Market Attractiveness Analysis by Product
- Figure 29: North America Market Value Share and BPS Analysis by Application, 2026 and 2036
- Figure 30: North America Market Y-o-Y Growth Comparison by Application, 2026-2036
- Figure 31: North America Market Attractiveness Analysis by Application
- Figure 32: North America Market Value Share and BPS Analysis by End-Use Industry, 2026 and 2036
- Figure 33: North America Market Y-o-Y Growth Comparison by End-Use Industry, 2026-2036
- Figure 34: North America Market Attractiveness Analysis by End-Use Industry
- Figure 35: North America Market Value Share and BPS Analysis by Sales Route, 2026 and 2036
- Figure 36: North America Market Y-o-Y Growth Comparison by Sales Route, 2026-2036
- Figure 37: North America Market Attractiveness Analysis by Sales Route
- Figure 38: Latin America Market Value Share and BPS Analysis by Country, 2026 and 2036
- Figure 39: Latin America Market Value Share and BPS Analysis by Product, 2026 and 2036
- Figure 40: Latin America Market Y-o-Y Growth Comparison by Product, 2026-2036
- Figure 41: Latin America Market Attractiveness Analysis by Product
- Figure 42: Latin America Market Value Share and BPS Analysis by Application, 2026 and 2036
- Figure 43: Latin America Market Y-o-Y Growth Comparison by Application, 2026-2036
- Figure 44: Latin America Market Attractiveness Analysis by Application
- Figure 45: Latin America Market Value Share and BPS Analysis by End-Use Industry, 2026 and 2036
- Figure 46: Latin America Market Y-o-Y Growth Comparison by End-Use Industry, 2026-2036
- Figure 47: Latin America Market Attractiveness Analysis by End-Use Industry
- Figure 48: Latin America Market Value Share and BPS Analysis by Sales Route, 2026 and 2036
- Figure 49: Latin America Market Y-o-Y Growth Comparison by Sales Route, 2026-2036
- Figure 50: Latin America Market Attractiveness Analysis by Sales Route
- Figure 51: Western Europe Market Value Share and BPS Analysis by Country, 2026 and 2036
- Figure 52: Western Europe Market Value Share and BPS Analysis by Product, 2026 and 2036
- Figure 53: Western Europe Market Y-o-Y Growth Comparison by Product, 2026-2036
- Figure 54: Western Europe Market Attractiveness Analysis by Product
- Figure 55: Western Europe Market Value Share and BPS Analysis by Application, 2026 and 2036
- Figure 56: Western Europe Market Y-o-Y Growth Comparison by Application, 2026-2036
- Figure 57: Western Europe Market Attractiveness Analysis by Application
- Figure 58: Western Europe Market Value Share and BPS Analysis by End-Use Industry, 2026 and 2036
- Figure 59: Western Europe Market Y-o-Y Growth Comparison by End-Use Industry, 2026-2036
- Figure 60: Western Europe Market Attractiveness Analysis by End-Use Industry
- Figure 61: Western Europe Market Value Share and BPS Analysis by Sales Route, 2026 and 2036
- Figure 62: Western Europe Market Y-o-Y Growth Comparison by Sales Route, 2026-2036
- Figure 63: Western Europe Market Attractiveness Analysis by Sales Route
- Figure 64: Eastern Europe Market Value Share and BPS Analysis by Country, 2026 and 2036
- Figure 65: Eastern Europe Market Value Share and BPS Analysis by Product, 2026 and 2036
- Figure 66: Eastern Europe Market Y-o-Y Growth Comparison by Product, 2026-2036
- Figure 67: Eastern Europe Market Attractiveness Analysis by Product
- Figure 68: Eastern Europe Market Value Share and BPS Analysis by Application, 2026 and 2036
- Figure 69: Eastern Europe Market Y-o-Y Growth Comparison by Application, 2026-2036
- Figure 70: Eastern Europe Market Attractiveness Analysis by Application
- Figure 71: Eastern Europe Market Value Share and BPS Analysis by End-Use Industry, 2026 and 2036
- Figure 72: Eastern Europe Market Y-o-Y Growth Comparison by End-Use Industry, 2026-2036
- Figure 73: Eastern Europe Market Attractiveness Analysis by End-Use Industry
- Figure 74: Eastern Europe Market Value Share and BPS Analysis by Sales Route, 2026 and 2036
- Figure 75: Eastern Europe Market Y-o-Y Growth Comparison by Sales Route, 2026-2036
- Figure 76: Eastern Europe Market Attractiveness Analysis by Sales Route
- Figure 77: East Asia Market Value Share and BPS Analysis by Country, 2026 and 2036
- Figure 78: East Asia Market Value Share and BPS Analysis by Product, 2026 and 2036
- Figure 79: East Asia Market Y-o-Y Growth Comparison by Product, 2026-2036
- Figure 80: East Asia Market Attractiveness Analysis by Product
- Figure 81: East Asia Market Value Share and BPS Analysis by Application, 2026 and 2036
- Figure 82: East Asia Market Y-o-Y Growth Comparison by Application, 2026-2036
- Figure 83: East Asia Market Attractiveness Analysis by Application
- Figure 84: East Asia Market Value Share and BPS Analysis by End-Use Industry, 2026 and 2036
- Figure 85: East Asia Market Y-o-Y Growth Comparison by End-Use Industry, 2026-2036
- Figure 86: East Asia Market Attractiveness Analysis by End-Use Industry
- Figure 87: East Asia Market Value Share and BPS Analysis by Sales Route, 2026 and 2036
- Figure 88: East Asia Market Y-o-Y Growth Comparison by Sales Route, 2026-2036
- Figure 89: East Asia Market Attractiveness Analysis by Sales Route
- Figure 90: South Asia and Pacific Market Value Share and BPS Analysis by Country, 2026 and 2036
- Figure 91: South Asia and Pacific Market Value Share and BPS Analysis by Product, 2026 and 2036
- Figure 92: South Asia and Pacific Market Y-o-Y Growth Comparison by Product, 2026-2036
- Figure 93: South Asia and Pacific Market Attractiveness Analysis by Product
- Figure 94: South Asia and Pacific Market Value Share and BPS Analysis by Application, 2026 and 2036
- Figure 95: South Asia and Pacific Market Y-o-Y Growth Comparison by Application, 2026-2036
- Figure 96: South Asia and Pacific Market Attractiveness Analysis by Application
- Figure 97: South Asia and Pacific Market Value Share and BPS Analysis by End-Use Industry, 2026 and 2036
- Figure 98: South Asia and Pacific Market Y-o-Y Growth Comparison by End-Use Industry, 2026-2036
- Figure 99: South Asia and Pacific Market Attractiveness Analysis by End-Use Industry
- Figure 100: South Asia and Pacific Market Value Share and BPS Analysis by Sales Route, 2026 and 2036
- Figure 101: South Asia and Pacific Market Y-o-Y Growth Comparison by Sales Route, 2026-2036
- Figure 102: South Asia and Pacific Market Attractiveness Analysis by Sales Route
- Figure 103: Middle East and Africa Market Value Share and BPS Analysis by Country, 2026 and 2036
- Figure 104: Middle East and Africa Market Value Share and BPS Analysis by Product, 2026 and 2036
- Figure 105: Middle East and Africa Market Y-o-Y Growth Comparison by Product, 2026-2036
- Figure 106: Middle East and Africa Market Attractiveness Analysis by Product
- Figure 107: Middle East and Africa Market Value Share and BPS Analysis by Application, 2026 and 2036
- Figure 108: Middle East and Africa Market Y-o-Y Growth Comparison by Application, 2026-2036
- Figure 109: Middle East and Africa Market Attractiveness Analysis by Application
- Figure 110: Middle East and Africa Market Value Share and BPS Analysis by End-Use Industry, 2026 and 2036
- Figure 111: Middle East and Africa Market Y-o-Y Growth Comparison by End-Use Industry, 2026-2036
- Figure 112: Middle East and Africa Market Attractiveness Analysis by End-Use Industry
- Figure 113: Middle East and Africa Market Value Share and BPS Analysis by Sales Route, 2026 and 2036
- Figure 114: Middle East and Africa Market Y-o-Y Growth Comparison by Sales Route, 2026-2036
- Figure 115: Middle East and Africa Market Attractiveness Analysis by Sales Route
- Figure 116: Global Market - Tier Structure Analysis
- Figure 117: Global Market - Company Share Analysis
Frequently Asked Questions
How big is the Aromatic Solvents Market in 2026?
Future Market Insights estimates the global aromatic solvents market at USD 6.5 billion in 2026, projected to reach USD 9.4 billion by 2036.
How fast is the Aromatic Solvents Market expected to grow through 2036?
FMI projects a 3.8% CAGR from 2026 to 2036, taking the global market from USD 6.5 billion in 2026 to USD 9.4 billion by 2036.
Which product segment leads the Aromatic Solvents Market?
Toluene solvent grades lead the product segment with a 28.2% share in 2026, supported by established resin solvency properties and widespread use in industrial formulations.
Which application leads the Aromatic Solvents Market?
Paints and coatings account for 39.2% of the aromatic solvents market in 2026, driven by their use as carriers in formulations requiring specific resin compatibility and drying characteristics.
Which countries are expected to grow fastest in the Aromatic Solvents Market?
Brazil is projected to record the fastest growth at a 4.0% CAGR from 2026 to 2036, followed by South Korea at 2.6% over the same period.
Which companies are profiled in the Aromatic Solvents Market?
The key companies profiled in the aromatic solvents market include ExxonMobil, Shell, Sinopec, Reliance Industries, Idemitsu Kosan, ENEOS, TotalEnergies, Braskem, Lotte Chemical, and Haltermann Carless. Their market positions vary in terms of solvent-grade production and publicly documented product portfolios.
Preview the report firsthand - request a free sample
Get SampleGet the brochure for pricing and purchase details.
Get PDF
