At-home Laser Device Market Outlook for 2024 to 2034

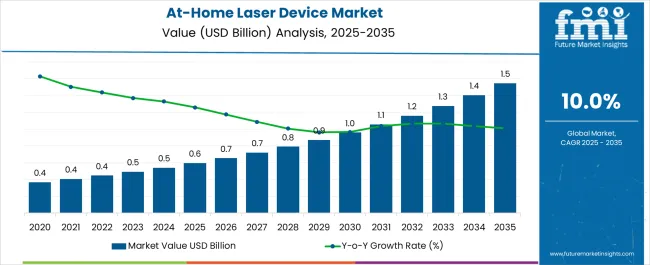
The global at-home laser device sales to exhibit a CAGR of 10.5% from 2024 to 2034. The global at-home laser device market size is projected to increase from US$ 537.1 million in 2024 to US$ 1,458.4 million by 2034. The at-home laser device industry was valued at US$ 485.5 million in 2023 and is anticipated to exhibit Y-o-Y growth of 10.6% in 2024.

Once restricted to dermatology clinics, these laser treatments are now available at home and on a self-treatment basis, owing to technological advancements. Cosmetic laser and light devices are available without a prescription for over-the-counter pain relievers. The fact that at-home laser devices are more affordable than dermatological treatments, which necessitate repeated trips to the doctor, is another reason why the at-home laser equipment market is expanding.

Attributes Details
Market Value for 2024 US$ 537.1 million
Market Value for 2034 US$ 1,458.4 million
Market CAGR from 2024 to 2034 10.5%

Don't pay for what you don't need

Customize your report by selecting specific countries or regions and save 30%!

Growth Prospects for At-home Laser Device Producers

  • Customers seek more convenient at-home options for aesthetic procedures and personal care. The convenience of at-home laser devices as an alternative to salon or clinic visits boosts sales of at-home laser devices.
  • By utilizing technological advancements, at-home laser device manufacturers can enhance the devices' efficacy, safety, and user-friendliness.
  • Stressing the effectiveness and safety of at-home laser devices is essential. Customers can be made to feel more trusting by offering explicit policies, instructional resources, and regulatory compliance.
  • By drawing customers who may be price-conscious but are attracted to the advantages of laser treatments, lowering the cost can expand the at-home laser device market.
  • At-home laser devices can be given credibility, and their efficacy reinforced by partnering with dermatologists and other medical professionals, conducting clinical studies, and promoting the adoption.

Historical vs. Future Analysis of At-home Laser Device Market

The market value for the at-home laser device was around 5.1% of the overall US$ 9.57 billion global hair removal products market in 2023. The at-home laser device sales expanded at a CAGR of 9.8% from 2019 to 2023, owing to the growing focus on self-care.

The demand for medical equipment is rising in sophistication and technology. Most people prefer having all the amenities readily available, as it saves time and is financially feasible.

Patients are increasingly asking for information and procedures that enhance the look of their skin. Since many of the cutting-edge treatments and products have yet to stand the test of time, the ongoing evolution of dermatology raises questions about safety and effectiveness.

Attributes Details
Market Value for 2019 US$ 318.6 million
Market Value for 2023 US$ 485.5 million
Market CAGR from 2019 to 2023 9.8%

For both medicinal and aesthetic purposes, increasing demand for hair reduction methods that are secure, reliable, and efficient has led to an opportunity for the market player to invest in the global laser devices industry. Office-based laser systems have improved epidermal cooling, increased spot sizes and fluencies, and increased repetition rates over the past ten years.

Post-pandemic, women have an increased preference for dermatological and cosmetic procedures that can be carried out at home. This factor may aid in keeping the at-home laser device market attractive in the projected years.

Sabyasachi Ghosh
Sabyasachi Ghosh

Principal Consultant

Talk to Analyst

Find your sweet spots for generating winning opportunities in this market.

Barriers to Consumer Uptake of At-home Laser Technology

  • Considerations related to effectiveness when comparing at-home laser devices to professional treatments. Inadequate outcomes or insufficient advancement may inhibit at-home laser device demand.
  • The cost of at-home laser equipment may fluctuate. Compared with other options, the initial outlay and ongoing maintenance expenses might put off some potential consumers.
  • The limited applicability constrains the potential at-home laser equipment market.
  • Concerns about obsolescence may arise from the rapid advances in technology. If customers think that more sophisticated and newer models may be out soon, they may be reluctant to spend money on at-home laser equipment.
  • Challenges related to regulations and worries about the effectiveness and safety of at-home laser devices could affect the confidence and trust of customers.

Category-wise Outlook

The segmented market analysis of at-home laser device is included in the following subsection. Based on comprehensive studies, the low-energy sector is leading the energy category, and the women segment is commanding the end-use category.

Low-Energy Lasers at the Forefront of Consumer Wellness

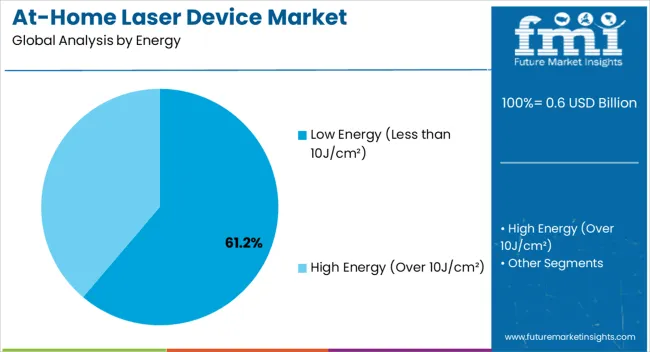
With a share of 76.8% in the global at-home laser equipment market in 2024, low energy (Less than 10J/cm²) is predicted to exhibit strong growth at a CAGR rate of 11.4% by the end of the forecast period.

Leading Segment Low Energy (Less than 10J/cm²)
Segment CAGR 11.4%
Segment Share 76.8%
Leading Segment High Energy (Over 10J/cm²)
Segment CAGR 7.3%
Segment Share 23.2%
  • Low-energy lasers witness rapid consumer adoption, driven by user-friendly design and accessibility.
  • Positioned as a wellness ally, low-energy lasers cater to a diverse range of health and beauty needs.
  • Ongoing innovations enhance low-energy laser capabilities, expanding applications and efficacy.
  • The surge in at-home wellness practices propels the demand for low-energy lasers, emphasizing convenience.

Rising Preference for At-Home Laser Devices by Women Segment Shapes the Industry

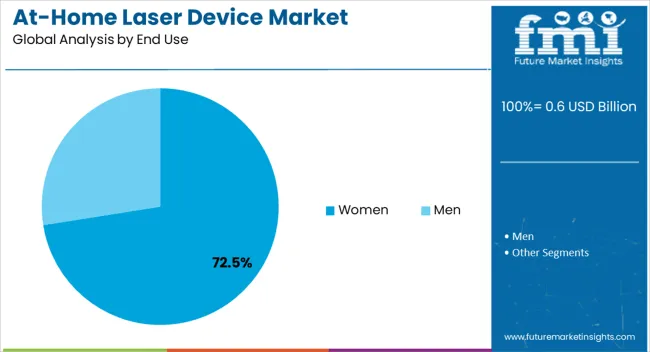
The women segment takes the lead, with a share of 74.8% from 2024 to 2034. The segment is projected to witness a CAGR of 9.4% from 2024 to 2034.

Leading Segment Women
Segment CAGR 9.4%
Segment Share 74.8%
Leading Segment Men
Segment CAGR 13.9%
Segment Share 25.2%
  • The women segment drives demand for at-home laser devices, seeking targeted and personalized wellness solutions.
  • At-home laser devices become an integral part of women's beauty and health fusion.
  • Increasing awareness and education empower women to integrate at-home laser devices into their wellness routines.
  • Market response leads to innovative at-home laser devices catering specifically to women's diverse wellness needs.

Get the data you need at a Fraction of the cost

Personalize your report by choosing insights you need
and save 40%!

Country-wise Analysis

The at-home laser device market can be observed in the subsequent tables, which focus on the leading counties. This section pinpoints the countries with enormous opportunities and growth prospects for at-home laser device manufacturers.

Countries CAGR
United States 5.7%
Australia 6.9%
China 10.8%
India 11.2%
Japan 6.1%

At-home Laser Device Industry in the United States

The at-home laser device industry in the United States is projected to rise at a stable CAGR of 5.7% through 2034.

  • Consumer demand for personalized and convenient beauty solutions, coupled with a preference for non-invasive methods, is fueling the at-home laser hair removal device market in the United States.
  • In the United States, the at-home laser device market is rapidly expanding due to a combination of factors, including rising consumer awareness of skincare and beauty trends and highly tech-savvy consumers.
  • The United States at-home laser hair removal device market is shaped by strict regulations and a competitive environment that prioritizes the efficacy and safety of the products.
  • At-home laser device distribution is aided by e-commerce platforms, which provide consumers in the United States with a large selection and convenient access.

At-home Laser Device Industry in Australia

Australia's at-home laser device industry anticipates substantial growth with a CAGR of 6.9% through 2034.

  • Australia's at-home laser device industry benefits from a health-conscious population, with consumers increasingly seeking personalized and convenient solutions for skincare and beauty needs.
  • The industry's anticipated substantial growth is bolstered by Australia's economic stability, enabling continuous investment in skincare and beauty technologies, making at-home laser devices more accessible to a broader demographic.
  • Supportive healthcare policies and government initiatives contribute to the growth of Australia's at-home laser device industry, creating an environment conducive to innovation, market expansion, and improved accessibility for consumers.

A Rising Middle-Class Fuels Dominance in At-home Laser Device Market in China

The at-home laser device industry in China is forecasted to experience a robust CAGR of 10.8% through 2034.

  • Due to the growing middle class and awareness of personal care, China leads the Asia Pacific at-home laser hair removal device market.
  • In China, the competitive environment for at-home laser devices is shaped by strict regulations and an increasing focus on product safety.
  • The demand for adaptable and effective beauty solutions is reflected in China's strong preference for multifunctional at-home laser devices.

eCommerce Platforms and Beauty Chains Propel Demand for At-home Laser Devices in India

India's at-home laser device industry is poised for remarkable growth, expecting an impressive CAGR of 11.2% through 2034.

  • The Indian at-home laser equipment market is growing due to rising urbanization and disposable income.
  • Profiting from India's retail and digital boom, e-commerce platforms and beauty retail chains are critical for at-home laser device manufacturers.
  • The demand for at-home laser devices that address particular skin types and concerns is driven by cultural factors and beauty norms, which impact consumer preferences.

Japan's At-home Laser Device Market Outlook

The at-home laser device industry in Japan is set for a steady CAGR of 6.1% through 2034.

  • A tech-savvy consumer base looking for high-quality and innovative beauty solutions characterizes Japan's mature at-home laser device industry.
  • In Japan, a holistic approach to skincare and personal care is facilitated by collaboration between manufacturers of at-home laser devices and beauty clinics.
  • Japanese consumers growing emphasis on sustainability and eco-friendly features shapes product development and marketing strategies in the at-home laser device sector.

Competitive Analysis

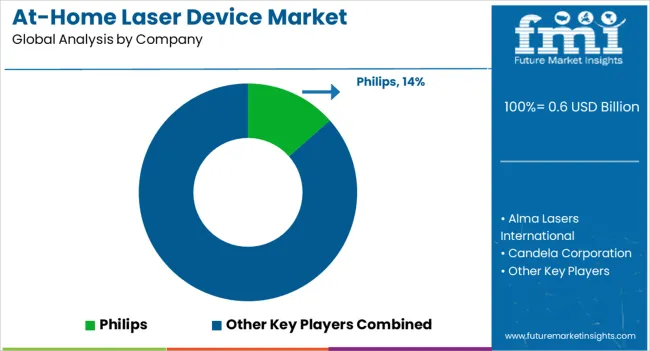
The at-home laser hair removal device market is highly fragmented due to the intense competition in the at-home laser device development industry. The at-home laser device manufacturers are employing partnerships collaborations, and introducing new products to meet customer demand and expand their customer base.

Noteworthy Developments

Company Details
SmoothSkin In March 2023, SmoothSkin, the leading IPL (Intense Pulsed Light) hair removal brand, partnered with Target to distribute its products in stores. Customers may now purchase SmoothSkin'sSmoothSkin's IPL hair removal products on Target.com.
Candela Corporation In April 2023, in an innovative commercial partnership, Candela Corporation, the top global manufacturer of medical aesthetic devices, and Merz Aesthetics, the largest specialized medical aesthetics firm in the world, collaborated to offer one of the largest medical aesthetics collections in the world. The partnership shall launch in North America to expand the device, injectable, and skincare portfolios worldwide, giving clients simple access to full product and support service offerings.

Essential At-home Laser Device Manufacturers

  • Alma Lasers International
  • Candela Corporation
  • CosBeauty
  • Cutera, Inc
  • Cynosure, LLC.
  • Elos Me
  • Fotona d.o.o.
  • LumaRx
  • Lutronic
  • Lynton Lasers Ltd
  • MLAY
  • Philips
  • Reckitt Benckiser Group plc
  • Sciton, Inc
  • Sharplight Technologies Ltd
  • SmoothSkin
  • Solta Medical, Inc
  • The Procter & Gamble Company
  • Tria Beauty
  • Venus Concept
  • Viora

Key Segments

By Energy:

  • Low Energy (Less than 10J/cm²)
  • High Energy (Over 10J/cm²)

By End Use:

  • Women
  • Men

By Distribution Channel:

  • Retail Pharmacies
  • E-commerce
  • Hypermarkets and Supermarkets

By Region:

  • North America
  • Latin America
  • Europe
  • South Asia
  • East Asia
  • Oceania
  • Middle East and Africa (MEA)

Frequently Asked Questions

What is the Current At-home Laser Device Market Valuation?

The at-home laser device market to secure a valuation of US$ 537.1 million in 2024.

How Big Can the At-home Laser Device Market Be by 2034?

The at-home laser equipment market is estimated to reach US$ 1,458.4 million by 2034.

What is the Growth Potential of the At-home Laser Device Market?

Through 2034, the at-home laser device market is anticipated to expand at a 10.5% CAGR.

What Was the Historical Outlook of The At-home Laser Device Market?

From 2019 to 2023, the at-home laser device market recorded a 9.8% CAGR.

Which End-Use Segment to Dominate in the At-home Laser Device Market?

The women's sector is set to garner a market share of 74.8%.

Which Energy Segment to Lead the At-home Laser Device Market?

A 76.8% at-home laser device market share is expected for the low-energy sector.

Table of Content
1. Executive Summary
    1.1. Global Market Outlook
    1.2. Demand Side Trends
    1.3. Supply Side Trends
    1.4. Market Round Offs
    1.5. FMI Analysis and Recommendations
2. Market Overview
    2.1. Market Coverage / Taxonomy
    2.2. Market Definition / Scope / Limitations
3. Market Trends & Dynamics 
    3.1. Per capita spending on At-Home Laser Devices
    3.2. Key Trends Impacting the Market
    3.3. Product Innovation / Development Trends
        3.3.1. Latest Trends and Demands
        3.3.2. Latest Innovations and New Launches
    3.4. Future Prospects of At-Home Laser Devices
    3.5. Market Dynamics
        3.5.1. Drivers
        3.5.2. Restraints
        3.5.3. Opportunity Analysis
4. Value Added Insights
    4.1. Key Industry Developments
    4.2. Regulatory Scenario
    4.3. Key Regulations
    4.4. Payer Mix Analysis
    4.5. Technology Assessment
    4.6. Value Chain Analysis
    4.7. Porter’s Analysis
    4.8. PESTLE Analysis
5. Market Background
    5.1. Macro-Economic Factors
        5.1.1. Global GDP Growth Outlook
        5.1.2. Global Healthcare Outlook
        5.1.3. Global Laser Devices Industry Outlook
    5.2. Forecast Factors - Relevance & Impact
        5.2.1. Top Companies Historical Growth
        5.2.2. Increasing Complexity of Healthcare Operations
        5.2.3. Growing Adoption of At-Home Cosmetic Procedures
        5.2.4. Product Pricing
        5.2.5. Product & Stock Availability
        5.2.6. Rising awareness for Home Hair Removal Devices
        5.2.7. Increasing Technological Advancements in Skin Epilators
6. Global Market Demand Volume (Units) Analysis 2015 to 2022 and Forecast, 2023 to 2033
    6.1. Historical Market Volume (Units) Analysis, 2015 to 2022
    6.2. Current and Future Market Volume (Units) Projections, 2023 to 2033
        6.2.1. Y-o-Y Growth Trend Analysis*Per Capita Consumption
7. Global Market-Pricing Analysis
    7.1. Regional Pricing Analysis By Energy
    7.2. Global Average Pricing Analysis Benchmark
    7.3. Pricing Assumptions
8. Global Market Demand (in Value or Size in US$ Million) Analysis 2015 to 2022 and Forecast, 2023 to 2033
    8.1. Revenue Opportunity Scenario- Likely/Conservative/Optimistic
    8.2. Historical Market Value (US$ Million) Analysis, 2015 to 2022
    8.3. Current and Future Market Value (US$ Million) Projections, 2023 to 2033
        8.3.1. Y-o-Y Growth Trend Analysis
        8.3.2. Absolute $ Opportunity Analysis
9. Global Market Analysis 2015 to 2022 and Forecast 2023 to 2033, By Energy 
    9.1. Introduction / Key Findings
    9.2. Historical Market Size (US$ Million) and Volume (Units) By Energy, 2015 to 2022
    9.3. Current and Future Market Size (US$ Million) and Volume (Units) Analysis and Forecast By Energy, 2023 to 2033
        9.3.1. Low Energy (Less than 10J/cm²)
        9.3.2. High Energy (Over 10J/cm²)
    9.4. Market Attractiveness Analysis By Energy
10. Global Market Analysis 2015 to 2022 and Forecast 2023 to 2033, By End Use
    10.1. Introduction / Key Findings
    10.2. Historical Market Size (US$ Million) Analysis By End Use, 2015 to 2022
    10.3. Current and Future Market Size (US$ Million) Analysis and Forecast By End Use, 2023 to 2033
        10.3.1. Women
        10.3.2. Men
    10.4. Market Attractiveness Analysis By End Use
11. Global Market Analysis 2015 to 2022 and Forecast 2023 to 2033, by Distribution Channel
    11.1. Introduction / Key Findings
    11.2. Historical Market Size (US$ Million) Analysis By Distribution Channel, 2015 to 2022
    11.3. Current and Future Market Size (US$ Million) Analysis and Forecast By Distribution Channel, 2023 to 2033
        11.3.1. Retail Pharmacies
        11.3.2. e-commerce
        11.3.3. Hypermarkets & Supermarkets
    11.4. Market Attractiveness Analysis By Distribution Channel
12. Global Market Analysis 2015 to 2022 and Forecast 2023 to 2033, by Region
    12.1. Introduction
    12.2. Historical Market Size (US$ Million) and Volume (Units) Analysis, By Region, 2015 to 2022
    12.3. Current and Future Market Size (US$ Million) and Volume (Units) Analysis and Forecast By Region, 2023 to 2033
        12.3.1. North America
        12.3.2. Latin America
        12.3.3. Europe
        12.3.4. South Asia
        12.3.5. East Asia
        12.3.6. Oceania
        12.3.7. Middle East & Africa
    12.4. Market Attractiveness Analysis By Region
13. North America Market Analysis 2015 to 2022 and Forecast 2023 to 2033
    13.1. Introduction
    13.2. Historical Market Size (US$ Million) and Volume (Units) Trend Analysis By Market Taxonomy, 2015 to 2022
    13.3. Current and Future Market Size (US$ Million) and Volume (Units) Analysis and Forecast By Market Taxonomy, 2023 to 2033
        13.3.1. By Country
            13.3.1.1. USA
            13.3.1.2. Canada
        13.3.2. By Energy
        13.3.3. By End Use
        13.3.4. By Distribution Channel
    13.4. Market Attractiveness Analysis
        13.4.1. By Country
        13.4.2. By Energy
        13.4.3. By End Use
        13.4.4. By Distribution Channel
    13.5. Market Trends
    13.6. Market Drivers & Restraints – Intensity Mapping
    13.7. Country Level Analysis & Forecast
        13.7.1. USA Market
            13.7.1.1. Introduction
            13.7.1.2. Market Analysis and Forecast by Market Taxonomy
                13.7.1.2.1. By Energy
                13.7.1.2.2. By End Use
                13.7.1.2.3. By Distribution Channel
        13.7.2. Canada Market
            13.7.2.1. Introduction
            13.7.2.2. Market Analysis and Forecast by Market Taxonomy
                13.7.2.2.1. By Energy
                13.7.2.2.2. By End Use
                13.7.2.2.3. By Distribution Channel
14. Latin America Market Analysis 2015 to 2022 and Forecast 2023 to 2033
    14.1. Introduction
    14.2. Historical Market Size (US$ Million) and Volume (Units) Trend Analysis By Market Taxonomy, 2015 to 2022
    14.3. Current and Future Market Size (US$ Million) and Volume (Units) Analysis and Forecast By Market Taxonomy, 2023 to 2033
        14.3.1. By Country
            14.3.1.1. Brazil
            14.3.1.2. Mexico
            14.3.1.3. Argentina
            14.3.1.4. Rest of LATAM
        14.3.2. By Energy
        14.3.3. By End Use
        14.3.4. By Distribution Channel
    14.4. Market Attractiveness Analysis
        14.4.1. By Country
        14.4.2. By Energy
        14.4.3. By End Use
        14.4.4. By Distribution Channel
    14.5. Market Trends
    14.6. Market Drivers & Restraints – Intensity Mapping
    14.7. Country Level Analysis & Forecast
        14.7.1. Brazil Market
            14.7.1.1. Introduction
            14.7.1.2. Market Analysis and Forecast by Market Taxonomy
                14.7.1.2.1. By Energy
                14.7.1.2.2. By End Use
                14.7.1.2.3. By Distribution Channel
        14.7.2. Mexico Market
            14.7.2.1. Introduction
            14.7.2.2. Market Analysis and Forecast by Market Taxonomy
                14.7.2.2.1. By Energy
                14.7.2.2.2. By End Use
                14.7.2.2.3. By Distribution Channel
        14.7.3. Argentina Market
            14.7.3.1. Introduction
            14.7.3.2. Market Analysis and Forecast by Market Taxonomy
                14.7.3.2.1. By Energy
                14.7.3.2.2. By End Use
                14.7.3.2.3. By Distribution Channel
15. Europe Market Analysis 2015 to 2022 and Forecast 2023 to 2033
    15.1. Introduction
    15.2. Historical Market Size (US$ Million) and Volume (Units) Trend Analysis By Market Taxonomy, 2015 to 2022
    15.3. Current and Future Market Size (US$ Million) and Volume (Units) Analysis and Forecast By Market Taxonomy, 2023 to 2033
        15.3.1. By Country
            15.3.1.1. UK
            15.3.1.2. Germany
            15.3.1.3. France
            15.3.1.4. Italy
            15.3.1.5. Spain
            15.3.1.6. BENELUX
            15.3.1.7. Russia
            15.3.1.8. Rest of Europe
        15.3.2. By Energy
        15.3.3. By End Use
        15.3.4. By Distribution Channel
    15.4. Market Attractiveness Analysis
        15.4.1. By Country
        15.4.2. By Energy
        15.4.3. By End Use
        15.4.4. By Distribution Channel
    15.5. Market Trends
    15.6. Market Drivers & Restraints – Intensity Mapping
    15.7. Country Level Analysis & Forecast
        15.7.1. UK Market
            15.7.1.1. Introduction
            15.7.1.2. Market Analysis and Forecast by Market Taxonomy
                15.7.1.2.1. By Energy
                15.7.1.2.2. By End Use
                15.7.1.2.3. By Distribution Channel
        15.7.2. Germany Market
            15.7.2.1. Introduction
            15.7.2.2. Market Analysis and Forecast by Market Taxonomy
                15.7.2.2.1. By Energy
                15.7.2.2.2. By End Use
                15.7.2.2.3. By Distribution Channel
        15.7.3. France Market
            15.7.3.1. Introduction
            15.7.3.2. Market Analysis and Forecast by Market Taxonomy
                15.7.3.2.1. By Energy
                15.7.3.2.2. By End Use
                15.7.3.2.3. By Distribution Channel
        15.7.4. Spain Market
            15.7.4.1. Introduction
            15.7.4.2. Market Analysis and Forecast by Market Taxonomy
                15.7.4.2.1. By Energy
                15.7.4.2.2. By End Use
                15.7.4.2.3. By Distribution Channel
        15.7.5. Italy Market
            15.7.5.1. Introduction
            15.7.5.2. Market Analysis and Forecast by Market Taxonomy
                15.7.5.2.1. By Energy
                15.7.5.2.2. By End Use
                15.7.5.2.3. By Distribution Channel
        15.7.6. BENELUX Market
            15.7.6.1. Introduction
            15.7.6.2. Market Analysis and Forecast by Market Taxonomy
                15.7.6.2.1. By Energy
                15.7.6.2.2. By End Use
                15.7.6.2.3. By Distribution Channel
        15.7.7. Russia Market
            15.7.7.1. Introduction
            15.7.7.2. Market Analysis and Forecast by Market Taxonomy
                15.7.7.2.1. By Energy
                15.7.7.2.2. By End Use
                15.7.7.2.3. By Distribution Channel
16. East Asia Market Analysis 2015 to 2022 and Forecast 2023 to 2033
    16.1. Introduction
    16.2. Historical Market Size (US$ Million) and Volume (Units) Trend Analysis By Market Taxonomy, 2015 to 2022
    16.3. Current and Future Market Size (US$ Million) and Volume (Units) Analysis and Forecast By Market Taxonomy, 2023 to 2033
        16.3.1. By Country
            16.3.1.1. China
            16.3.1.2. Japan
            16.3.1.3. South Korea
        16.3.2. By End Use
        16.3.3. By Distribution Channel
    16.4. Market Attractiveness Analysis
        16.4.1. By Country
        16.4.2. By Energy
        16.4.3. By End Use
        16.4.4. By Distribution Channel
    16.5. Market Trends
    16.6. Market Drivers & Restraints – Intensity Mapping
    16.7. Country Level Analysis & Forecast
        16.7.1. China Market
            16.7.1.1. Introduction
            16.7.1.2. Market Analysis and Forecast by Market Taxonomy
                16.7.1.2.1. By Energy
                16.7.1.2.2. By End Use
                16.7.1.2.3. By Distribution Channel
        16.7.2. Japan Market
            16.7.2.1. Introduction
            16.7.2.2. Market Analysis and Forecast by Market Taxonomy
                16.7.2.2.1. By Energy
                16.7.2.2.2. By End Use
                16.7.2.2.3. By Distribution Channel
        16.7.3. South Korea Market
            16.7.3.1. Introduction
            16.7.3.2. Market Analysis and Forecast by Market Taxonomy
                16.7.3.2.1. By Energy
                16.7.3.2.2. By End Use
                16.7.3.2.3. By Distribution Channel
17. South Asia Market Analysis 2015 to 2022 and Forecast 2023 to 2033
    17.1. Introduction
    17.2. Historical Market Size (US$ Million) and Volume (Units) Trend Analysis By Market Taxonomy, 2015 to 2022
    17.3. Current and Future Market Size (US$ Million) and Volume (Units) Analysis and Forecast By Market Taxonomy, 2023 to 2033
        17.3.1. By Country
            17.3.1.1. India
            17.3.1.2. Indonesia
            17.3.1.3. Thailand
            17.3.1.4. Malaysia
            17.3.1.5. Rest of South Asia
        17.3.2. By Energy
        17.3.3. By End Use
        17.3.4. By Distribution Channel
    17.4. Market Attractiveness Analysis
        17.4.1. By Country
        17.4.2. By Energy
        17.4.3. By End Use
        17.4.4. By Distribution Channel
    17.5. Market Trends
    17.6. Market Drivers & Restraints – Intensity Mapping
    17.7. Country Level Analysis & Forecast
        17.7.1. India Market
            17.7.1.1. Introduction
            17.7.1.2. Market Analysis and Forecast by Market Taxonomy
                17.7.1.2.1. By Energy
                17.7.1.2.2. By End Use
                17.7.1.2.3. By Distribution Channel
        17.7.2. Indonesia Market
            17.7.2.1. Introduction
            17.7.2.2. Market Analysis and Forecast by Market Taxonomy
                17.7.2.2.1. By Energy
                17.7.2.2.2. By End Use
                17.7.2.2.3. By Distribution Channel
        17.7.3. Thailand Market
            17.7.3.1. Introduction
            17.7.3.2. Market Analysis and Forecast by Market Taxonomy
                17.7.3.2.1. By Energy
                17.7.3.2.2. By End Use
                17.7.3.2.3. By Distribution Channel
        17.7.4. Malaysia Market
            17.7.4.1. Introduction
            17.7.4.2. Market Analysis and Forecast by Market Taxonomy
                17.7.4.2.1. By Energy
                17.7.4.2.2. By End Use
                17.7.4.2.3. By Distribution Channel
18. Oceania Market Analysis 2015 to 2022 and Forecast 2023 to 2033
    18.1. Introduction
    18.2. Historical Market Size (US$ Million) and Volume (Units) Trend Analysis By Market Taxonomy, 2015 to 2022
    18.3. Current and Future Market Size (US$ Million) and Volume (Units) Analysis and Forecast By Market Taxonomy, 2023 to 2033
        18.3.1. By Country
            18.3.1.1. Australia
            18.3.1.2. New Zealand
        18.3.2. By Energy
        18.3.3. By End Use
        18.3.4. By Distribution Channel
    18.4. Market Attractiveness Analysis
        18.4.1. By Country
        18.4.2. By Energy
        18.4.3. By End Use
        18.4.4. By Distribution Channel
    18.5. Market Trends
    18.6. Market Drivers & Restraints – Intensity Mapping
    18.7. Country Level Analysis & Forecast
        18.7.1. Australia Market
            18.7.1.1. Introduction
            18.7.1.2. Market Analysis and Forecast by Market Taxonomy
                18.7.1.2.1. By Energy
                18.7.1.2.2. By End Use
                18.7.1.2.3. By Distribution Channel
        18.7.2. New Zealand Market
            18.7.2.1. Introduction
            18.7.2.2. Market Analysis and Forecast by Market Taxonomy
                18.7.2.2.1. By Energy
                18.7.2.2.2. By End Use
                18.7.2.2.3. By Distribution Channel
19. Middle East & Africa Market Analysis 2015 to 2022 and Forecast 2023 to 2033
    19.1. Introduction
    19.2. Historical Market Size (US$ Million) and Volume (Units) Trend Analysis By Market Taxonomy, 2015 to 2022
    19.3. Current and Future Market Size (US$ Million) and Volume (Units) Analysis and Forecast By Market Taxonomy, 2023 to 2033
        19.3.1. By Country
            19.3.1.1. GCC Countries
            19.3.1.2. Türkiye
            19.3.1.3. South Africa
            19.3.1.4. North Africa
            19.3.1.5. Rest of MEA
        19.3.2. By Energy
        19.3.3. By End Use
        19.3.4. By Distribution Channel
    19.4. Market Attractiveness Analysis
        19.4.1. By Country
        19.4.2. By Energy
        19.4.3. By End Use
        19.4.4. By Distribution Channel
    19.5. Market Trends
    19.6. Market Drivers & Restraints – Intensity Mapping
    19.7. Country Level Analysis & Forecast
        19.7.1. GCC Countries Market
            19.7.1.1. Introduction
            19.7.1.2. Market Analysis and Forecast by Market Taxonomy
                19.7.1.2.1. By Energy
                19.7.1.2.2. By End Use
                19.7.1.2.3. By Distribution Channel
        19.7.2. Türkiye Market
            19.7.2.1. Introduction
            19.7.2.2. Market Analysis and Forecast by Market Taxonomy
                19.7.2.2.1. By Energy
                19.7.2.2.2. By End Use
                19.7.2.2.3. By Distribution Channel
        19.7.3. South Africa Market
            19.7.3.1. Introduction
            19.7.3.2. Market Analysis and Forecast by Market Taxonomy
                19.7.3.2.1. By Energy
                19.7.3.2.2. By End Use
                19.7.3.2.3. By Distribution Channel
        19.7.4. North Africa Market
            19.7.4.1. Introduction
            19.7.4.2. Market Analysis and Forecast by Market Taxonomy
                19.7.4.2.1. By Energy
                19.7.4.2.2. By End Use
                19.7.4.2.3. By Distribution Channel
20. Market Structure Analysis
    20.1. Market Analysis by Tier of Companies
    20.2. Market Share Analysis of Top Players
    20.3. Market Concentration
21. Competition Analysis
    21.1. Competition Dashboard
    21.2. Branding and Promotional Strategies, By Key Players
    21.3. Key Development Analysis
    21.4. Competition Deep Dive
        21.4.1. Alma Lasers International
            21.4.1.1. Overview
            21.4.1.2. Product Portfolio
            21.4.1.3. Key Financials
            21.4.1.4. SWOT Analysis
            21.4.1.5. Key Developments
            21.4.1.6. Sales Footprint
            21.4.1.7. Strategy Overview
                21.4.1.7.1. Marketing Strategy
                21.4.1.7.2. Product Strategy
                21.4.1.7.3. Channel Strategy
        21.4.2. Candela Corporation
        21.4.3. CosBeauty
        21.4.4. Cutera, Inc.
        21.4.5. Cynosure, LLC.
        21.4.6. Elos Me
        21.4.7. Fotona d.o.o.
        21.4.8. LumaRx
        21.4.9. Lutronic
        21.4.10. Lynton Lasers Ltd
        21.4.11. MLAY
        21.4.12. Philips
        21.4.13. Reckitt Benckiser Group plc
        21.4.14. Sciton, Inc
        21.4.15. Sharplight Technologies Ltd
        21.4.16. SmoothSkin
        21.4.17. Solta Medical, Inc
        21.4.18. The Procter & Gamble Company
        21.4.19. Tria Beauty
        21.4.20. Venus Concept
        21.4.21. Viora
22. Assumptions and Acronyms Used
23. Research Methodology
Recommendations

Healthcare

Laser Therapy Devices Market

May 2023

REP-GB-5241

250 pages

Explore Healthcare Insights

View Reports
Future Market Insights

At-Home Laser Device Market

Schedule a Call