Reports

- Global Locations -

Headquarters

Future Market Insights, Inc.

Christiana Corporate, 200
Continental Drive, Suite 401,
Newark, Delaware - 19713,
United States

T: +1-845-579-5705

Americas

Future Market Insights, Inc.

616 Corporate Way, Suite 2-9018,
Valley Cottage, NY 10989, United States

T: +1-347-918-3531

MEA

Future Market Insights

1602-6 Jumeirah Bay X2 Tower, Plot No: JLT-PH2-X2A,
Jumeirah Lakes Towers, Dubai,
United Arab Emirates

Europe

Future Market Insights

3rd Floor, 207 Regent Street,
W1B 3HH London
United Kingdom

T: + 44 (0) 20 8123 9659
D: +44 (0) 20 3287 4268

Asia Pacific

Future Market Insights

IndiaLand Global Tech Park, Unit UG-1, Behind Grand HighStreet, Phase 1, Hinjawadi, MH, Pune – 411057, India

Automotive Infotainment SoCs Market Outlook

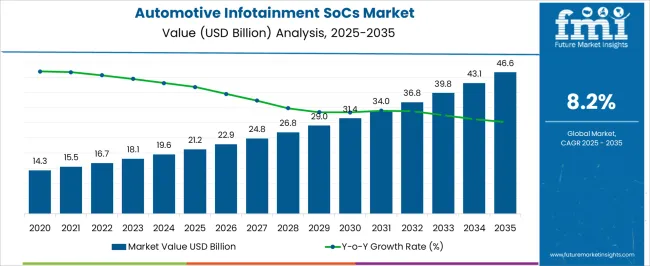
The automotive infotainment SoCs market is capturing a valuation of US$ 18.2 billion in 2023 and is predicted to reach US$ 40.1 billion by 2033. The market is registering a CAGR of 8.2% during the forecast period. The market is driven by several factors, including:

  • Consumer Demand: There is a notably growing consumer demand for infotainment in a car, such as navigation, sound, video, and communication tools. The rising seamless connectivity and several dashboard features impel the market growth further.
  • Technology Advancement: The rising advanced technologies such as machine learning, the Internet of Things, Artificial Intelligence, and augmented reality fuel market growth.
  • Convenience and Safe: The manufacturers are developing safe and convenient automotive infotainment features, including advanced driver assistance systems and voice recognition. These features alert drivers on specific steps while advancing market growth.
  • Growing Demand for Autonomous: The growing popularity of autonomous and electric vehicle cars among consumers is surging the market growth.
  • Increasing Competition: The market is highly competitive, and manufacturers continuously focus on innovating new products to attract consumers. With the rising adoption of advanced technologies, these manufacturers are significantly growing the market size.

Cybersecurity Concerns and High Costs Limit the Market Growth

Apart from influencing factors, the market has several restraining factors that may limit market growth. These are:

  • High Cost: The increasing prices of automotive infotainment SoCs with adding an advanced feature may limit the market growth. The adoption of this highly advanced infotainment is lacking in mid-range vehicles due to high prices.
  • Cybersecurity Concerns: The rising cybersecurity risks among consumers decline the market growth. The increasing data hacking and breaches compromise consumers' privacy, which may restrain market growth.
  • The Complexity of Integration: The advanced automotive infotainment system is not designed or made for vehicles. Therefore, the advancement of infotainment systems can be challenging with a lot of complexity.
  • Short Lifecycles: The manufacturer frequently launches products with new models and features in the automotive industry. It can create several challenges due to the latest vehicle model with short product lifecycles.
  • Regulatory Compliance: Infotainment systems are widely regulatory requirements, including privacy laws, safety standards, etc. These regulations are expensive and complex, which may limit the demand for automotive infotainment systems.
Attributes Details
Market CAGR (2023 to 2033) 8.2%
Market Valuation (2023) US$ 18.1 billion
Market Valuation (2033) US$ 40.1 billion

Don't pay for what you don't need

Customize your report by selecting specific countries or regions and save 30%!

Automotive Infotainment SoCs Market, 2018 to 2022 Historical Sales, Compared to 2023 to 2033 Future Outlook

The market is notably growing due to its various features, including video, connectivity, voice recognition, etc. According to Future Market Insights, the market was valued at US$ 13.4 billion in 2018 and is expected to reach US$ 40.1 billion by 2033.

The growing consumer demand for automotive infotainment testing in Asia is capturing a relevant share by 2033. The rising consumers demand luxury and premium vehicles with amazing automatic dashboard features is surging the market size. The increasing demand for connected cars, present manufacturers, and the huge population are driving the market growth in Asia Pacific countries.

  • Short-term (2023 to 2026): The increasing demand for electric cars, infotainment systems with advanced features, growing population, and urbanization fuels the market growth. Countries in Asia such as China and India are contributing a key role in the market due to the significantly growing automotive sector.
  • Medium-term (2026 to 2029): Growing manufacturers, product innovation, and development of advanced technologies in-car infotainment systems drive the market growth. The manufacturers are developing safe and efficient features that attract users' demand and generate huge revenue.
  • Long-term (2029 to 2033): Rising government initiatives and investing huge amounts in research and development activities are advancing the market size. The rising automotive industry in developing countries such as China, Brazil, and India drives market opportunities.

Comparative Analysis of Adjacent Markets

Automotive Infotainment SoCs Market:

Attributes Automotive Infotainment SoCs Market
CAGR (2023 to 2033) 8.2%
Value (2023) US$ 18.1 billion
Value (2033) US$ 40.1 billion
Trends Growing demand for autonomous infotainment systems, and connected cars.
Opportunities Growing innovation of new products, advanced technologies features, and expanding automotive sector.

Autonomous Vehicles Market:

Attributes Autonomous Vehicles Market
CAGR (2023 to 2033) 10.9%
Value (2023) US$ 39.04 billion
Value (2033) US$ 109.86 billion
Trends Rising demand for self-driving cars, advanced sensor features, and adoption of LIDAR technologies.
Opportunities Rising huge investments, government funding, and rapid digital infrastructure.

Automotive Test Equipment Market:

Attributes Automotive Test Equipment Market
CAGR (2023 to 2033) 16.2%
Value (2023) US$ 3.6 billion
Value (2033) US$ 16.16 billion
Trends Increasing demand for the safety and security of vehicles, and inspection for best performance.
Opportunities The growing automotive sector, rising demand for electric vehicles, and manufacturers' focus on sustainability to reduce pollution.
Sudip Saha
Sudip Saha

Principal Consultant

Talk to Analyst

Find your sweet spots for generating winning opportunities in this market.

The Top Categories Advancing the Global Market are

Passenger Vehicle is Highly Sought-after in the Global Market

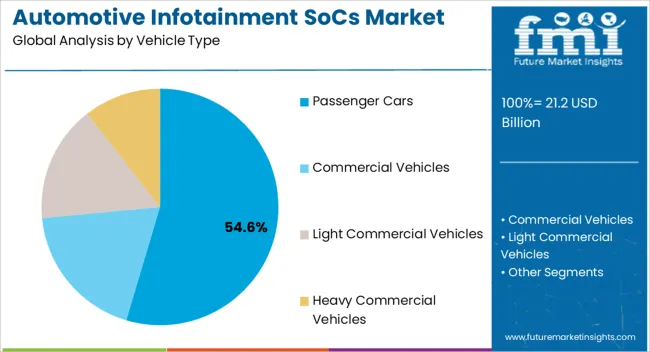
Based on vehicle type, passenger cars dominate the global market by capturing a maximum share of 81.2% during the forecast period. Passenger cars are widely growing due to the increasing population and rising number of passengers for traveling purposes.

There is growing public transportation from various passenger cars, including SUVs, sedans, and others. These cars are stylish, comfortable, and convenient, bolstering the market growth.

The Commercial vehicle is another category capturing a significant share during the forecast period. These commercial vehicles include buses and trucks. These vehicles are sufficient and capable of transporting goods and passengers from one place to another.

The rising popularity of electric vehicles has been notably growing in recent times. The government takes several measures to control air pollution and focus on sustainability. Overall, passenger cars are contributing a prominent role in the global market by 2033.

Infotainment Systems Application Leading the Global Market

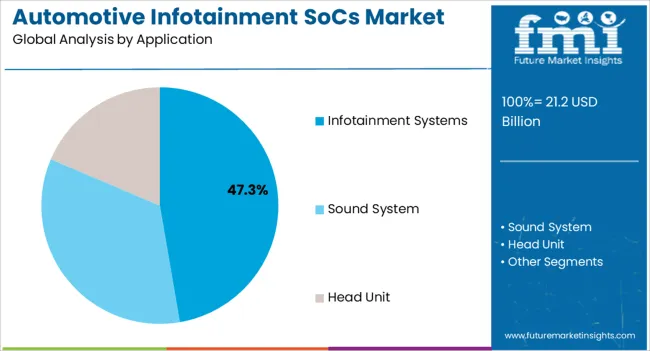
Based on application, infotainment systems are a significant category anticipated to secure a share of 63.4% by 2033. The rising demand for infotainment systems is due to their advanced features, such as internet connectivity, navigation, free-hand calling, and audio playback. These features enhance consumers' experiences and make them easy to access.

The manufacturers are implementing advanced technology in the infotainment systems to integrate features such as Heating, Ventilation, and Air Conditioning. However, the global market continues to expand with the growing demand for connected infotainment systems.
Influencing Countries in the Global Market are

Rising Demand for Automotive Infotainment SoCs Upsurge the United States Market

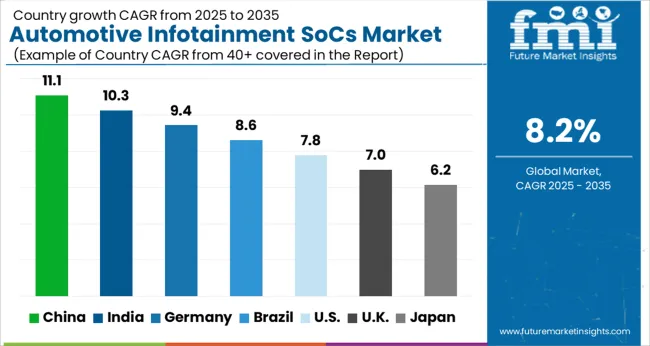
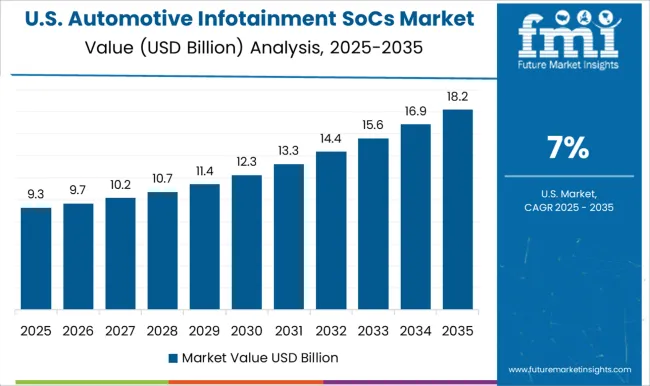
The United States is leading the global market by capturing 22.6% of the share by 2033. The growing automotive industry and rising demand for premium cars drive the United States market. The manufacturers are growing their production due to the rising demand for connected cars with advanced technologies in infotainment systems.

The various key players in the United States are expanding the market revenue, including Texas Instruments Inc, STMicroelectronics, NXP Semiconductors, and Intel Corporation. These key companies invest huge amounts in research and development activities to innovate unique products with technical advancements.

Growing Demand for Luxury Cars Drive the United Kingdom Market

The United Kingdom is one of the growing nations estimated to capture a share of 9.2% by 2033. The growing consumer demand for premium, stylish, and luxury cars are advancing the market growth further. The manufacturers are developing products that meet consumers' requirements. The United Kingdom is a key exporter of high-quality infotainment systems in international markets.

Manufacturers are developing and improving efficiency and reducing costs by adopting technologies such as artificial intelligence, automation, and machine learning. The government of the United Kingdom is focused on sustainability to reduce environmental impacts. Therefore, the United Kingdom has developed environment-friendly electric cars that reduce waste and control air pollution.

Increasing Adoption of Connected Cars Uplifts China Market Growth

China is one of the significant nations in the global market that register a share of 8.5% during the forecast period. The notably growing automotive industry and demand for SUVs are increasing the sales of automotive infotainment SoCs in the country. China is hugely invested in research and development activities to develop a unique and improved product to increase market growth.

The government of China is producing better-advanced technologies by collaborating with prominent players in the market. The key players in the market include Infineon Technologies AG, MediaTek Inc, and Rockchip Electronics Co. Ltd. The rising consumer demand for automated and connected cars are fueling China's automotive infotainment SoCs market.

How is India Capturing Huge Revenue in the Global Market?

India is another Asia Pacific nation anticipated to capture a share of 10.6% by 2033. India is contributing a significant revenue by several factors, including:

  • Technical Experts: India has a wide number of professionals and technical experts fond of the latest technologies widely used in the automotive sector. These experts are developing cutting-edge solutions to expand the market size.
  • Low Manufacturing Cost: In India, the labor and manufacturing cost is low compared to other nations. It helps key companies to stay competitive in the market.
  • Innovations: The key companies are investing millions of dollars in market research to develop better products in the automotive sector.
  • Government Supports: The government of India launched various initiatives to increase the production of automotive and electronic sectors. These initiatives helped to expand the business at the international level.

Several key players that capture the maximum revenue in India’s automotive infotainment SoCs market are Wipro, Sasken Technologies, and Tata Elxsi.

Get the data you need at a Fraction of the cost

Personalize your report by choosing insights you need
and save 40%!

How can Manufacturers Expand the Global market?

The manufacturers are adopting several marketing strategies to expand the global market. A few of them are as follows:
  • Improve Performance: Manufacturers are focused on improving the functionality and performance of automotive infotainment SoCs products. It includes several better features, power efficiency, and power efficiency.
  • Low Costs: Manufacturers are expanding the market by reducing their product prices. It can be done by using low material costs and manufacturing processes.
  • Better Security: Manufacturers can provide users security to avoid cyber threats, stolen data, and other illegal activities.
  • Custom Solutions: Manufacturers can develop custom solutions with automakers to satisfy their requirements and meet product satisfaction.

Competitive Landscape

The market is highly competitive by key players from regions. These key players contribute to the global market through innovations and marketing skills. These players adopt several marketing methodologies such as mergers, acquisitions, partnerships, product launches, and agreements.

Other Essential Players in the Global Market are:

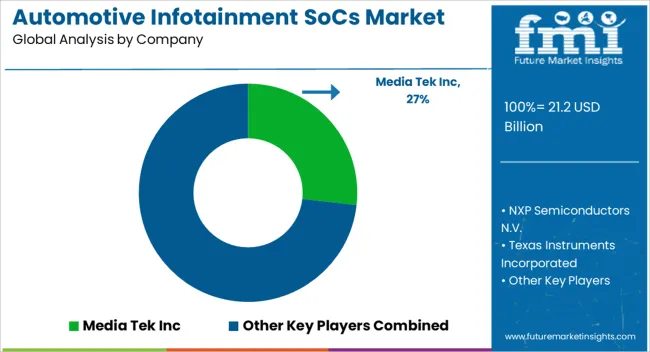
  • Media Tek Inc
  • NXP Semiconductors N.V.
  • Texas Instruments Incorporated
  • Intel Corporation
  • Infineon Technologies Inc
  • Qualcomm Technologies Inc
  • Renesas Electronics Corporation
  • NVIDIA Corporation
  • Microchip Technologu Inc
  • STMicroelectronics N.V.

Recent Developments in the Global Automotive Infotainment SoCs Market are:

  • In 2021, Qualcomm Technologies launched its new product Snapdragon Automotive Cockpit. This new product featured technologies such as high-speed connectivity and artificial intelligence, with multiple cameras.
  • In 2021, NXP Semiconductors introduced its new product BlueBox 3.0 platform, to support the driving system. It includes advanced sensor data with machine learning algorithms.
  • In 2020, Automotive Grade Linux announced open source soft that improves security and flexibility with reducing cost.
  • In 2021, Texas Instruments announced its Jacinto 7 processor for advanced driver assistance systems. It includes 3D graphics, machine learning, artificial intelligence, and high-resolution displays.
  • In 2022, Intel launched its Atom x6000E series, designed for the industrial and automotive sectors.
  • In 2020, NXP Semiconductors introduced its I.MX 8M Plus processor. It can enhance security features and advanced voice controllers with machine learning capabilities.

Scope of Report

Attribute Details
Forecast Period 2023 to 2033
Historical Data Available for 2018 to 2022
Market Analysis US$ billion for Value
Key Countries Covered The United States, The United Kingdom, Japan, India, China
Key Segments Covered
  • Application
  • Vehicle Type
  • Region
Key Companies Profiled
  • Media Tek Inc
  • NXP Semiconductors N.V.
  • Texas Instruments Incorporated
  • Intel Corporation
  • Infineon Technologies Inc
  • Qualcomm Technologies Inc
  • Renesas Electronics Corporation
  • NVIDIA Corporation
  • Microchip Technologu Inc
  • STMicroelectronics N.V.
Report Coverage Market Forecast, Company Share Analysis, Competition Intelligence, DROT Analysis, Market Dynamics and Challenges, and Strategic Growth Initiatives
Customization & Pricing Available upon Request

Automotive Infotainment SoCs Market by Category

By Vehicle Type:

  • Passenger Cars
  • Commercial Vehicles
  • Light Commercial Vehicles
  • Heavy Commercial Vehicles

By Application:

  • Infotainment Systems
  • Sound System
  • Head Unit

Region:

  • North America
  • Europe
  • Latin America
  • Asia Pacific
  • Middle East Africa

Frequently Asked Questions

What is the Size of The Market?

In 2023, the market is expected to be worth US$ 18.2 billion.

What is the Market Share for the United Kingdom?

By 2033, the United Kingdom is anticipated to dominate a 9.2% market share.

What is the Market Growth Forecast from 2023 to 2033?

The market is expected to continue growth at an 8.2% CAGR until 2033.

What is the Share of the United States market?

By acquiring 22.6% of the market by 2033, the United States will continue to dominate the top spot.

How Big Will the Market be by 2033?

The market is expected to be around US$ 40.1 billion by 2033.

Table of Content

1. Executive Summary | Automotive Infotainment SoCs Market 

    1.1. Global Market Outlook

    1.2. Demand-side Trends

    1.3. Supply-side Trends

    1.4. Technology Roadmap Analysis

    1.5. Analysis and Recommendations

2. Market Overview

    2.1. Market Coverage / Taxonomy

    2.2. Market Definition / Scope / Limitations

3. Market Background

    3.1. Market Dynamics

        3.1.1. Drivers

        3.1.2. Restraints

        3.1.3. Opportunity

        3.1.4. Trends

    3.2. Scenario Forecast

        3.2.1. Demand in Optimistic Scenario

        3.2.2. Demand in Likely Scenario

        3.2.3. Demand in Conservative Scenario

    3.3. Opportunity Map Analysis

    3.4. Investment Feasibility Matrix

    3.5. PESTLE and Porter’s Analysis

    3.6. Regulatory Landscape

        3.6.1. By Key Regions

        3.6.2. By Key Countries

    3.7. Regional Parent Market Outlook

4. Global Market Analysis 2018 to 2022 and Forecast, 2023 to 2033

    4.1. Historical Market Size Value (US$ Million) Analysis, 2018 to 2022

    4.2. Current and Future Market Size Value (US$ Million) Projections, 2023 to 2033

        4.2.1. Y-o-Y Growth Trend Analysis

        4.2.2. Absolute $ Opportunity Analysis

5. Global Market Analysis 2018 to 2022 and Forecast 2023 to 2033, By Installation Type

    5.1. Introduction / Key Findings

    5.2. Historical Market Size Value (US$ Million) Analysis By Installation Type, 2018 to 2022

    5.3. Current and Future Market Size Value (US$ Million) Analysis and Forecast By Installation Type, 2023 to 2033

        5.3.1. In-dash

        5.3.2. Rear Seat

    5.4. Y-o-Y Growth Trend Analysis By Installation Type, 2018 to 2022

    5.5. Absolute $ Opportunity Analysis By Installation Type, 2023 to 2033

6. Global Market Analysis 2018 to 2022 and Forecast 2023 to 2033, By Vehicle Type

    6.1. Introduction / Key Findings

    6.2. Historical Market Size Value (US$ Million) Analysis By Vehicle Type, 2018 to 2022

    6.3. Current and Future Market Size Value (US$ Million) Analysis and Forecast By Vehicle Type, 2023 to 2033

        6.3.1. Passenger Cars

        6.3.2. Commercial Vehicles

        6.3.3. Light Commercial Vehicles

        6.3.4. Heavy Commercial Vehicles

    6.4. Y-o-Y Growth Trend Analysis By Vehicle Type, 2018 to 2022

    6.5. Absolute $ Opportunity Analysis By Vehicle Type, 2023 to 2033

7. Global Market Analysis 2018 to 2022 and Forecast 2023 to 2033, By Application

    7.1. Introduction / Key Findings

    7.2. Historical Market Size Value (US$ Million) Analysis By Application, 2018 to 2022

    7.3. Current and Future Market Size Value (US$ Million) Analysis and Forecast By Application, 2023 to 2033

        7.3.1. Head Unit

        7.3.2. eCockpit

        7.3.3. Sound System

        7.3.4. Others

    7.4. Y-o-Y Growth Trend Analysis By Application, 2018 to 2022

    7.5. Absolute $ Opportunity Analysis By Application, 2023 to 2033

8. Global Market Analysis 2018 to 2022 and Forecast 2023 to 2033, By Region

    8.1. Introduction

    8.2. Historical Market Size Value (US$ Million) Analysis By Region, 2018 to 2022

    8.3. Current Market Size Value (US$ Million) Analysis and Forecast By Region, 2023 to 2033

        8.3.1. North America

        8.3.2. Latin America

        8.3.3. Europe

        8.3.4. South Asia

        8.3.5. East Asia

        8.3.6. Oceania

        8.3.7. MEA

    8.4. Market Attractiveness Analysis By Region

9. North America Market Analysis 2018 to 2022 and Forecast 2023 to 2033, By Country

    9.1. Historical Market Size Value (US$ Million) Trend Analysis By Market Taxonomy, 2018 to 2022

    9.2. Market Size Value (US$ Million) Forecast By Market Taxonomy, 2023 to 2033

        9.2.1. By Country

            9.2.1.1. The USA

            9.2.1.2. Canada

        9.2.2. By Installation Type

        9.2.3. By Vehicle Type

        9.2.4. By Application

    9.3. Market Attractiveness Analysis

        9.3.1. By Country

        9.3.2. By Installation Type

        9.3.3. By Vehicle Type

        9.3.4. By Application

    9.4. Key Takeaways

10. Latin America Market Analysis 2018 to 2022 and Forecast 2023 to 2033, By Country

    10.1. Historical Market Size Value (US$ Million) Trend Analysis By Market Taxonomy, 2018 to 2022

    10.2. Market Size Value (US$ Million) Forecast By Market Taxonomy, 2023 to 2033

        10.2.1. By Country

            10.2.1.1. Brazil

            10.2.1.2. Mexico

            10.2.1.3. Rest of Latin America

        10.2.2. By Installation Type

        10.2.3. By Vehicle Type

        10.2.4. By Application

    10.3. Market Attractiveness Analysis

        10.3.1. By Country

        10.3.2. By Installation Type

        10.3.3. By Vehicle Type

        10.3.4. By Application

    10.4. Key Takeaways

11. Europe Market Analysis 2018 to 2022 and Forecast 2023 to 2033, By Country

    11.1. Historical Market Size Value (US$ Million) Trend Analysis By Market Taxonomy, 2018 to 2022

    11.2. Market Size Value (US$ Million) Forecast By Market Taxonomy, 2023 to 2033

        11.2.1. By Country

            11.2.1.1. Germany

            11.2.1.2. United Kingdom

            11.2.1.3. France

            11.2.1.4. Spain

            11.2.1.5. Italy

            11.2.1.6. Rest of Europe

        11.2.2. By Installation Type

        11.2.3. By Vehicle Type

        11.2.4. By Application

    11.3. Market Attractiveness Analysis

        11.3.1. By Country

        11.3.2. By Installation Type

        11.3.3. By Vehicle Type

        11.3.4. By Application

    11.4. Key Takeaways

12. South Asia Market Analysis 2018 to 2022 and Forecast 2023 to 2033, By Country

    12.1. Historical Market Size Value (US$ Million) Trend Analysis By Market Taxonomy, 2018 to 2022

    12.2. Market Size Value (US$ Million) Forecast By Market Taxonomy, 2023 to 2033

        12.2.1. By Country

            12.2.1.1. India

            12.2.1.2. Malaysia

            12.2.1.3. Singapore

            12.2.1.4. Thailand

            12.2.1.5. Rest of South Asia

        12.2.2. By Installation Type

        12.2.3. By Vehicle Type

        12.2.4. By Application

    12.3. Market Attractiveness Analysis

        12.3.1. By Country

        12.3.2. By Installation Type

        12.3.3. By Vehicle Type

        12.3.4. By Application

    12.4. Key Takeaways

13. East Asia Market Analysis 2018 to 2022 and Forecast 2023 to 2033, By Country

    13.1. Historical Market Size Value (US$ Million) Trend Analysis By Market Taxonomy, 2018 to 2022

    13.2. Market Size Value (US$ Million) Forecast By Market Taxonomy, 2023 to 2033

        13.2.1. By Country

            13.2.1.1. China

            13.2.1.2. Japan

            13.2.1.3. South Korea

        13.2.2. By Installation Type

        13.2.3. By Vehicle Type

        13.2.4. By Application

    13.3. Market Attractiveness Analysis

        13.3.1. By Country

        13.3.2. By Installation Type

        13.3.3. By Vehicle Type

        13.3.4. By Application

    13.4. Key Takeaways

14. Oceania Market Analysis 2018 to 2022 and Forecast 2023 to 2033, By Country

    14.1. Historical Market Size Value (US$ Million) Trend Analysis By Market Taxonomy, 2018 to 2022

    14.2. Market Size Value (US$ Million) Forecast By Market Taxonomy, 2023 to 2033

        14.2.1. By Country

            14.2.1.1. Australia

            14.2.1.2. New Zealand

        14.2.2. By Installation Type

        14.2.3. By Vehicle Type

        14.2.4. By Application

    14.3. Market Attractiveness Analysis

        14.3.1. By Country

        14.3.2. By Installation Type

        14.3.3. By Vehicle Type

        14.3.4. By Application

    14.4. Key Takeaways

15. MEA Market Analysis 2018 to 2022 and Forecast 2023 to 2033, By Country

    15.1. Historical Market Size Value (US$ Million) Trend Analysis By Market Taxonomy, 2018 to 2022

    15.2. Market Size Value (US$ Million) Forecast By Market Taxonomy, 2023 to 2033

        15.2.1. By Country

            15.2.1.1. GCC Countries

            15.2.1.2. South Africa

            15.2.1.3. Israel

            15.2.1.4. Rest of MEA

        15.2.2. By Installation Type

        15.2.3. By Vehicle Type

        15.2.4. By Application

    15.3. Market Attractiveness Analysis

        15.3.1. By Country

        15.3.2. By Installation Type

        15.3.3. By Vehicle Type

        15.3.4. By Application

    15.4. Key Takeaways

16. Key Countries Market Analysis

    16.1. USA

        16.1.1. Pricing Analysis

        16.1.2. Market Share Analysis, 2022

            16.1.2.1. By Installation Type

            16.1.2.2. By Vehicle Type

            16.1.2.3. By Application

    16.2. Canada

        16.2.1. Pricing Analysis

        16.2.2. Market Share Analysis, 2022

            16.2.2.1. By Installation Type

            16.2.2.2. By Vehicle Type

            16.2.2.3. By Application

    16.3. Brazil

        16.3.1. Pricing Analysis

        16.3.2. Market Share Analysis, 2022

            16.3.2.1. By Installation Type

            16.3.2.2. By Vehicle Type

            16.3.2.3. By Application

    16.4. Mexico

        16.4.1. Pricing Analysis

        16.4.2. Market Share Analysis, 2022

            16.4.2.1. By Installation Type

            16.4.2.2. By Vehicle Type

            16.4.2.3. By Application

    16.5. Germany

        16.5.1. Pricing Analysis

        16.5.2. Market Share Analysis, 2022

            16.5.2.1. By Installation Type

            16.5.2.2. By Vehicle Type

            16.5.2.3. By Application

    16.6. United Kingdom

        16.6.1. Pricing Analysis

        16.6.2. Market Share Analysis, 2022

            16.6.2.1. By Installation Type

            16.6.2.2. By Vehicle Type

            16.6.2.3. By Application

    16.7. France

        16.7.1. Pricing Analysis

        16.7.2. Market Share Analysis, 2022

            16.7.2.1. By Installation Type

            16.7.2.2. By Vehicle Type

            16.7.2.3. By Application

    16.8. Spain

        16.8.1. Pricing Analysis

        16.8.2. Market Share Analysis, 2022

            16.8.2.1. By Installation Type

            16.8.2.2. By Vehicle Type

            16.8.2.3. By Application

    16.9. Italy

        16.9.1. Pricing Analysis

        16.9.2. Market Share Analysis, 2022

            16.9.2.1. By Installation Type

            16.9.2.2. By Vehicle Type

            16.9.2.3. By Application

    16.10. India

        16.10.1. Pricing Analysis

        16.10.2. Market Share Analysis, 2022

            16.10.2.1. By Installation Type

            16.10.2.2. By Vehicle Type

            16.10.2.3. By Application

    16.11. Malaysia

        16.11.1. Pricing Analysis

        16.11.2. Market Share Analysis, 2022

            16.11.2.1. By Installation Type

            16.11.2.2. By Vehicle Type

            16.11.2.3. By Application

    16.12. Singapore

        16.12.1. Pricing Analysis

        16.12.2. Market Share Analysis, 2022

            16.12.2.1. By Installation Type

            16.12.2.2. By Vehicle Type

            16.12.2.3. By Application

    16.13. Thailand

        16.13.1. Pricing Analysis

        16.13.2. Market Share Analysis, 2022

            16.13.2.1. By Installation Type

            16.13.2.2. By Vehicle Type

            16.13.2.3. By Application

    16.14. China

        16.14.1. Pricing Analysis

        16.14.2. Market Share Analysis, 2022

            16.14.2.1. By Installation Type

            16.14.2.2. By Vehicle Type

            16.14.2.3. By Application

    16.15. Japan

        16.15.1. Pricing Analysis

        16.15.2. Market Share Analysis, 2022

            16.15.2.1. By Installation Type

            16.15.2.2. By Vehicle Type

            16.15.2.3. By Application

    16.16. South Korea

        16.16.1. Pricing Analysis

        16.16.2. Market Share Analysis, 2022

            16.16.2.1. By Installation Type

            16.16.2.2. By Vehicle Type

            16.16.2.3. By Application

    16.17. Australia

        16.17.1. Pricing Analysis

        16.17.2. Market Share Analysis, 2022

            16.17.2.1. By Installation Type

            16.17.2.2. By Vehicle Type

            16.17.2.3. By Application

    16.18. New Zealand

        16.18.1. Pricing Analysis

        16.18.2. Market Share Analysis, 2022

            16.18.2.1. By Installation Type

            16.18.2.2. By Vehicle Type

            16.18.2.3. By Application

    16.19. GCC Countries

        16.19.1. Pricing Analysis

        16.19.2. Market Share Analysis, 2022

            16.19.2.1. By Installation Type

            16.19.2.2. By Vehicle Type

            16.19.2.3. By Application

    16.20. South Africa

        16.20.1. Pricing Analysis

        16.20.2. Market Share Analysis, 2022

            16.20.2.1. By Installation Type

            16.20.2.2. By Vehicle Type

            16.20.2.3. By Application

    16.21. Israel

        16.21.1. Pricing Analysis

        16.21.2. Market Share Analysis, 2022

            16.21.2.1. By Installation Type

            16.21.2.2. By Vehicle Type

            16.21.2.3. By Application

17. Market Structure Analysis

    17.1. Competition Dashboard

    17.2. Competition Benchmarking

    17.3. Market Share Analysis of Top Players

        17.3.1. By Regional

        17.3.2. By Installation Type

        17.3.3. By Vehicle Type

        17.3.4. By Application

18. Competition Analysis

    18.1. Competition Deep Dive

        18.1.1. Infineon Technologies AG

            18.1.1.1. Overview

            18.1.1.2. Product Portfolio

            18.1.1.3. Profitability by Market Segments

            18.1.1.4. Sales Footprint

            18.1.1.5. Strategy Overview

                18.1.1.5.1. Marketing Strategy

        18.1.2. Intel Corporation

            18.1.2.1. Overview

            18.1.2.2. Product Portfolio

            18.1.2.3. Profitability by Market Segments

            18.1.2.4. Sales Footprint

            18.1.2.5. Strategy Overview

                18.1.2.5.1. Marketing Strategy

        18.1.3. NEC Corporation

            18.1.3.1. Overview

            18.1.3.2. Product Portfolio

            18.1.3.3. Profitability by Market Segments

            18.1.3.4. Sales Footprint

            18.1.3.5. Strategy Overview

                18.1.3.5.1. Marketing Strategy

        18.1.4. NVIDIA Corporation

            18.1.4.1. Overview

            18.1.4.2. Product Portfolio

            18.1.4.3. Profitability by Market Segments

            18.1.4.4. Sales Footprint

            18.1.4.5. Strategy Overview

                18.1.4.5.1. Marketing Strategy

        18.1.5. NXP Semiconductors N.V.

            18.1.5.1. Overview

            18.1.5.2. Product Portfolio

            18.1.5.3. Profitability by Market Segments

            18.1.5.4. Sales Footprint

            18.1.5.5. Strategy Overview

                18.1.5.5.1. Marketing Strategy

        18.1.6. Qualcomm Incorporated

            18.1.6.1. Overview

            18.1.6.2. Product Portfolio

            18.1.6.3. Profitability by Market Segments

            18.1.6.4. Sales Footprint

            18.1.6.5. Strategy Overview

                18.1.6.5.1. Marketing Strategy

        18.1.7. Renesas Electronics Corporation

            18.1.7.1. Overview

            18.1.7.2. Product Portfolio

            18.1.7.3. Profitability by Market Segments

            18.1.7.4. Sales Footprint

            18.1.7.5. Strategy Overview

                18.1.7.5.1. Marketing Strategy

        18.1.8. STMicroelectronics N.V.

            18.1.8.1. Overview

            18.1.8.2. Product Portfolio

            18.1.8.3. Profitability by Market Segments

            18.1.8.4. Sales Footprint

            18.1.8.5. Strategy Overview

                18.1.8.5.1. Marketing Strategy

        18.1.9. Texas Instruments Incorporated

            18.1.9.1. Overview

            18.1.9.2. Product Portfolio

            18.1.9.3. Profitability by Market Segments

            18.1.9.4. Sales Footprint

            18.1.9.5. Strategy Overview

                18.1.9.5.1. Marketing Strategy

        18.1.10. Semiconductor Components Industries

            18.1.10.1. Overview

            18.1.10.2. Product Portfolio

            18.1.10.3. Profitability by Market Segments

            18.1.10.4. Sales Footprint

            18.1.10.5. Strategy Overview

                18.1.10.5.1. Marketing Strategy

19. Assumptions & Acronyms Used

20. Research Methodology

Don't pay for what you don't need

Customize your report by selecting specific countries or regions and save 30%!

List of Tables

Table 1: Global Market Value (US$ Million) Forecast by Region, 2018 to 2033

Table 2: Global Market Value (US$ Million) Forecast by Installation Type, 2018 to 2033

Table 3: Global Market Value (US$ Million) Forecast by Vehicle Type, 2018 to 2033

Table 4: Global Market Value (US$ Million) Forecast by Application, 2018 to 2033

Table 5: North America Market Value (US$ Million) Forecast by Country, 2018 to 2033

Table 6: North America Market Value (US$ Million) Forecast by Installation Type, 2018 to 2033

Table 7: North America Market Value (US$ Million) Forecast by Vehicle Type, 2018 to 2033

Table 8: North America Market Value (US$ Million) Forecast by Application, 2018 to 2033

Table 9: Latin America Market Value (US$ Million) Forecast by Country, 2018 to 2033

Table 10: Latin America Market Value (US$ Million) Forecast by Installation Type, 2018 to 2033

Table 11: Latin America Market Value (US$ Million) Forecast by Vehicle Type, 2018 to 2033

Table 12: Latin America Market Value (US$ Million) Forecast by Application, 2018 to 2033

Table 13: Europe Market Value (US$ Million) Forecast by Country, 2018 to 2033

Table 14: Europe Market Value (US$ Million) Forecast by Installation Type, 2018 to 2033

Table 15: Europe Market Value (US$ Million) Forecast by Vehicle Type, 2018 to 2033

Table 16: Europe Market Value (US$ Million) Forecast by Application, 2018 to 2033

Table 17: South Asia Market Value (US$ Million) Forecast by Country, 2018 to 2033

Table 18: South Asia Market Value (US$ Million) Forecast by Installation Type, 2018 to 2033

Table 19: South Asia Market Value (US$ Million) Forecast by Vehicle Type, 2018 to 2033

Table 20: South Asia Market Value (US$ Million) Forecast by Application, 2018 to 2033

Table 21: East Asia Market Value (US$ Million) Forecast by Country, 2018 to 2033

Table 22: East Asia Market Value (US$ Million) Forecast by Installation Type, 2018 to 2033

Table 23: East Asia Market Value (US$ Million) Forecast by Vehicle Type, 2018 to 2033

Table 24: East Asia Market Value (US$ Million) Forecast by Application, 2018 to 2033

Table 25: Oceania Market Value (US$ Million) Forecast by Country, 2018 to 2033

Table 26: Oceania Market Value (US$ Million) Forecast by Installation Type, 2018 to 2033

Table 27: Oceania Market Value (US$ Million) Forecast by Vehicle Type, 2018 to 2033

Table 28: Oceania Market Value (US$ Million) Forecast by Application, 2018 to 2033

Table 29: MEA Market Value (US$ Million) Forecast by Country, 2018 to 2033

Table 30: MEA Market Value (US$ Million) Forecast by Installation Type, 2018 to 2033

Table 31: MEA Market Value (US$ Million) Forecast by Vehicle Type, 2018 to 2033

Table 32: MEA Market Value (US$ Million) Forecast by Application, 2018 to 2033
Sudip Saha
Sudip Saha

Principal Consultant

Talk to Analyst

Find your sweet spots for generating winning opportunities in this market.

List of Charts

Figure 1: Global Market Value (US$ Million) by Installation Type, 2023 to 2033

Figure 2: Global Market Value (US$ Million) by Vehicle Type, 2023 to 2033

Figure 3: Global Market Value (US$ Million) by Application, 2023 to 2033

Figure 4: Global Market Value (US$ Million) by Region, 2023 to 2033

Figure 5: Global Market Value (US$ Million) Analysis by Region, 2018 to 2033

Figure 6: Global Market Value Share (%) and BPS Analysis by Region, 2023 to 2033

Figure 7: Global Market Y-o-Y Growth (%) Projections by Region, 2023 to 2033

Figure 8: Global Market Value (US$ Million) Analysis by Installation Type, 2018 to 2033

Figure 9: Global Market Value Share (%) and BPS Analysis by Installation Type, 2023 to 2033

Figure 10: Global Market Y-o-Y Growth (%) Projections by Installation Type, 2023 to 2033

Figure 11: Global Market Value (US$ Million) Analysis by Vehicle Type, 2018 to 2033

Figure 12: Global Market Value Share (%) and BPS Analysis by Vehicle Type, 2023 to 2033

Figure 13: Global Market Y-o-Y Growth (%) Projections by Vehicle Type, 2023 to 2033

Figure 14: Global Market Value (US$ Million) Analysis by Application, 2018 to 2033

Figure 15: Global Market Value Share (%) and BPS Analysis by Application, 2023 to 2033

Figure 16: Global Market Y-o-Y Growth (%) Projections by Application, 2023 to 2033

Figure 17: Global Market Attractiveness by Installation Type, 2023 to 2033

Figure 18: Global Market Attractiveness by Vehicle Type, 2023 to 2033

Figure 19: Global Market Attractiveness by Application, 2023 to 2033

Figure 20: Global Market Attractiveness by Region, 2023 to 2033

Figure 21: North America Market Value (US$ Million) by Installation Type, 2023 to 2033

Figure 22: North America Market Value (US$ Million) by Vehicle Type, 2023 to 2033

Figure 23: North America Market Value (US$ Million) by Application, 2023 to 2033

Figure 24: North America Market Value (US$ Million) by Country, 2023 to 2033

Figure 25: North America Market Value (US$ Million) Analysis by Country, 2018 to 2033

Figure 26: North America Market Value Share (%) and BPS Analysis by Country, 2023 to 2033

Figure 27: North America Market Y-o-Y Growth (%) Projections by Country, 2023 to 2033

Figure 28: North America Market Value (US$ Million) Analysis by Installation Type, 2018 to 2033

Figure 29: North America Market Value Share (%) and BPS Analysis by Installation Type, 2023 to 2033

Figure 30: North America Market Y-o-Y Growth (%) Projections by Installation Type, 2023 to 2033

Figure 31: North America Market Value (US$ Million) Analysis by Vehicle Type, 2018 to 2033

Figure 32: North America Market Value Share (%) and BPS Analysis by Vehicle Type, 2023 to 2033

Figure 33: North America Market Y-o-Y Growth (%) Projections by Vehicle Type, 2023 to 2033

Figure 34: North America Market Value (US$ Million) Analysis by Application, 2018 to 2033

Figure 35: North America Market Value Share (%) and BPS Analysis by Application, 2023 to 2033

Figure 36: North America Market Y-o-Y Growth (%) Projections by Application, 2023 to 2033

Figure 37: North America Market Attractiveness by Installation Type, 2023 to 2033

Figure 38: North America Market Attractiveness by Vehicle Type, 2023 to 2033

Figure 39: North America Market Attractiveness by Application, 2023 to 2033

Figure 40: North America Market Attractiveness by Country, 2023 to 2033

Figure 41: Latin America Market Value (US$ Million) by Installation Type, 2023 to 2033

Figure 42: Latin America Market Value (US$ Million) by Vehicle Type, 2023 to 2033

Figure 43: Latin America Market Value (US$ Million) by Application, 2023 to 2033

Figure 44: Latin America Market Value (US$ Million) by Country, 2023 to 2033

Figure 45: Latin America Market Value (US$ Million) Analysis by Country, 2018 to 2033

Figure 46: Latin America Market Value Share (%) and BPS Analysis by Country, 2023 to 2033

Figure 47: Latin America Market Y-o-Y Growth (%) Projections by Country, 2023 to 2033

Figure 48: Latin America Market Value (US$ Million) Analysis by Installation Type, 2018 to 2033

Figure 49: Latin America Market Value Share (%) and BPS Analysis by Installation Type, 2023 to 2033

Figure 50: Latin America Market Y-o-Y Growth (%) Projections by Installation Type, 2023 to 2033

Figure 51: Latin America Market Value (US$ Million) Analysis by Vehicle Type, 2018 to 2033

Figure 52: Latin America Market Value Share (%) and BPS Analysis by Vehicle Type, 2023 to 2033

Figure 53: Latin America Market Y-o-Y Growth (%) Projections by Vehicle Type, 2023 to 2033

Figure 54: Latin America Market Value (US$ Million) Analysis by Application, 2018 to 2033

Figure 55: Latin America Market Value Share (%) and BPS Analysis by Application, 2023 to 2033

Figure 56: Latin America Market Y-o-Y Growth (%) Projections by Application, 2023 to 2033

Figure 57: Latin America Market Attractiveness by Installation Type, 2023 to 2033

Figure 58: Latin America Market Attractiveness by Vehicle Type, 2023 to 2033

Figure 59: Latin America Market Attractiveness by Application, 2023 to 2033

Figure 60: Latin America Market Attractiveness by Country, 2023 to 2033

Figure 61: Europe Market Value (US$ Million) by Installation Type, 2023 to 2033

Figure 62: Europe Market Value (US$ Million) by Vehicle Type, 2023 to 2033

Figure 63: Europe Market Value (US$ Million) by Application, 2023 to 2033

Figure 64: Europe Market Value (US$ Million) by Country, 2023 to 2033

Figure 65: Europe Market Value (US$ Million) Analysis by Country, 2018 to 2033

Figure 66: Europe Market Value Share (%) and BPS Analysis by Country, 2023 to 2033

Figure 67: Europe Market Y-o-Y Growth (%) Projections by Country, 2023 to 2033

Figure 68: Europe Market Value (US$ Million) Analysis by Installation Type, 2018 to 2033

Figure 69: Europe Market Value Share (%) and BPS Analysis by Installation Type, 2023 to 2033

Figure 70: Europe Market Y-o-Y Growth (%) Projections by Installation Type, 2023 to 2033

Figure 71: Europe Market Value (US$ Million) Analysis by Vehicle Type, 2018 to 2033

Figure 72: Europe Market Value Share (%) and BPS Analysis by Vehicle Type, 2023 to 2033

Figure 73: Europe Market Y-o-Y Growth (%) Projections by Vehicle Type, 2023 to 2033

Figure 74: Europe Market Value (US$ Million) Analysis by Application, 2018 to 2033

Figure 75: Europe Market Value Share (%) and BPS Analysis by Application, 2023 to 2033

Figure 76: Europe Market Y-o-Y Growth (%) Projections by Application, 2023 to 2033

Figure 77: Europe Market Attractiveness by Installation Type, 2023 to 2033

Figure 78: Europe Market Attractiveness by Vehicle Type, 2023 to 2033

Figure 79: Europe Market Attractiveness by Application, 2023 to 2033

Figure 80: Europe Market Attractiveness by Country, 2023 to 2033

Figure 81: South Asia Market Value (US$ Million) by Installation Type, 2023 to 2033

Figure 82: South Asia Market Value (US$ Million) by Vehicle Type, 2023 to 2033

Figure 83: South Asia Market Value (US$ Million) by Application, 2023 to 2033

Figure 84: South Asia Market Value (US$ Million) by Country, 2023 to 2033

Figure 85: South Asia Market Value (US$ Million) Analysis by Country, 2018 to 2033

Figure 86: South Asia Market Value Share (%) and BPS Analysis by Country, 2023 to 2033

Figure 87: South Asia Market Y-o-Y Growth (%) Projections by Country, 2023 to 2033

Figure 88: South Asia Market Value (US$ Million) Analysis by Installation Type, 2018 to 2033

Figure 89: South Asia Market Value Share (%) and BPS Analysis by Installation Type, 2023 to 2033

Figure 90: South Asia Market Y-o-Y Growth (%) Projections by Installation Type, 2023 to 2033

Figure 91: South Asia Market Value (US$ Million) Analysis by Vehicle Type, 2018 to 2033

Figure 92: South Asia Market Value Share (%) and BPS Analysis by Vehicle Type, 2023 to 2033

Figure 93: South Asia Market Y-o-Y Growth (%) Projections by Vehicle Type, 2023 to 2033

Figure 94: South Asia Market Value (US$ Million) Analysis by Application, 2018 to 2033

Figure 95: South Asia Market Value Share (%) and BPS Analysis by Application, 2023 to 2033

Figure 96: South Asia Market Y-o-Y Growth (%) Projections by Application, 2023 to 2033

Figure 97: South Asia Market Attractiveness by Installation Type, 2023 to 2033

Figure 98: South Asia Market Attractiveness by Vehicle Type, 2023 to 2033

Figure 99: South Asia Market Attractiveness by Application, 2023 to 2033

Figure 100: South Asia Market Attractiveness by Country, 2023 to 2033

Figure 101: East Asia Market Value (US$ Million) by Installation Type, 2023 to 2033

Figure 102: East Asia Market Value (US$ Million) by Vehicle Type, 2023 to 2033

Figure 103: East Asia Market Value (US$ Million) by Application, 2023 to 2033

Figure 104: East Asia Market Value (US$ Million) by Country, 2023 to 2033

Figure 105: East Asia Market Value (US$ Million) Analysis by Country, 2018 to 2033

Figure 106: East Asia Market Value Share (%) and BPS Analysis by Country, 2023 to 2033

Figure 107: East Asia Market Y-o-Y Growth (%) Projections by Country, 2023 to 2033

Figure 108: East Asia Market Value (US$ Million) Analysis by Installation Type, 2018 to 2033

Figure 109: East Asia Market Value Share (%) and BPS Analysis by Installation Type, 2023 to 2033

Figure 110: East Asia Market Y-o-Y Growth (%) Projections by Installation Type, 2023 to 2033

Figure 111: East Asia Market Value (US$ Million) Analysis by Vehicle Type, 2018 to 2033

Figure 112: East Asia Market Value Share (%) and BPS Analysis by Vehicle Type, 2023 to 2033

Figure 113: East Asia Market Y-o-Y Growth (%) Projections by Vehicle Type, 2023 to 2033

Figure 114: East Asia Market Value (US$ Million) Analysis by Application, 2018 to 2033

Figure 115: East Asia Market Value Share (%) and BPS Analysis by Application, 2023 to 2033

Figure 116: East Asia Market Y-o-Y Growth (%) Projections by Application, 2023 to 2033

Figure 117: East Asia Market Attractiveness by Installation Type, 2023 to 2033

Figure 118: East Asia Market Attractiveness by Vehicle Type, 2023 to 2033

Figure 119: East Asia Market Attractiveness by Application, 2023 to 2033

Figure 120: East Asia Market Attractiveness by Country, 2023 to 2033

Figure 121: Oceania Market Value (US$ Million) by Installation Type, 2023 to 2033

Figure 122: Oceania Market Value (US$ Million) by Vehicle Type, 2023 to 2033

Figure 123: Oceania Market Value (US$ Million) by Application, 2023 to 2033

Figure 124: Oceania Market Value (US$ Million) by Country, 2023 to 2033

Figure 125: Oceania Market Value (US$ Million) Analysis by Country, 2018 to 2033

Figure 126: Oceania Market Value Share (%) and BPS Analysis by Country, 2023 to 2033

Figure 127: Oceania Market Y-o-Y Growth (%) Projections by Country, 2023 to 2033

Figure 128: Oceania Market Value (US$ Million) Analysis by Installation Type, 2018 to 2033

Figure 129: Oceania Market Value Share (%) and BPS Analysis by Installation Type, 2023 to 2033

Figure 130: Oceania Market Y-o-Y Growth (%) Projections by Installation Type, 2023 to 2033

Figure 131: Oceania Market Value (US$ Million) Analysis by Vehicle Type, 2018 to 2033

Figure 132: Oceania Market Value Share (%) and BPS Analysis by Vehicle Type, 2023 to 2033

Figure 133: Oceania Market Y-o-Y Growth (%) Projections by Vehicle Type, 2023 to 2033

Figure 134: Oceania Market Value (US$ Million) Analysis by Application, 2018 to 2033

Figure 135: Oceania Market Value Share (%) and BPS Analysis by Application, 2023 to 2033

Figure 136: Oceania Market Y-o-Y Growth (%) Projections by Application, 2023 to 2033

Figure 137: Oceania Market Attractiveness by Installation Type, 2023 to 2033

Figure 138: Oceania Market Attractiveness by Vehicle Type, 2023 to 2033

Figure 139: Oceania Market Attractiveness by Application, 2023 to 2033

Figure 140: Oceania Market Attractiveness by Country, 2023 to 2033

Figure 141: MEA Market Value (US$ Million) by Installation Type, 2023 to 2033

Figure 142: MEA Market Value (US$ Million) by Vehicle Type, 2023 to 2033

Figure 143: MEA Market Value (US$ Million) by Application, 2023 to 2033

Figure 144: MEA Market Value (US$ Million) by Country, 2023 to 2033

Figure 145: MEA Market Value (US$ Million) Analysis by Country, 2018 to 2033

Figure 146: MEA Market Value Share (%) and BPS Analysis by Country, 2023 to 2033

Figure 147: MEA Market Y-o-Y Growth (%) Projections by Country, 2023 to 2033

Figure 148: MEA Market Value (US$ Million) Analysis by Installation Type, 2018 to 2033

Figure 149: MEA Market Value Share (%) and BPS Analysis by Installation Type, 2023 to 2033

Figure 150: MEA Market Y-o-Y Growth (%) Projections by Installation Type, 2023 to 2033

Figure 151: MEA Market Value (US$ Million) Analysis by Vehicle Type, 2018 to 2033

Figure 152: MEA Market Value Share (%) and BPS Analysis by Vehicle Type, 2023 to 2033

Figure 153: MEA Market Y-o-Y Growth (%) Projections by Vehicle Type, 2023 to 2033

Figure 154: MEA Market Value (US$ Million) Analysis by Application, 2018 to 2033

Figure 155: MEA Market Value Share (%) and BPS Analysis by Application, 2023 to 2033

Figure 156: MEA Market Y-o-Y Growth (%) Projections by Application, 2023 to 2033

Figure 157: MEA Market Attractiveness by Installation Type, 2023 to 2033

Figure 158: MEA Market Attractiveness by Vehicle Type, 2023 to 2033

Figure 159: MEA Market Attractiveness by Application, 2023 to 2033

Figure 160: MEA Market Attractiveness by Country, 2023 to 2033

Recommendations

Automotive

Automotive Test Equipment Market

Published : October 2022

Automotive

Asia Pacific In-Car Entertainment System Market

Published : September 2022

Explore Technology Insights

View Reports

Automotive Infotainment SoCs Market