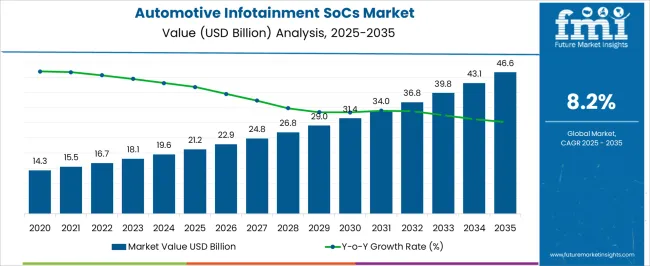
The Automotive Infotainment SoCs Market is estimated to be valued at USD 21.2 billion in 2025 and is projected to reach USD 46.6 billion by 2035, registering a compound annual growth rate (CAGR) of 8.2% over the forecast period.
| Metric | Value |
|---|---|
| Automotive Infotainment SoCs Market Estimated Value in (2025 E) | USD 21.2 billion |
| Automotive Infotainment SoCs Market Forecast Value in (2035 F) | USD 46.6 billion |
| Forecast CAGR (2025 to 2035) | 8.2% |
The automotive infotainment SoCs market is expanding rapidly owing to the growing integration of advanced electronics in vehicles and rising consumer expectations for connected and personalized in car experiences. Increasing demand for real time navigation, multimedia streaming, and seamless smartphone connectivity has positioned infotainment systems as a core feature in modern vehicles.
Technological advancements in system on chips including higher processing power, AI integration, and enhanced graphics performance are enabling immersive and interactive in vehicle environments. The push for autonomous and semi autonomous driving has further strengthened the role of infotainment as a critical interface for driver assistance and passenger engagement.
Additionally, government initiatives promoting vehicle safety and connectivity standards are encouraging wider adoption of infotainment SoCs. The market outlook remains strong as automotive OEMs increasingly differentiate offerings through sophisticated infotainment platforms that align with consumer lifestyle preferences and mobility trends.
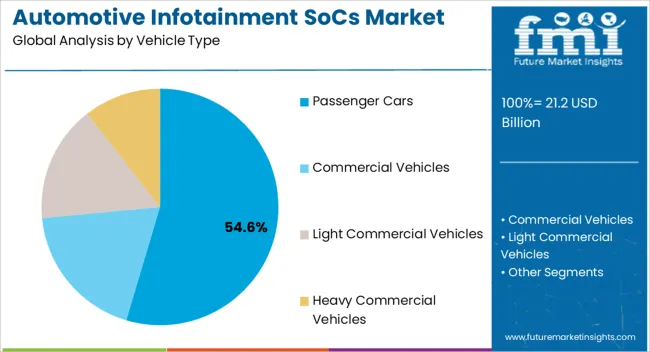
The passenger cars segment is projected to hold 54.60% of the total market revenue by 2025 under the vehicle type category, making it the dominant segment. This growth is being driven by rising consumer preference for enhanced in car entertainment, navigation, and connectivity features that improve overall driving experience.
Passenger cars are witnessing rapid integration of infotainment SoCs due to growing competition among OEMs to deliver technologically advanced models. The increasing penetration of mid and premium range cars equipped with sophisticated infotainment platforms has further supported adoption.
As urban mobility expands and consumer lifestyles demand always connected ecosystems, passenger cars continue to lead the segment by setting benchmarks in infotainment integration and innovation.
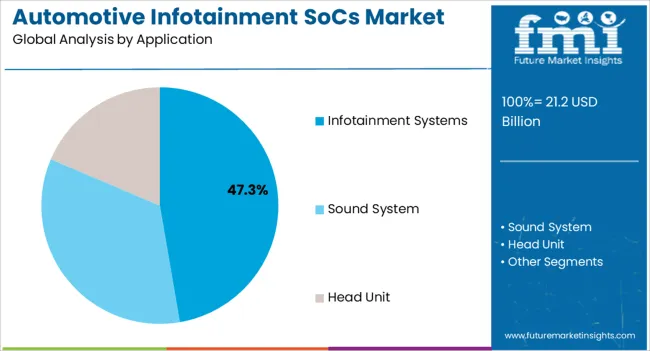
The infotainment systems application segment is expected to account for 47.30% of total revenue by 2025, positioning it as the leading application area. This growth is driven by the rising demand for real time entertainment, navigation support, and smartphone synchronization in vehicles.
Infotainment systems have become the central hub for managing connectivity, voice control, and driver assistance features, making them indispensable in the modern automotive ecosystem. Their adoption is also being reinforced by regulatory frameworks encouraging integration of safety alerts and advanced telematics within infotainment modules.
The ongoing shift toward electric and connected vehicles has further accelerated the need for robust SoCs to handle complex multimedia and data processing tasks. As automakers prioritize customer engagement and differentiated digital experiences, infotainment systems remain the key driver of growth in the application segment.
The market is notably growing due to its various features, including video, connectivity, voice recognition, etc. According to Future Market Insights, the market was valued at USD 14.3 billion in 2020 and is expected to reach USD 46.6 billion by 2035.
The growing consumer demand for automotive infotainment testing in Asia is capturing a relevant share by 2035. The rising consumers demand luxury and premium vehicles with amazing automatic dashboard features is surging the market size. The increasing demand for connected cars, present manufacturers, and the huge population are driving the market growth in Asia Pacific countries.
Based on vehicle type, passenger cars dominate the global market by capturing a maximum share of 81.2% during the forecast period. Passenger cars are widely growing due to the increasing population and rising number of passengers for traveling purposes.
There is growing public transportation from various passenger cars, including SUVs, sedans, and others. These cars are stylish, comfortable, and convenient, bolstering the market growth.
The Commercial vehicle is another category capturing a significant share during the forecast period. These commercial vehicles include buses and trucks. These vehicles are sufficient and capable of transporting goods and passengers from one place to another.
The rising popularity of electric vehicles has been notably growing in recent times. The government takes several measures to control air pollution and focus on sustainability. Overall, passenger cars are contributing a prominent role in the global market by 2035.
Based on application, infotainment systems are a significant category anticipated to secure a share of 63.4% by 2035. The rising demand for infotainment systems is due to their advanced features, such as internet connectivity, navigation, free-hand calling, and audio playback. These features enhance consumers' experiences and make them easy to access.
The manufacturers are implementing advanced technology in the infotainment systems to integrate features such as Heating, Ventilation, and Air Conditioning. However, the global market continues to expand with the growing demand for connected infotainment systems.
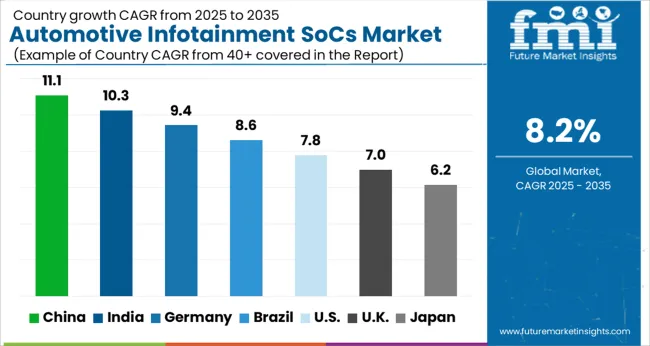
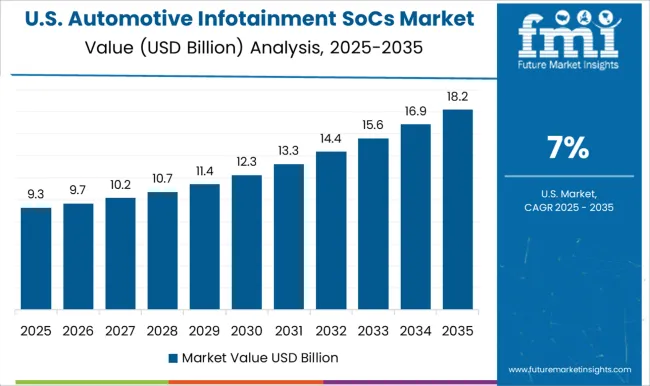
The United States is leading the global market by capturing 22.6% of the share by 2035. The growing automotive industry and rising demand for premium cars drive the United States market. The manufacturers are growing their production due to the rising demand for connected cars with advanced technologies in infotainment systems.
The various key players in the United States are expanding the market revenue, including Texas Instruments Inc, STMicroelectronics, NXP Semiconductors, and Intel Corporation. These key companies invest huge amounts in research and development activities to innovate unique products with technical advancements.
The United Kingdom is one of the growing nations estimated to capture a share of 9.2% by 2035. The growing consumer demand for premium, stylish, and luxury cars are advancing the market growth further. The manufacturers are developing products that meet consumers' requirements. The United Kingdom is a key exporter of high-quality infotainment systems in international markets.
Manufacturers are developing and improving efficiency and reducing costs by adopting technologies such as artificial intelligence, automation, and machine learning. The government of the United Kingdom is focused on sustainability to reduce environmental impacts. Therefore, the United Kingdom has developed environment-friendly electric cars that reduce waste and control air pollution.
China is one of the significant nations in the global market that register a share of 8.5% during the forecast period. The notably growing automotive industry and demand for SUVs are increasing the sales of automotive infotainment SoCs in the country. China is hugely invested in research and development activities to develop a unique and improved product to increase market growth.
The government of China is producing better-advanced technologies by collaborating with prominent players in the market. The key players in the market include Infineon Technologies AG, MediaTek Inc, and Rockchip Electronics Co. Ltd. The rising consumer demand for automated and connected cars are fueling China's automotive infotainment SoCs market.
India is another Asia Pacific nation anticipated to capture a share of 10.6% by 2035. India is contributing a significant revenue by several factors, including:
Several key players that capture the maximum revenue in India’s automotive infotainment SoCs market are Wipro, Sasken Technologies, and Tata Elxsi.
The manufacturers are adopting several marketing strategies to expand the global market. A few of them are as follows:
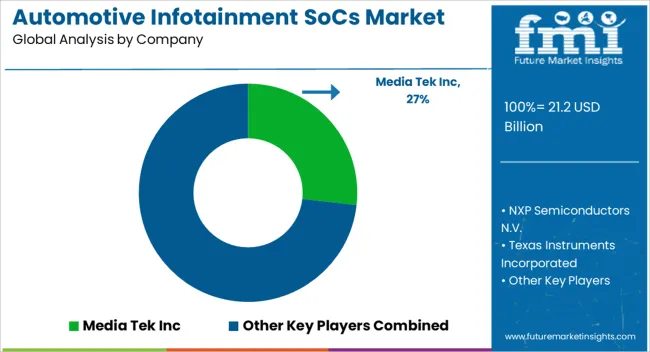
The market is highly competitive by key players from regions. These key players contribute to the global market through innovations and marketing skills. These players adopt several marketing methodologies such as mergers, acquisitions, partnerships, product launches, and agreements.
Other Essential Players in the Global Market are:
Recent Developments in the Global Automotive Infotainment SoCs Market are:
| Attribute | Details |
|---|---|
| Forecast Period | 2025 to 2035 |
| Historical Data Available for | 2020 to 2025 |
| Market Analysis | USD billion for Value |
| Key Countries Covered | The United States, The United Kingdom, Japan, India, China |
| Key Segments Covered | Application, Vehicle Type, Region |
| Key Companies Profiled | Media Tek Inc; NXP Semiconductors N.V.; Texas Instruments Incorporated; Intel Corporation; Infineon Technologies Inc; Qualcomm Technologies Inc; Renesas Electronics Corporation; NVIDIA Corporation; Microchip Technologu Inc; STMicroelectronics N.V. |
| Report Coverage | Market Forecast, Company Share Analysis, Competition Intelligence, DROT Analysis, Market Dynamics and Challenges, and Strategic Growth Initiatives |
| Customization & Pricing | Available upon Request |
The global automotive infotainment SoCs market is estimated to be valued at USD 21.2 billion in 2025.
The market size for the automotive infotainment SoCs market is projected to reach USD 46.6 billion by 2035.
The automotive infotainment SoCs market is expected to grow at a 8.2% CAGR between 2025 and 2035.
The key product types in automotive infotainment SoCs market are passenger cars, commercial vehicles, light commercial vehicles and heavy commercial vehicles.
In terms of application, infotainment systems segment to command 47.3% share in the automotive infotainment SoCs market in 2025.


Our Research Products

The "Full Research Suite" delivers actionable market intel, deep dives on markets or technologies, so clients act faster, cut risk, and unlock growth.

The Leaderboard benchmarks and ranks top vendors, classifying them as Established Leaders, Leading Challengers, or Disruptors & Challengers.

Locates where complements amplify value and substitutes erode it, forecasting net impact by horizon

We deliver granular, decision-grade intel: market sizing, 5-year forecasts, pricing, adoption, usage, revenue, and operational KPIs—plus competitor tracking, regulation, and value chains—across 60 countries broadly.

Spot the shifts before they hit your P&L. We track inflection points, adoption curves, pricing moves, and ecosystem plays to show where demand is heading, why it is changing, and what to do next across high-growth markets and disruptive tech

Real-time reads of user behavior. We track shifting priorities, perceptions of today’s and next-gen services, and provider experience, then pace how fast tech moves from trial to adoption, blending buyer, consumer, and channel inputs with social signals (#WhySwitch, #UX).

Partner with our analyst team to build a custom report designed around your business priorities. From analysing market trends to assessing competitors or crafting bespoke datasets, we tailor insights to your needs.
Supplier Intelligence
Discovery & Profiling
Capacity & Footprint
Performance & Risk
Compliance & Governance
Commercial Readiness
Who Supplies Whom
Scorecards & Shortlists
Playbooks & Docs
Category Intelligence
Definition & Scope
Demand & Use Cases
Cost Drivers
Market Structure
Supply Chain Map
Trade & Policy
Operating Norms
Deliverables
Buyer Intelligence
Account Basics
Spend & Scope
Procurement Model
Vendor Requirements
Terms & Policies
Entry Strategy
Pain Points & Triggers
Outputs
Pricing Analysis
Benchmarks
Trends
Should-Cost
Indexation
Landed Cost
Commercial Terms
Deliverables
Brand Analysis
Positioning & Value Prop
Share & Presence
Customer Evidence
Go-to-Market
Digital & Reputation
Compliance & Trust
KPIs & Gaps
Outputs
Full Research Suite comprises of:
Market outlook & trends analysis
Interviews & case studies
Strategic recommendations
Vendor profiles & capabilities analysis
5-year forecasts
8 regions and 60+ country-level data splits
Market segment data splits
12 months of continuous data updates
DELIVERED AS:
PDF EXCEL ONLINE
Automotive Network Testing Market Size and Share Forecast Outlook 2025 to 2035
Automotive Performance Part Market Size and Share Forecast Outlook 2025 to 2035
Automotive Carbon Ceramic Brake Market Size and Share Forecast Outlook 2025 to 2035
Automotive Camshaft Market Size and Share Forecast Outlook 2025 to 2035
Automotive Stamping Industry Analysis in India Size and Share Forecast Outlook 2025 to 2035
Automotive Cylinder Liner Market Size and Share Forecast Outlook 2025 to 2035
Automotive Microcontroller Market Size and Share Forecast Outlook 2025 to 2035
Automotive Roof Rails Market Size and Share Forecast Outlook 2025 to 2035
Automotive Active Safety System Market Size and Share Forecast Outlook 2025 to 2035
Automotive Diagnostic Scan Tool Market Size and Share Forecast Outlook 2025 to 2035
Automotive Test Equipment Market Size and Share Forecast Outlook 2025 to 2035
Automotive Dynamic Map Data Market Size and Share Forecast Outlook 2025 to 2035
Automotive Green Tires Market Size and Share Forecast Outlook 2025 to 2035
Automotive E-Tailing Market Size and Share Forecast Outlook 2025 to 2035
Automotive Interior Market Forecast Outlook 2025 to 2035
Automotive Key Market Size and Share Forecast Outlook 2025 to 2035
Automotive Appearance Chemical Market Forecast and Outlook 2025 to 2035
Automotive Seating Market Forecast and Outlook 2025 to 2035
Automotive Domain Control Module Market Forecast and Outlook 2025 to 2035
Automotive Remote Diagnostic Market Forecast and Outlook 2025 to 2035

Thank you!
You will receive an email from our Business Development Manager. Please be sure to check your SPAM/JUNK folder too.
Chat With
MaRIA