Reports

- Global Locations -

Headquarters

Future Market Insights, Inc.

Christiana Corporate, 200
Continental Drive, Suite 401,
Newark, Delaware - 19713,
United States

T: +1-845-579-5705

Americas

Future Market Insights, Inc.

616 Corporate Way, Suite 2-9018,
Valley Cottage, NY 10989, United States

T: +1-347-918-3531

MEA

Future Market Insights

1602-6 Jumeirah Bay X2 Tower, Plot No: JLT-PH2-X2A,
Jumeirah Lakes Towers, Dubai,
United Arab Emirates

Europe

Future Market Insights

3rd Floor, 207 Regent Street,
W1B 3HH London
United Kingdom

T: + 44 (0) 20 8123 9659
D: +44 (0) 20 3287 4268

Asia Pacific

Future Market Insights

IndiaLand Global Tech Park, Unit UG-1, Behind Grand HighStreet, Phase 1, Hinjawadi, MH, Pune – 411057, India

Ayurvedic Supplement Market Outlook

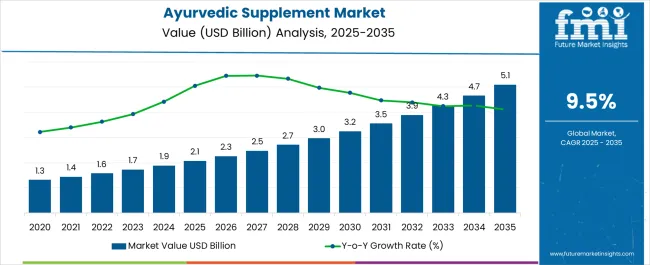
The global ayurvedic supplement market is valued at US$ 1,831.8 million in 2024 and is expected to reach US$ 4,708.2 million by 2034. The market is predicted to grow at a healthy rate of 9.9% from 2024 to 2034.

Market Outlook:

Data Points Market Insights
Market Value 2023 US$ 1,708.5 million
Market Value 2024 US$ 1,831.8 million
Market Value 2034 US$ 4,708.2 million
CAGR 2024 to 2034 9.9%

Originating in India, ayurveda is growing in popularity worldwide as consumers seek more natural and potentially inexpensive remedies. The vast scope of natural herbs and the relationship shared by the human body with nature are expected to lead ayurvedic medicine to new heights. As a result, there is ever-increasing potential for ayurvedic supplements.

Don't pay for what you don't need

Customize your report by selecting specific countries or regions and save 30%!

Sales Analysis of Ayurvedic Supplements from 2019 to 2023 Vs Market Outlook for 2024 to 2034

The sales of ayurvedic supplements expanded at a CAGR of 5.4% from 2019 to 2023. The 2019 market value was US$ 1,314.6 million, while the 2023 value was tipped to US$ 1,708.5 million.

There has been a constant increase in chronic health issues and obesity among people globally in recent times. According to WHO, around 422 million individuals with diabetes are present globally, and diabetes is directly responsible for 1.5 million fatalities annually. The prevalence of the disease is further rising steadily. As a result, underlying health conditions stimulate people to adopt consumables with functional benefits to boost immunity. Thus, the deteriorating health conditions of individuals are leading to a growth in the consumption of dietary supplements.

Data Points Market Insights
Market Value 2023 US$ 1,708.5 million
Market Value 2019 US$ 1,314.6 million
CAGR 2019 to 2023 5.4%

Furthermore, ayurvedic supplements contain herbal extracts from plants and are safe for the human body compared to conventional medicines, which contain chemicals. Therefore, the ayurvedic supplement market is growing due to its health-effective factors. With increased demand for natural and plant-based products, organic skincare products are achieving new heights in the market. Moreover, skin and hair supplements with ayurvedic ingredients are predicted to drive market growth.

The popularity of ayurvedic products increased rapidly during the COVID-19 pandemic. People have adopted ayurvedic products and medicines worldwide to boost their immune systems. Additionally, the pandemic has changed the lifestyle of consumers and increased the adoption of preventive healthcare solutions. With this, the demand for immunity-boosting supplements has also increased, which is propelling the market.

Thus, owing to the factors above, the global market is expected to grow 9.9% during the forecast period.

Opportunities in the Ayurvedic Supplement Market

The demand for ayurvedic immune-boosting drugs and supplements is rising. Government agencies and industry players are also developing fresh approaches to boost market expansion. Additionally, the rise in investments in new research and other initiatives will help the market to grow.

Ayurvedic supplements are still blooming in developing regions and Western countries. Countries such as Argentina, Canada, and Peru still need to be tapped for the market. Creating awareness about ayurvedic products and supplements in unexplored areas is a lucrative opportunity for market players. Furthermore, increasing awareness about ayurvedic medicines in countries like India and Indonesia is slated to create opportunities for ayurvedic products in the coming years.

Sabyasachi Ghosh
Sabyasachi Ghosh

Principal Consultant

Talk to Analyst

Find your sweet spots for generating winning opportunities in this market.

Factors Restraining Demand for Ayurvedic Supplements

More knowledge about ayurvedic products in countries like the United States is a restraint to the market growth of ayurvedic supplements. The use of alternative products is further hampering the market for ayurvedic supplements.

The use of ayurvedic medications has grown recently among people worldwide. But ayurvedic remedies are reputed to consume a lot of time for recovery, because of which people prefer conventional medicine, which shows rapid results. Further, it is anticipated that in the approaching years, the growth opportunities in the worldwide market will be constrained by the Western world’s need for more knowledge of the scientific documentation of Ayurveda.

Thus, the overall effects of all the restraints cumulatively propose a negative impact on the growth of the ayurvedic supplement market.

Comparative View of Adjacent Markets

Ayurvedic Supplement Market:

Attributes Ayurvedic Supplement Market
Value-based CAGR (2024 to 2034) 9.9%
Market Trends
  • Rise in investments for research & development
  • Ayurvedic supplements are seen as a way to boost immunity
Restraint
  • Lack of awareness in the Western world about ayurvedic supplements
Growth Factors
  • Demand for natural medicine with no to fewer side effects

Dietary Supplement Market:

Attributes Dietary Supplement Market
Value-based CAGR (2024 to 2034) 9.1%
Market Trend
  • Sports nutrition supplements are growing in popularity
Restraint
  • Manufacturers need to navigate stringent regulations around dietary supplements
Growth Factor

Probiotic Supplement Market:

Attributes Probiotic Supplement Market
Value-based CAGR (2024 to 2034) 13.0%
Market Trend
Restraint
  • False advertising has the danger of bringing strict regulations
Growth Factor
  • Need to maintain gut health felt among consumers

Get the data you need at a Fraction of the cost

Personalize your report by choosing insights you need
and save 40%!

Country-wise Insights

Countries CAGR (2024 to 2034)
United States 7.9%
Japan 9.1%
Germany 6.6%
India 8.1%
China 8.8%

India’s Awareness of the Benefits of Ayurvedic Medicine is Making the Market Grow

India, being the birthplace of ayurveda, is slated for promising growth in the market. For the forecast period, the CAGR for India is predicted to be 8.1%.

The key factor driving the Indian market is the growing popularity of plant-based medicines. As people in India know the benefits of ayurvedic medicines, the demand for ayurvedic supplements is high. Moreover, the rising distaste for the side effects of conventional medication is further propelling the preference for ayurvedic supplements.

Additionally, the Indian government is helping matters by encouraging the use of ayurvedic products through various initiatives. For instance, the Ministry of Ayush has prioritized research and education in homeopathy and ayurveda. To achieve a healthy nation, the Indian government has outlined the objective to make AYUSH practices and lifestyles the standard.

Successful Marketing Strategies Have Seen Ayurvedic Medicine and Supplements Find Acceptance in Japan

The market for ayurvedic supplements is expanding rapidly in Japan, with a CAGR of 9.1% for the forecast period.

Marketing strategies have ensured that the Japanese people are more accepting of ayurvedic medicine and supplements. Traditional Japanese medicine is based heavily on herbs and plants. Ayurvedic supplement brands, too, have pronounced the plant-based nature of the product. Thus, Japan is a significant country for the ayurvedic supplement market.

Preference for Plant-based and Organic Treatment is Helping the Market in China

China is another Asian country with potential for the market. For the forecast period, the CAGR for China is projected to be 8.8%.

The shift from Korean and Chinese beauty products to ayurveda-inspired beauty products has become a new trend in China. The Chinese population has gradually shifted towards plant-based and organic skincare supplements. The popularity of ayurveda is indicative that younger Chinese consumers are interested in well-being on more than just a surface level. Therefore, the market for ayurvedic supplements in China is being driven forward.

Rise in Ayurvedic Centres and Research Institutes Propels the Market in Germany

Germany is one of the swiftly-growing countries in Europe for ayurveda. For the forecast period, the CAGR for Germany is anticipated to be an encouraging 6.6%.

The market for ayurvedic supplements in Germany is expanding due to the increasing popularity of ayurvedic medicines and growing ayurvedic centers and research institutes. Mark Rosenberg, founder of the European Academy of Ayurveda, Germany, has quoted that there has been an increase in treatment centers and more than a thousand wellness centers for patients to receive advice on ayurveda. Thus, the market has a positive outlook in Germany.

Adoption of Traditional Indian Practices Paving the Way for the Market in the United States

A large segment of the United States population is adopting traditional Indian practices like yoga. The groundwork is laid for other Indian practices in the country, such as ayurveda. Thus, ayurvedic supplements are progressing positively in the country. The CAGR for the United States over the forecast period is pegged at 7.9%.

Category-wise Insights

Desire to Boost Immunity Keeps the Demand Flowing for Nutritional Supplements

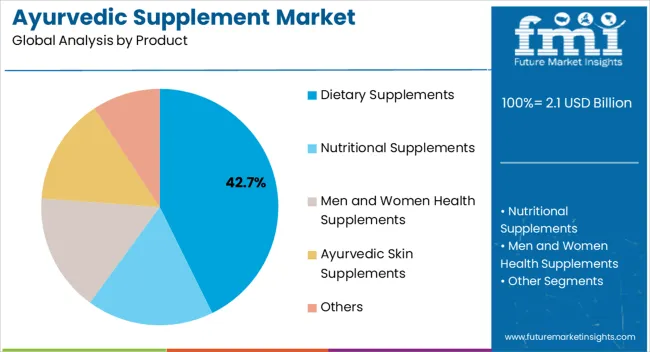
Nutritional supplements are expected to progress at a CAGR of 11.5% in the projected period, with a leading market share by product type of 28.9% anticipated in 2024. The rising demand for immunity booster supplements among people worldwide has created a large market for nutritional supplements. Additionally, the population suffering from chronic diseases and obesity is increasing day by day, and people are adopting a healthy lifestyle. Thus, there is the growth of nutritional ayurvedic supplements.

Attributes Details
Top Product Type Nutritional Supplements
Market Share in 2024 28.9%

Consumers prefer ease Provided by Capsules/Tablets

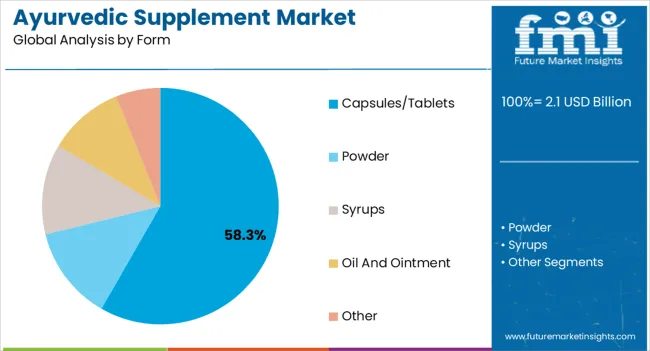
The capsules/tablets segment is expected to progress at a CAGR of 10.0% over the forecast period. Meanwhile, the market share by form in 2024 for capsules/tablets is pegged at 35.9%. As capsules and tablets are easy to consume, the products are highly preferred by people across the globe. Therefore, the sale of ayurvedic supplements in the form of capsules is high.

Attributes Details
Top Form Capsules/Tablets
Market Share in 2024 35.9%

Online Revolution has Led to a Significant Shift in the Sale of Ayurvedic Supplements

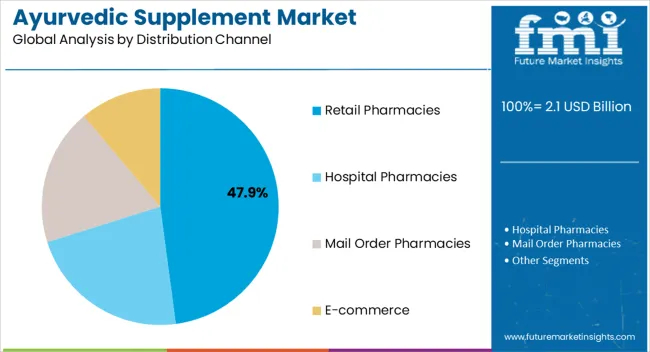
E-commerce is projected to hold a leading market share by distribution channel of 33.9% in 2024, with an expected CAGR of 8.3% until 2034. The availability of novel products on different online sites and increasing accessibility across other regions is expanding the market for ayurvedic supplements. Thus, the sale of ayurvedic supplements is predominantly moving online.

Attributes Details
Top Distribution Channel E-commerce
Market Share in 2024 33.9%

Competitive Landscape

The market participants for ayurvedic supplements are implementing various strategies to increase sales and generate income. Ayurvedic supplement market players are engaging in actions like new product launches to meet consumer demand and grow.

Recent Developments

  • In March 2023, Gencor launched a new ayurvedic dietary supplement focused on liver health.
  • In December 2021, Himalaya Drug Company established a wellness division. The new division has created over-the-counter medications that target conditions like immunity, joint care, women's health, and vitality, and the products are made from single herb formulations.
  • In February 2021, Lupin, a consumer healthcare company, launched the health supplement Be One. It is an ayurvedic wellness supplement for men.

Key Companies Profiled

  • Maharishi Ayurveda India Products Private Limited
  • Surya Herbal Ltd
  • Gynoveda Femtech Private Ltd.
  • Herbal Health Solutions
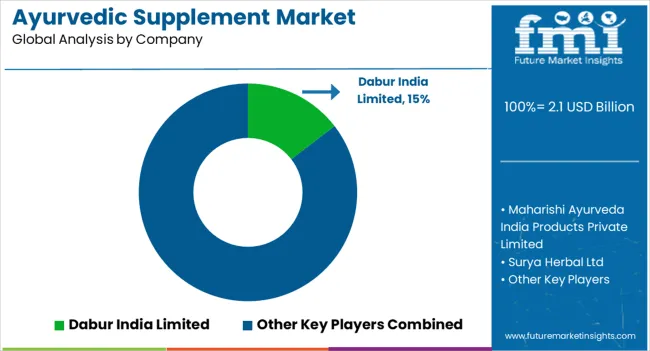
  • Dabur India Limited
  • ‎ Emami Limited.
  • Veloce Herbals Pvt. Ltd.
  • Riaan Wellness Pvt. Ltd.
  • Global Healthfit Retail India LLP
  • ‎ Pharma Science
  • The Himalaya Drug Co.
  • Tactus Nutrascience
  • ‎ Relevium
  • ‎Organic Dehydrated Foods Pvt. Ltd.
  • BACFO PHARMACEUTICALS (India) Ltd.
  • Herbolab India Pvt Ltd
  • Green Cross Health Innovation
  • ManSure
  • Banyan Botanicals

Key Market Segments Covered in Ayurvedic Supplements Industry Research

By Product:

  • Dietary Supplements
  • Nutritional Supplements
  • Men and Women Health Supplements
  • Ayurvedic Skin Supplements
  • Others

By Form:

  • Capsules/Tablets
  • Powder
  • Syrups
  • Oil and Ointment
  • Other

By Distribution Channel:

  • Hospital Pharmacies
  • Retail Pharmacies
  • Mail Order Pharmacies
  • E-commerce

By Region:

  • North America
  • Latin America
  • Europe
  • South Asia
  • East Asia
  • Oceania
  • The Middle East and Africa (MEA)

Frequently Asked Questions

How much is the Ayurvedic Supplement Market worth in 2024?

The global ayurvedic supplement market is anticipated to be worth US$ 1,831.8 million in 2024.

What is the Sales Forecast for the Ayurvedic Supplement Market through 2034?

The ayurvedic supplement market is expected to reach US$ 4,708.2 million by 2034.

What are the Key Trends Shaping the Ayurvedic Supplements Industry?

The key trends are growing awareness about ayurvedic supplements among people and increasing demand for cost-effective medical solutions.

What is the Outlook for the Ayurvedic Supplement Market in Germany?

The ayurvedic supplement market is expected to grow 6.6% in Germany over the forecast period.

Who are the Key Players in the Ayurvedic Supplement Market Sphere?

Maharishi Ayurveda India Products Private Limited, Surya Herbal Ltd, Gynoveda Femtech Private Ltd., and Herbal Health Solutions.

Table of Content

1. Executive Summary

    1.1. Global Market Outlook

    1.2. Demand Side Trends

    1.3. Supply Side Trends

    1.4. Market Round Offs

    1.5. FMI Analysis and Recommendations

2. Market Overview

    2.1. Market Coverage / Taxonomy

    2.2. Market Definition / Scope / Limitations

    2.3. Inclusions/Exclusions

3. Brand Mapping Analysis

    3.1. Price v/s Product

    3.2. Value for Money

    3.3. Top of Mind Ayurvedic Supplements Brands

    3.4. Brand Portfolio-by Key Players

    3.5. Brand Loyalty Mapping

    3.6. Usage Pattern Overview

    3.7. Branded vs Unbranded-Market Mix

4. Distribution Channel Wise Key Brand Positioning 

    4.1. Global Top Retailers and their Brand Offerings

        4.1.1. Ecommerce

        4.1.2. Retail Pharmacies

        4.1.3. Mail Order Pharmacies

        4.1.4. Hospital Pharmacies

    4.2. Retail Pricing Strategies

5. Consumer Buying Behavior Analysis

    5.1. Functionality and Product Demand

        5.1.1. Dietary Supplements

        5.1.2. Nutritional Supplements

        5.1.3. Men and Women Health Supplements

        5.1.4. Ayurvedic Skin Supplements

        5.1.5. Others

    5.2. What factors do you consider when deciding to purchase ayurvedic supplements?

    5.3. How important are product certifications when choosing ayurvedic supplements?

    5.4. How important is the brand reputation and recognition when selecting ayurvedic supplements products?

    5.5. What marketing channels do you prefer for learning about new products?

    5.6. How often do you purchase new ayurvedic supplements?

        5.6.1. Once or More Every Month

        5.6.2. Once Every 2 months

        5.6.3. Once Every 6 Months

        5.6.4. Once a Year

        5.6.5. Less Than Once A Year

6. Market Trends & Dynamics

    6.1. Per capita spending on ayurvedic supplement

    6.2. Key Trends Impacting the Market

    6.3. Product Innovation / Development Trends

        6.3.1. Latest Trends and Demands

        6.3.2. Latest Innovations and New Launches

    6.4. Future Prospects of Organic Cosmetics Industry

    6.5. Market Dynamics

        6.5.1. Drivers

        6.5.2. Restraints

        6.5.3. Opportunity Analysis

7. Value Added Insights

    7.1. Product Features/ USPs Analysis

    7.2. Product Adoption / Usage Analysis

    7.3. Key Promotional Strategies, By Key Manufacturers

    7.4. Pipeline Assessment

    7.5. Regulatory Landscape

    7.6. PESTLE Analysis

    7.7. Porter’s Analysis

8. Market Background

    8.1. Macro-Economic Factors

        8.1.1. Global GDP Growth Outlook

        8.1.2. Global Healthcare Expenditure

        8.1.3. Global Ayurvedic Products Market Overview

    8.2. Forecast Factors - Relevance & Impact

        8.2.1. Key Player’s Historic Growth

        8.2.2. Market Consolidation Activities

        8.2.3. New Product Launches / Approvals

        8.2.4. Rising demand for Ayurvedic Products

        8.2.5. Availability of Products

        8.2.6. Cost of Products

        8.2.7. Regulatory Scenario

9. Global Market Demand Analysis 2017 to 2022 and Forecast, 2023 to 2033

    9.1. Historical Market Volume (Units) Analysis, 2017 to 2022

    9.2. Current and Future Market Volume (Units) Projections, 2023 to 2033

        9.2.1. Y-o-Y Growth Trend Analysis *Per Capita Consumption

10. Global Market - Pricing Analysis

    10.1. Regional Pricing Analysis By Product

    10.2. Global Average Pricing Analysis Benchmark

    10.3. Pricing Assumptions

11. Global Market Demand (in Value or Size in US$ Million) Analysis 2017 to 2022 and Forecast, 2023 to 2033

    11.1. Historical Market Value (US$ Million) Analysis, 2017 to 2022

    11.2. Current and Future Market Value (US$ Million) Projections, 2023 to 2033

        11.2.1. Y-o-Y Growth Trend Analysis

        11.2.2. Absolute $ Opportunity Analysis

12. Global Market Analysis 2017 to 2022 and Forecast 2023 to 2033, by Product

    12.1. Introduction / Key Findings

    12.2. Historical Market Size (US$ Million) and Volume (Units) Analysis By Product, 2017 to 2022

    12.3. Current and Future Market Size (US$ Million) and Volume (Units) Analysis and Forecast By Product, 2023 to 2033

        12.3.1. Dietary Supplements

        12.3.2. Nutritional Supplements

        12.3.3. Men and Women Health Supplements

        12.3.4. Ayurvedic Skin Supplements

        12.3.5. Others

    12.4. Market Attractiveness Analysis By Product

13. Global Market Analysis 2017 to 2022 and Forecast 2023 to 2033, By Form

    13.1. Introduction / Key Findings

    13.2. Historical Market Size (US$ Million) Analysis By Form, 2017 to 2022

    13.3. Current and Future Market Size (US$ Million) Analysis and Forecast By Form, 2023 to 2033

        13.3.1. Capsules/Tablets

        13.3.2. Powder

        13.3.3. Syrups

        13.3.4. Oil and Ointment

        13.3.5. Other

    13.4. Market Attractiveness Analysis By Form

14. Global Market Analysis 2017 to 2022 and Forecast 2023 to 2033, By Distribution Channel

    14.1. Introduction / Key Findings

    14.2. Historical Market Size (US$ Million) Analysis By Distribution Channel, 2017 to 2022

    14.3. Current and Future Market Size (US$ Million) Analysis and Forecast By Distribution Channel, 2023 to 2033

        14.3.1. Ecommerce

        14.3.2. Retail Pharmacies

        14.3.3. Mail Order Pharmacies

        14.3.4. Hospital Pharmacies

    14.4. Market Attractiveness Analysis By Distribution Channel

15. Global Market Analysis 2017 to 2022 and Forecast 2023 to 2033, by Region

    15.1. Introduction

    15.2. Historical Market Size (US$ Million) Analysis By Region, 2017 to 2022

    15.3. Current and Future Market Size (US$ Million) and Volume (Units) Analysis and Forecast By Region, 2023 to 2033

        15.3.1. North America

        15.3.2. Latin America

        15.3.3. Europe

        15.3.4. South Asia

        15.3.5. East Asia

        15.3.6. Oceania

        15.3.7. Middle East & Africa

    15.4. Market Attractiveness Analysis By Region

16. North America Market Analysis 2017 to 2022 and Forecast 2023 to 2033

    16.1. Introduction

    16.2. Historical Market Size (US$ Million) and Volume (Units) Trend Analysis By Market Taxonomy, 2017 to 2022

    16.3. Current and Future Market Size (US$ Million) and Volume (Units) Analysis and Forecast By Market Taxonomy, 2023 to 2033

        16.3.1. By Country

            16.3.1.1. USA

            16.3.1.2. Canada

        16.3.2. By Product

        16.3.3. By Form

        16.3.4. By Distribution Channel

    16.4. Market Attractiveness Analysis

        16.4.1. By Country

        16.4.2. By Modality

        16.4.3. By Form

        16.4.4. By Distribution Channel

    16.5. Market Trends

    16.6. Market Drivers & Restraints – Intensity Mapping

    16.7. Country Level Analysis & Forecast

        16.7.1. USA Market

            16.7.1.1. Introduction

            16.7.1.2. Market Analysis and Forecast by Market Taxonomy

                16.7.1.2.1. By Product Type

                16.7.1.2.2. By Form

                16.7.1.2.3. By Distribution Channel

        16.7.2. Canada Market

            16.7.2.1. Introduction

            16.7.2.2. Market Analysis and Forecast by Market Taxonomy

                16.7.2.2.1. By Product Type

                16.7.2.2.2. By Form

                16.7.2.2.3. By Distribution Channel

17. Latin America Market Analysis 2017 to 2022 and Forecast 2023 to 2033

    17.1. Introduction

    17.2. Historical Market Size (US$ Million) and Volume (Units) Trend Analysis By Market Taxonomy, 2017 to 2022

    17.3. Current and Future Market Size (US$ Million) and Volume (Units) Analysis and Forecast By Market Taxonomy, 2023 to 2033

        17.3.1. By Country

            17.3.1.1. Brazil

            17.3.1.2. Mexico

            17.3.1.3. Argentina

            17.3.1.4. Rest of LATAM

        17.3.2. By Product

        17.3.3. By Form

        17.3.4. By Distribution Channel

    17.4. Market Attractiveness Analysis

        17.4.1. By Country

        17.4.2. By Product

        17.4.3. By Form

        17.4.4. By Distribution Channel

    17.5. Market Trends

    17.6. Market Drivers & Restraints – Intensity Mapping

    17.7. Country Level Analysis & Forecast

        17.7.1. Brazil Market

            17.7.1.1. Introduction

            17.7.1.2. Market Analysis and Forecast by Market Taxonomy

                17.7.1.2.1. By Product Type

                17.7.1.2.2. By Form

                17.7.1.2.3. By Distribution Channel

        17.7.2. Mexico Market

            17.7.2.1. Introduction

            17.7.2.2. Market Analysis and Forecast by Market Taxonomy

                17.7.2.2.1. By Product Type

                17.7.2.2.2. By Form

                17.7.2.2.3. By Distribution Channel

        17.7.3. Argentina Market

            17.7.3.1. Introduction

            17.7.3.2. Market Analysis and Forecast by Market Taxonomy

                17.7.3.2.1. By Product Type

                17.7.3.2.2. By Form

                17.7.3.2.3. By Distribution Channel

18. Europe Market Analysis 2017 to 2022 and Forecast 2023 to 2033

    18.1. Introduction

    18.2. Historical Market Size (US$ Million) and Volume (Units) Trend Analysis By Market Taxonomy, 2017 to 2022

    18.3. Current and Future Market Size (US$ Million) and Volume (Units) Analysis and Forecast By Market Taxonomy, 2023 to 2033

        18.3.1. By Country

            18.3.1.1. UK

            18.3.1.2. Germany

            18.3.1.3. France

            18.3.1.4. Italy

            18.3.1.5. Spain

            18.3.1.6. BENELUX

            18.3.1.7. Russia

            18.3.1.8. Rest of Europe

        18.3.2. By Product

        18.3.3. By Form

        18.3.4. By Distribution Channel

    18.4. Market Attractiveness Analysis

        18.4.1. By Country

        18.4.2. By Product

        18.4.3. By Form

        18.4.4. By Distribution Channel

    18.5. Market Trends

    18.6. Market Drivers & Restraints – Intensity Mapping

    18.7. Country Level Analysis & Forecast

        18.7.1. UK Market

            18.7.1.1. Introduction

            18.7.1.2. Market Analysis and Forecast by Market Taxonomy

                18.7.1.2.1. By Product Type

                18.7.1.2.2. By Form

                18.7.1.2.3. By Distribution Channel

        18.7.2. Germany Market

            18.7.2.1. Introduction

            18.7.2.2. Market Analysis and Forecast by Market Taxonomy

                18.7.2.2.1. By Product Type

                18.7.2.2.2. By Form

                18.7.2.2.3. By Distribution Channel

        18.7.3. France Market

            18.7.3.1. Introduction

            18.7.3.2. Market Analysis and Forecast by Market Taxonomy

                18.7.3.2.1. By Product Type

                18.7.3.2.2. By Form

                18.7.3.2.3. By Distribution Channel

        18.7.4. Spain Market

            18.7.4.1. Introduction

            18.7.4.2. Market Analysis and Forecast by Market Taxonomy

                18.7.4.2.1. By Product Type

                18.7.4.2.2. By Form

                18.7.4.2.3. By Distribution Channel

        18.7.5. Italy Market

            18.7.5.1. Introduction

            18.7.5.2. Market Analysis and Forecast by Market Taxonomy

                18.7.5.2.1. By Product Type

                18.7.5.2.2. By Form

                18.7.5.2.3. By Distribution Channel

        18.7.6. BENELUX Market

            18.7.6.1. Introduction

            18.7.6.2. Market Analysis and Forecast by Market Taxonomy

                18.7.6.2.1. By Product Type

                18.7.6.2.2. By Form

                18.7.6.2.3. By Distribution Channel

        18.7.7. Russia Market

            18.7.7.1. Introduction

            18.7.7.2. Market Analysis and Forecast by Market Taxonomy

                18.7.7.2.1. By Product Type

                18.7.7.2.2. By Form

                18.7.7.2.3. By Distribution Channel

19. East Asia Market Analysis 2017 to 2022 and Forecast 2023 to 2033

    19.1. Introduction

    19.2. Historical Market Size (US$ Million) and Volume (Units) Trend Analysis By Market Taxonomy, 2017 to 2022

    19.3. Current and Future Market Size (US$ Million) and Volume (Units) Analysis and Forecast By Market Taxonomy, 2023 to 2033

        19.3.1. By Country

            19.3.1.1. China

            19.3.1.2. Japan

            19.3.1.3. South Korea

        19.3.2. By Product

        19.3.3. By Form

        19.3.4. By Distribution Channel

    19.4. Market Attractiveness Analysis

        19.4.1. By Country

        19.4.2. By Product

        19.4.3. By Form

        19.4.4. By Distribution Channel

    19.5. Market Trends

    19.6. Market Drivers & Restraints – Intensity Mapping

    19.7. Country Level Analysis & Forecast

        19.7.1. China Market

            19.7.1.1. Introduction

            19.7.1.2. Market Analysis and Forecast by Market Taxonomy

                19.7.1.2.1. By Product Type

                19.7.1.2.2. By Form

                19.7.1.2.3. By Distribution Channel

        19.7.2. Japan Market

            19.7.2.1. Introduction

            19.7.2.2. Market Analysis and Forecast by Market Taxonomy

                19.7.2.2.1. By Product Type

                19.7.2.2.2. By Form

                19.7.2.2.3. By Distribution Channel

        19.7.3. South Korea Market

            19.7.3.1. Introduction

            19.7.3.2. Market Analysis and Forecast by Market Taxonomy

                19.7.3.2.1. By Product Type

                19.7.3.2.2. By Form

                19.7.3.2.3. By Distribution Channel

20. South Asia Market Analysis 2017 to 2022 and Forecast 2023 to 2033

    20.1. Introduction

    20.2. Historical Market Size (US$ Million) and Volume (Units) Trend Analysis By Market Taxonomy, 2017 to 2022

    20.3. Current and Future Market Size (US$ Million) and Volume (Units) Analysis and Forecast By Market Taxonomy, 2023 to 2033

        20.3.1. By Country

            20.3.1.1. India

            20.3.1.2. Indonesia

            20.3.1.3. Thailand

            20.3.1.4. Malaysia

            20.3.1.5. Rest of South Asia

        20.3.2. By Product

        20.3.3. By Form

        20.3.4. By Distribution Channel

    20.4. Market Attractiveness Analysis

        20.4.1. By Country

        20.4.2. By Product

        20.4.3. By Form

        20.4.4. By Distribution Channel

    20.5. Market Trends

    20.6. Market Drivers & Restraints – Intensity Mapping

    20.7. Country Level Analysis & Forecast

        20.7.1. India Market

            20.7.1.1. Introduction

            20.7.1.2. Market Analysis and Forecast by Market Taxonomy

                20.7.1.2.1. By Product Type

                20.7.1.2.2. By Form

                20.7.1.2.3. By Distribution Channel

        20.7.2. Indonesia Market

            20.7.2.1. Introduction

            20.7.2.2. Market Analysis and Forecast by Market Taxonomy

                20.7.2.2.1. By Product Type

                20.7.2.2.2. By Form

                20.7.2.2.3. By Distribution Channel

        20.7.3. Thailand Market

            20.7.3.1. Introduction

            20.7.3.2. Market Analysis and Forecast by Market Taxonomy

                20.7.3.2.1. By Product Type

                20.7.3.2.2. By Form

                20.7.3.2.3. By Distribution Channel

        20.7.4. Malaysia Market

            20.7.4.1. Introduction

            20.7.4.2. Market Analysis and Forecast by Market Taxonomy

                20.7.4.2.1. By Product Type

                20.7.4.2.2. By Form

                20.7.4.2.3. By Distribution Channel

21. Oceania Market Analysis 2017 to 2022 and Forecast 2023 to 2033

    21.1. Introduction

    21.2. Historical Market Size (US$ Million) and Volume (Units) Trend Analysis By Market Taxonomy, 2017 to 2022

    21.3. Current and Future Market Size (US$ Million) and Volume (Units) Analysis and Forecast By Market Taxonomy, 2023 to 2033

        21.3.1. By Country

            21.3.1.1. Australia

            21.3.1.2. New Zealand

        21.3.2. By Product

        21.3.3. By Form

        21.3.4. By Distribution Channel

    21.4. Market Attractiveness Analysis

        21.4.1. By Country

        21.4.2. By Product

        21.4.3. By Form

        21.4.4. By Distribution Channel

    21.5. Market Trends

    21.6. Market Drivers & Restraints – Intensity Mapping

    21.7. Country Level Analysis & Forecast

        21.7.1. Australia Market

            21.7.1.1. Introduction

            21.7.1.2. Market Analysis and Forecast by Market Taxonomy

                21.7.1.2.1. By Product Type

                21.7.1.2.2. By Form

                21.7.1.2.3. By Distribution Channel

        21.7.2. New Zealand Market

            21.7.2.1. Introduction

            21.7.2.2. Market Analysis and Forecast by Market Taxonomy

                21.7.2.2.1. By Product Type

                21.7.2.2.2. By Form

                21.7.2.2.3. By Distribution Channel

22. Middle East & Africa Market Analysis 2017 to 2022 and Forecast 2023 to 2033

    22.1. Introduction

    22.2. Historical Market Size (US$ Million) and Volume (Units) Trend Analysis By Market Taxonomy, 2017 to 2022

    22.3. Current and Future Market Size (US$ Million) and Volume (Units) Analysis and Forecast By Market Taxonomy, 2023 to 2033

        22.3.1. By Country

            22.3.1.1. GCC Countries

            22.3.1.2. Türkiye

            22.3.1.3. South Africa

            22.3.1.4. North Africa

            22.3.1.5. Rest of MEA

        22.3.2. By Product

        22.3.3. By Form

        22.3.4. By Distribution Channel

    22.4. Market Attractiveness Analysis

        22.4.1. By Country

        22.4.2. By Product

        22.4.3. By Form

        22.4.4. By Distribution Channel

    22.5. Market Trends

    22.6. Market Drivers & Restraints – Intensity Mapping

    22.7. Country Level Analysis & Forecast

        22.7.1. GCC Countries Market

            22.7.1.1. Introduction

            22.7.1.2. Market Analysis and Forecast by Market Taxonomy

                22.7.1.2.1. By Product Type

                22.7.1.2.2. By Form

                22.7.1.2.3. By Distribution Channel

        22.7.2. Türkiye Market

            22.7.2.1. Introduction

            22.7.2.2. Market Analysis and Forecast by Market Taxonomy

                22.7.2.2.1. By Product Type

                22.7.2.2.2. By Form

                22.7.2.2.3. By Distribution Channel

        22.7.3. South Africa Market

            22.7.3.1. Introduction

            22.7.3.2. Market Analysis and Forecast by Market Taxonomy

                22.7.3.2.1. By Product Type

                22.7.3.2.2. By Form

                22.7.3.2.3. By Distribution Channel

        22.7.4. North Africa Market

            22.7.4.1. Introduction

            22.7.4.2. Market Analysis and Forecast by Market Taxonomy

                22.7.4.2.1. By Product Type

                22.7.4.2.2. By Form

                22.7.4.2.3. By Distribution Channel

23. Market Structure Analysis

    23.1. Market Analysis by Tier of Companies

    23.2. Market Share Analysis of Top Players

    23.3. Market Presence Analysis

24. Competition Analysis

    24.1. Competition Dashboard

    24.2. Branding and Promotional Strategies, By Key Players

    24.3. Key Development Analysis

    24.4. Competition Deep Dive

        24.4.1. Maharishi Ayurveda India Products Private Limited

            24.4.1.1. Overview

            24.4.1.2. Product Portfolio

            24.4.1.3. Key Financials

            24.4.1.4. Sales Footprint

            24.4.1.5. Strategy Overview

                24.4.1.5.1. Marketing Strategy

                24.4.1.5.2. Component Type Strategy

                24.4.1.5.3. Channel Strategy

        24.4.2. Surya Herbal Ltd

        24.4.3. Gynoveda Femtech Private Ltd.

        24.4.4. Herbal Health Solutions

        24.4.5. Dabur India Limited

        24.4.6. ‎ Emami Limited.

        24.4.7. Veloce Herbals Pvt. Ltd.

        24.4.8. Riaan Wellness Pvt. Ltd.

        24.4.9. Global Healthfit Retail India LLP

        24.4.10. ‎ Pharma Science

        24.4.11. The Himalaya Drug Co.

        24.4.12. Tactus Nutrascience

        24.4.13. ‎ Relevium

        24.4.14. ‎ Organic Dehydated Foods Pvt. Ltd.

        24.4.15. BACFO PHARMACEUTICALS (India) Ltd.

        24.4.16. Herbolab India Pvt Ltd

        24.4.17. Green Cross Health Innovation

        24.4.18. ManSure

        24.4.19. Banyan Botanicals

        24.4.20. Maharishi Ayurveda.

25. Assumptions and Acronyms Used

26. Research Methodology

List of Tables

Table 01: Global Market Value (US$ Million) Analysis and Forecast 2017 to 2033, By Product

Table 02: Global Market Volume (Units) Analysis and Forecast 2017 to 2033, By Product

Table 03: Global Market Value (US$ Million) Analysis and Forecast 2017 to 2033, By Form

Table 04: Global Market Value (US$ Million) Analysis and Forecast 2017 to 2033, By Distribution Channel

Table 05: Global Market Value (US$ Million) Analysis and Forecast 2017 to 2033, By Region

Table 06: North America Market Value (US$ Million) Analysis 2017-2022 and Forecast 2023 to 2033, by Country

Table 07: North America Market Value (US$ Million) Analysis and Forecast 2017 to 2033, By Product

Table 08: North America Market Volume (Units) Analysis and Forecast 2017 to 2033, By Product

Table 09: North America Market Value (US$ Million) Analysis and Forecast 2017 to 2033, by Application

Table 10: North America Market Value (US$ Million) Analysis and Forecast 2017 to 2033, By Distribution Channel

Table 11: Latin America Market Value (US$ Million) Analysis 2017-2022 and Forecast 2023 to 2033, by Country

Table 12: Latin America Market Value (US$ Million) Analysis and Forecast 2017 to 2033, By Product

Table 13: Latin America Market Volume (Units) Analysis and Forecast 2017 to 2033, By Product

Table 14: Latin America Market Value (US$ Million) Analysis and Forecast 2017 to 2033, by Application

Table 15: Latin America Market Value (US$ Million) Analysis and Forecast 2017 to 2033, By Distribution Channel

Table 16: Europe Market Value (US$ Million) Analysis 2017-2022 and Forecast 2023 to 2033, by Country

Table 17: Europe Market Value (US$ Million) Analysis and Forecast 2017 to 2033, By Product

Table 18: Europe Market Volume (Units) Analysis and Forecast 2017 to 2033, By Product

Table 19: Europe Market Value (US$ 2017–2033) Analysis and Forecast 2017 to 2033, by Application

Table 20: Europe Market Value (US$ Million) Analysis and Forecast 2017 to 2033, By Distribution Channel

Table 21: South Asia Market Value (US$ Million) Analysis 2017-2022 and Forecast 2023 to 2033, by Country

Table 22: South Asia Market Value (US$ Million) Analysis and Forecast 2017 to 2033, By Product

Table 23: South Asia Market Volume (Units) Analysis and Forecast 2017 to 2033, By Product

Table 24: South Asia Market Value (US$ Million) Analysis and Forecast 2017 to 2033, by Application

Table 25: South Asia Market Value (US$ Million) Analysis and Forecast 2017 to 2033, By Distribution Channel

Table 26: East Asia Market Value (US$ Million) Analysis 2017-2022 and Forecast 2023 to 2033, by Country

Table 27: East Asia Market Value (US$ Million) Analysis and Forecast 2017 to 2033, By Product

Table 28: East Asia Market Volume (Units) Analysis and Forecast 2017 to 2033, By Product

Table 29: East Asia Market Value (US$ Million) Analysis and Forecast 2017 to 2033, by Application

Table 30: East Asia Market Value (US$ Million) Analysis and Forecast 2017 to 2033, By Distribution Channel

Table 31: Oceania Market Value (US$ Million) Analysis 2017-2022 and Forecast 2023 to 2033, by Country

Table 32: Oceania Market Value (US$ Million) Analysis and Forecast 2017 to 2033, By Product

Table 33: Oceania Market Volume (Units) Analysis and Forecast 2017 to 2033, By Product

Table 34: Oceania Market Value (US$ Million) Analysis and Forecast 2017 to 2033, by Application

Table 35: Oceania Market Value (US$ Million) Analysis and Forecast 2017 to 2033, By Distribution Channel

Table 36: Middle East and Africa Market Value (US$ Million) Analysis 2017-2022 and Forecast 2023 to 2033, by Country

Table 37: Middle East and Africa Market Value (US$ Million) Analysis and Forecast 2017 to 2033, By Product

Table 38: Middle East and Africa Market Volume (Units) Analysis and Forecast 2017 to 2033, By Product

Table 39: Middle East and Africa Market Value (US$ Million) Analysis and Forecast 2017 to 2033, by Application

Table 40: Middle East and Africa Market Value (US$ Million) Analysis and Forecast 2017 to 2033, By Distribution Channel

List of Charts

Figure 01: Global Market Volume (Units), 2017 to 2022

Figure 02: Global Market Volume (Units) & Y-o-Y Growth (%) Analysis, 2023 to 2033

Figure 03: Market, Pricing Analysis per unit (US$), in 2023

Figure 04: Market, Pricing Forecast per unit (US$), in 2033

Figure 05: Global Market Value (US$ Million) Analysis, 2017 to 2022

Figure 06: Global Market Forecast & Y-o-Y Growth, 2023 to 2033

Figure 07: Global Market Absolute $ Opportunity (US$ Million) Analysis, 2022 to 2033

Figure 08: Global Market Value Share (%) Analysis 2023 and 2033, By Product

Figure 09: Global Market Y-o-Y Growth (%) Analysis 2022-2033, By Product

Figure 10: Global Market Attractiveness Analysis 2023 to 2033, By Product

Figure 11: Global Market Value Share (%) Analysis 2023 and 2033, By Form

Figure 12: Global Market Y-o-Y Growth (%) Analysis 2022-2033, By Form

Figure 13: Global Market Attractiveness Analysis 2023 to 2033, By Form

Figure 14: Global Market Value Share (%) Analysis 2023 and 2033, By Distribution Channel

Figure 15: Global Market Y-o-Y Growth (%) Analysis 2022-2033, By Distribution Channel

Figure 16: Global Market Attractiveness Analysis 2023 to 2033, By Distribution Channel

Figure 17: Global Market Value Share (%) Analysis 2023 and 2033, By Region

Figure 18: Global Market Y-o-Y Growth (%) Analysis 2022-2033, By Region

Figure 19: Global Market Attractiveness Analysis 2023 to 2033, By Region

Figure 20: North America Market Value (US$ Million) Analysis, 2017 to 2022

Figure 21: North America Market Value (US$ Million) Forecast, 2023 to 2033

Figure 22: North America Market Value Share, By Product (2023 E)

Figure 23: North America Market Value Share, By Form (2023 E)

Figure 24: North America Market Value Share, By Distribution Channel (2023 E)

Figure 25: North America Market Value Share, by Country (2023 E)

Figure 26: North America Market Attractiveness Analysis By Product, 2023 to 2033

Figure 27: North America Market Attractiveness Analysis By Form, 2023 to 2033

Figure 28: North America Market Attractiveness Analysis By Distribution Channel, 2023 to 2033

Figure 29: North America Market Attractiveness Analysis by Country, 2023 to 2033

Figure 30: USA Market Value Proportion Analysis, 2022

Figure 31: Global Vs. USA Growth Comparison

Figure 32: USA Market Share Analysis (%) By Product, 2022 to 2033

Figure 33: USA Market Share Analysis (%) By Form, 2022 to 2033

Figure 34: USA Market Share Analysis (%) By Distribution Channel, 2022 to 2033

Figure 35: Canada Market Value Proportion Analysis, 2022

Figure 36: Global Vs. Canada. Growth Comparison

Figure 37: Canada Market Share Analysis (%) By Product, 2022 to 2033

Figure 38: Canada Market Share Analysis (%) By Form, 2022 to 2033

Figure 39: Canada Market Share Analysis (%) By Distribution Channel, 2022 to 2033

Figure 40: Latin America Market Value (US$ Million) Analysis, 2017 to 2022

Figure 41: Latin America Market Value (US$ Million) Forecast, 2023 to 2033

Figure 42: Latin America Market Value Share, By Product (2023 E)

Figure 43: Latin America Market Value Share, By Form (2023 E)

Figure 44: Latin America Market Value Share, By Distribution Channel (2023 E)

Figure 45: Latin America Market Value Share, by Country (2023 E)

Figure 46: Latin America Market Attractiveness Analysis By Product, 2023 to 2033

Figure 47: Latin America Market Attractiveness Analysis By Form, 2023 to 2033

Figure 48: Latin America Market Attractiveness Analysis By Distribution Channel, 2023 to 2033

Figure 49: Latin America Market Attractiveness Analysis by Country, 2023 to 2033

Figure 50: Mexico Market Value Proportion Analysis, 2022

Figure 51: Global Vs Mexico Growth Comparison

Figure 52: Mexico Market Share Analysis (%) By Product, 2022 to 2033

Figure 53: Mexico Market Share Analysis (%) By Form, 2022 to 2033

Figure 54: Mexico Market Share Analysis (%) By Distribution Channel, 2022 to 2033

Figure 55: Brazil Market Value Proportion Analysis, 2022

Figure 56: Global Vs. Brazil. Growth Comparison

Figure 57: Brazil Market Share Analysis (%) By Product, 2022 to 2033

Figure 58: Brazil Market Share Analysis (%) By Form, 2022 to 2033

Figure 59: Brazil Market Share Analysis (%) By Distribution Channel, 2022 to 2033

Figure 60: Argentina Market Value Proportion Analysis, 2022

Figure 61: Global Vs Argentina Growth Comparison

Figure 62: Argentina Market Share Analysis (%) By Product, 2022 to 2033

Figure 63: Argentina Market Share Analysis (%) By Form, 2022 to 2033

Figure 64: Argentina Market Share Analysis (%) By Distribution Channel, 2022 to 2033

Figure 65: Europe Market Value (US$ Million) Analysis, 2017 to 2022

Figure 66: Europe Market Value (US$ Million) Forecast, 2023 to 2033

Figure 67: Europe Market Value Share, By Product (2023 E)

Figure 68: Europe Market Value Share, By Form (2023 E)

Figure 69: Europe Market Value Share, By Distribution Channel (2023 E)

Figure 70: Europe Market Value Share, by Country (2023 E)

Figure 71: Europe Market Attractiveness Analysis By Product, 2023 to 2033

Figure 72: Europe Market Attractiveness Analysis By Form, 2023 to 2033

Figure 73: Europe Market Attractiveness Analysis By Distribution Channel, 2023 to 2033

Figure 74: Europe Market Attractiveness Analysis by Country, 2023 to 2033

Figure 75: UK Market Value Proportion Analysis, 2022

Figure 76: Global Vs. UK Growth Comparison

Figure 77: UK Market Share Analysis (%) By Product, 2022 to 2033

Figure 78: UK Market Share Analysis (%) By Form, 2022 to 2033

Figure 79: UK Market Share Analysis (%) By Distribution Channel, 2022 to 2033

Figure 80: Germany Market Value Proportion Analysis, 2022

Figure 81: Global Vs. Germany Growth Comparison

Figure 82: Germany Market Share Analysis (%) By Product, 2022 to 2033

Figure 83: Germany Market Share Analysis (%) By Form, 2022 to 2033

Figure 84: Germany Market Share Analysis (%) By Distribution Channel, 2022 to 2033

Figure 85: Italy Market Value Proportion Analysis, 2022

Figure 86: Global Vs. Italy Growth Comparison

Figure 87: Italy Market Share Analysis (%) By Product, 2022 to 2033

Figure 88: Italy Market Share Analysis (%) By Form, 2022 to 2033

Figure 89: Italy Market Share Analysis (%) By Distribution Channel, 2022 to 2033

Figure 90: France Market Value Proportion Analysis, 2022

Figure 91: Global Vs France Growth Comparison

Figure 92: France Market Share Analysis (%) By Product, 2022 to 2033

Figure 93: France Market Share Analysis (%) By Form, 2022 to 2033

Figure 94: France Market Share Analysis (%) By Distribution Channel, 2022 to 2033

Figure 95: Spain Market Value Proportion Analysis, 2022

Figure 96: Global Vs Spain Growth Comparison

Figure 97: Spain Market Share Analysis (%) By Product, 2022 to 2033

Figure 98: Spain Market Share Analysis (%) By Form, 2022 to 2033

Figure 99: Spain Market Share Analysis (%) By Distribution Channel, 2022 to 2033

Figure 100: Russia Market Value Proportion Analysis, 2022

Figure 101: Global Vs Russia Growth Comparison

Figure 102: Russia Market Share Analysis (%) By Product, 2022 to 2033

Figure 103: Russia Market Share Analysis (%) By Form, 2022 to 2033

Figure 104: Russia Market Share Analysis (%) By Distribution Channel, 2022 to 2033

Figure 105: BENELUX Market Value Proportion Analysis, 2022

Figure 106: Global Vs BENELUX Growth Comparison

Figure 107: BENELUX Market Share Analysis (%) By Product, 2022 to 2033

Figure 108: BENELUX Market Share Analysis (%) By Form, 2022 to 2033

Figure 109: BENELUX Market Share Analysis (%) By Distribution Channel, 2022 to 2033

Figure 110: East Asia Market Value (US$ Million) Analysis, 2017 to 2022

Figure 111: East Asia Market Value (US$ Million) Forecast, 2023 to 2033

Figure 112: East Asia Market Value Share, By Product (2023 E)

Figure 113: East Asia Market Value Share, By Form (2023 E)

Figure 114: East Asia Market Value Share, By Distribution Channel (2023 E)

Figure 115: East Asia Market Value Share, by Country (2023 E)

Figure 116: East Asia Market Attractiveness Analysis By Product, 2023 to 2033

Figure 117: East Asia Market Attractiveness Analysis By Form, 2023 to 2033

Figure 118: East Asia Market Attractiveness Analysis By Distribution Channel, 2023 to 2033

Figure 119: East Asia Market Attractiveness Analysis by Country, 2023 to 2033

Figure 120: China Market Value Proportion Analysis, 2022

Figure 121: Global Vs. China Growth Comparison

Figure 122: China Market Share Analysis (%) By Product, 2022 to 2033

Figure 123: China Market Share Analysis (%) By Form, 2022 to 2033

Figure 124: China Market Share Analysis (%) By Distribution Channel, 2022 to 2033

Figure 125: Japan Market Value Proportion Analysis, 2022

Figure 126: Global Vs. Japan Growth Comparison

Figure 127: Japan Market Share Analysis (%) By Product, 2022 to 2033

Figure 128: Japan Market Share Analysis (%) By Form, 2022 to 2033

Figure 129: Japan Market Share Analysis (%) By Distribution Channel, 2022 to 2033

Figure 130: South Korea Market Value Proportion Analysis, 2022

Figure 131: Global Vs South Korea Growth Comparison

Figure 132: South Korea Market Share Analysis (%) By Product, 2022 to 2033

Figure 133: South Korea Market Share Analysis (%) By Form, 2022 to 2033

Figure 134: South Korea Market Share Analysis (%) By Distribution Channel, 2022 to 2033

Figure 135: South Asia Market Value (US$ Million) Analysis, 2017 to 2022

Figure 136: South Asia Market Value (US$ Million) Forecast, 2023 to 2033

Figure 137: South Asia Market Value Share, By Product (2023 E)

Figure 138: South Asia Market Value Share, By Form (2023 E)

Figure 139: South Asia Market Value Share, By Distribution Channel (2023 E)

Figure 140: South Asia Market Value Share, by Country (2023 E)

Figure 141: South Asia Market Attractiveness Analysis By Product, 2023 to 2033

Figure 142: South Asia Market Attractiveness Analysis By Form, 2023 to 2033

Figure 143: South Asia Market Attractiveness Analysis By Distribution Channel, 2023 to 2033

Figure 144: South Asia Market Attractiveness Analysis by Country, 2023 to 2033

Figure 145: India Market Value Proportion Analysis, 2022

Figure 146: Global Vs. India Growth Comparison

Figure 147: India Market Share Analysis (%) By Product, 2022 to 2033

Figure 148: India Market Share Analysis (%) By Form, 2022 to 2033

Figure 149: India Market Share Analysis (%) By Distribution Channel, 2022 to 2033

Figure 150: Indonesia Market Value Proportion Analysis, 2022

Figure 151: Global Vs. Indonesia Growth Comparison

Figure 152: Indonesia Market Share Analysis (%) By Product, 2022 to 2033

Figure 153: Indonesia Market Share Analysis (%) By Form, 2022 to 2033

Figure 154: Indonesia Market Share Analysis (%) By Distribution Channel, 2022 to 2033

Figure 155: Malaysia Market Value Proportion Analysis, 2022

Figure 156: Global Vs. Malaysia Growth Comparison

Figure 157: Malaysia Market Share Analysis (%) By Product, 2022 to 2033

Figure 158: Malaysia Market Share Analysis (%) By Form, 2022 to 2033

Figure 159: Malaysia Market Share Analysis (%) By Distribution Channel, 2022 to 2033

Figure 160: Thailand Market Value Proportion Analysis, 2022

Figure 161: Global Vs. Thailand Growth Comparison

Figure 162: Thailand Market Share Analysis (%) By Product, 2022 to 2033

Figure 163: Thailand Market Share Analysis (%) By Form, 2022 to 2033

Figure 164: Thailand Market Share Analysis (%) By Distribution Channel, 2022 to 2033

Figure 165: Oceania Market Value (US$ Million) Analysis, 2017 to 2022

Figure 166: Oceania Market Value (US$ Million) Forecast, 2023 to 2033

Figure 167: Oceania Market Value Share, By Product (2023 E)

Figure 168: Oceania Market Value Share, By Form (2023 E)

Figure 169: Oceania Market Value Share, By Distribution Channel (2023 E)

Figure 170: Oceania Market Value Share, by Country (2023 E)

Figure 171: Oceania Market Attractiveness Analysis By Product, 2023 to 2033

Figure 172: Oceania Market Attractiveness Analysis By Form, 2023 to 2033

Figure 173: Oceania Market Attractiveness Analysis By Distribution Channel, 2023 to 2033

Figure 174: Oceania Market Attractiveness Analysis by Country, 2023 to 2033

Figure 175: Australia Market Value Proportion Analysis, 2022

Figure 176: Global Vs. Australia Growth Comparison

Figure 177: Australia Market Share Analysis (%) By Product, 2022 to 2033

Figure 178: Australia Market Share Analysis (%) By Form, 2022 to 2033

Figure 179: Australia Market Share Analysis (%) By Distribution Channel, 2022 to 2033

Figure 180: New Zealand Market Value Proportion Analysis, 2022

Figure 181: Global Vs New Zealand Growth Comparison

Figure 182: New Zealand Market Share Analysis (%) By Product, 2022 to 2033

Figure 183: New Zealand Market Share Analysis (%) By Form, 2022 to 2033

Figure 184: New Zealand Market Share Analysis (%) By Distribution Channel, 2022 to 2033

Figure 185: Middle East & Africa Market Value (US$ Million) Analysis, 2017 to 2022

Figure 186: Middle East & Africa Market Value (US$ Million) Forecast, 2023 to 2033

Figure 187: Middle East & Africa Market Value Share, By Product (2023 E)

Figure 188: Middle East & Africa Market Value Share, By Form (2023 E)

Figure 189: Middle East & Africa Market Value Share, By Distribution Channel (2023 E)

Figure 190: Middle East & Africa Market Value Share, by Country (2023 E)

Figure 191: Middle East & Africa Market Attractiveness Analysis By Product, 2023 to 2033

Figure 192: Middle East & Africa Market Attractiveness Analysis By Form, 2023 to 2033

Figure 193: Middle East & Africa Market Attractiveness Analysis By Distribution Channel, 2023 to 2033

Figure 194: Middle East & Africa Market Attractiveness Analysis by Country, 2023 to 2033

Figure 195: GCC Countries Market Value Proportion Analysis, 2022

Figure 196: Global Vs GCC Countries Growth Comparison

Figure 197: GCC Countries Market Share Analysis (%) By Product, 2022 to 2033

Figure 198: GCC Countries Market Share Analysis (%) By Form, 2022 to 2033

Figure 199: GCC Countries Market Share Analysis (%) By Distribution Channel, 2022 to 2033

Figure 200: Türkiye Market Value Proportion Analysis, 2022

Figure 201: Global Vs. Türkiye Growth Comparison

Figure 202: Türkiye Market Share Analysis (%) By Product, 2022 to 2033

Figure 203: Türkiye Market Share Analysis (%) By Form, 2022 to 2033

Figure 204: Türkiye Market Share Analysis (%) By Distribution Channel, 2022 to 2033

Figure 205: South Africa Market Value Proportion Analysis, 2022

Figure 206: Global Vs. South Africa Growth Comparison

Figure 207: South Africa Market Share Analysis (%) By Product, 2022 to 2033

Figure 208: South Africa Market Share Analysis (%) By Form, 2022 to 2033

Figure 209: South Africa Market Share Analysis (%) By Distribution Channel, 2022 to 2033

Figure 210: North Africa Market Value Proportion Analysis, 2022

Figure 211: Global Vs North Africa Growth Comparison

Figure 212: North Africa Market Share Analysis (%) By Product, 2022 to 2033

Figure 213: North Africa Market Share Analysis (%) By Form, 2022 to 2033

Figure 214: North Africa Market Share Analysis (%) By Distribution Channel, 2022 to 2033

Recommendations

Food and Beverage

Probiotic Supplement Market

Published : March 2024

Food and Beverage

Dietary Supplement Market

Published : January 2024

Explore Healthcare Insights

View Reports

Ayurvedic Supplement Market