Babassu Oil Market Size, Share, and Forecast Outlook 2025 to 2035

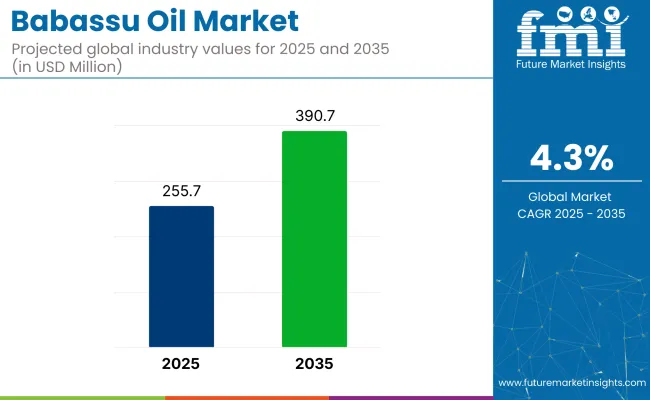
The babassu oil market is projected to reach a value of USD 255.7 million in 2025 and is expected to grow significantly to USD 390.7 million by 2035, reflecting a steady CAGR of 4.3%. This growth trajectory is largely driven by the increasing adoption of Babassu oil across various industries such as cosmetics, personal care, food, and pharmaceuticals.
Quick Stats of Babassu Oil Market

  • Market Value (2025): USD 255.7 million
  • Forecast Value (2035): USD 390.7 million
  • Forecast CAGR (2025 to 2035): 4.3%
  • Leading Segment in 2025: Liquid Forms (65%share)
  • Key Growth Region: Asia Pacific (China is the fastest growing market with 5.3% CAGR)
  • Key Players: Akzo Nobel, Solvay, BASF, Mielle Organics, Cargill, Bunge, Dow Chemical, Sheabutter Cottage, Dr. Adorable Inc., ANITA GRANT.

Babassu Oil Market

Metric Value
Market Size (2025E) USD 255.7 million
Market Value (2035F) USD 390.7 million
CAGR (2025 to 2035) 4.3%

The oil's natural properties, including its emollient, antimicrobial, and anti-inflammatory characteristics, position it as a highly versatile ingredient for numerous applications. Its emergence as a sustainable, eco-friendly alternative to traditional oils, particularly in the beauty and wellness sectors, further strengthens its market potential.Governments are also investing in sustainable products. In January 2025, USDA announced nearly USD 180 million in funding under the REAP and Higher Blends Infrastructure program.

The market holds a niche yet important share within its parent markets. Within the vegetable oil market, Babassu oil accounts for a small percentage, approximately 1-2%, as it is one of many specialty oils produced. In the broader natural oil market, it holds a more significant share of about 3-5%, as demand for plant-based and natural oils continues to grow.

In the cosmetic and personal care market, theyplay a more prominent role, contributing roughly 5-7% due to its moisturizing and skin-nourishing properties. In the pharmaceutical ingredients market, its share is around 2-3%, used primarily in topical formulations. Lastly, in the food & beverage market, thesescontributes 1-2%, utilized for its health benefits and as a natural alternative to other oils.

One of the primary factors driving the market is the growing global trend toward sustainable and clean-label products. With consumers becoming more environmentally conscious and health-focused, there is a clear preference for natural and responsibly sourced ingredients in cosmetics and personal care products. Babassu oil, sourced primarily from Brazil and other parts of Southeast Asia, aligns well with this demand, as it is known for being harvested in a sustainable manner, often by women-led cooperatives.

This focus on ethical sourcing resonates with the increasing number of consumers seeking fair-trade, cruelty-free, and eco-friendly beauty products. Brands like Dr. Bronner's and L'Occitane have already embraced product in their product lines, contributing to its rising popularity in skincare formulations.

Analysis of Babassu Oil Market by Top Investment Segments

The babassu oil market is segmented by form into liquid and solid. By end use, it includes cosmetics and personal care, food and beverages, and industrial applications. By nature, the market is categorized into organic and conventional.

Distribution takes place through pharmacies, specialty stores, supermarkets and hypermarkets, and online retail. The market is regionally segmented into North America, Latin America, Europe, East Asia, South Asia & Pacific, and the Middle East & Africa.

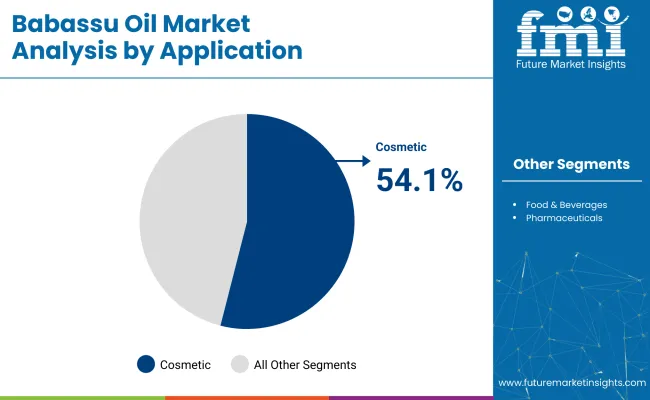
Cosmetic Applications Driving Demand, Capturing 54.1% Share in 2025

Cosmetic and personal care products are expected to account for 54.1% of global babassu oil consumption by 2025. This segment dominates due to the oil’s fast-absorbing, non-greasy profile, which makes it a core emollient in moisturizers, cleansers, shampoos, and hair masks.
  • Babassu oil contains over 40% lauric acid and significant amounts of tocopherols, aiding skin repair and hydration.
  • Inclusion in multifunctional beauty products has grown 2.3× between 2020 and 2024, led by clean beauty claims.
  • Over 58% of new skincare product launches using babassu oil in 2023 carried an “organic” or “vegan” label.

Babassu Oil Market By Application

By Type, Organic Segment Accounts for Over 39.7% Share

Organic babassu oil is projected to contribute 39.7% of total sales in 2025, driven by a global rise in demand for pesticide-free, sustainably harvested ingredients in both cosmetics and food-grade products.

  • Organic variants saw a 31% YoY sales increase in North America between 2022 and 2023.
  • Over 70% of surveyed consumers in Western Europe preferred organic oils in skincare citing allergy risk reduction.
  • Regulatory-certified organic babassu oil products now represent 45% of total SKUs listed on pharmacy shelves in France and Germany.

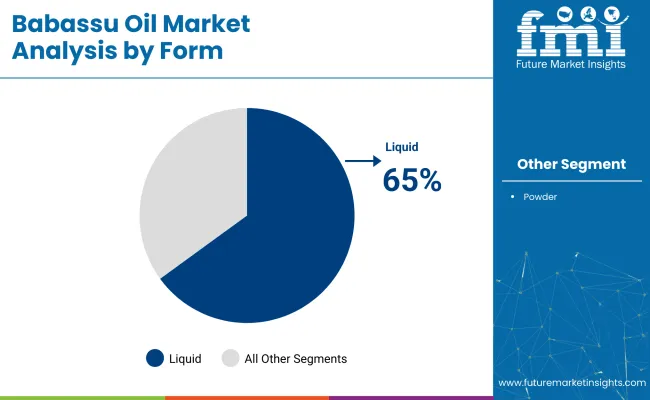
Liquid Forms Dominate Form Segment with 65% Market Share

Liquid babassu oil is expected to maintain 65% of global share by 2025, supported by its utility across manufacturing processes and ease of consumer use.
  • In warmer climates (above 24°C), babassu oil naturally remains liquid, reducing processing requirements.
  • Over 68% of manufacturers surveyed cited liquid form as their default input due to batch uniformity and blending efficiency.
  • Liquid babassu oil also registered 3.6× faster re-order frequency in online channels versus solid variants in 2024.

Babassu Oil Market By Form

Growing Product Sales Through Pharmacy/Drugstore Channel with 45% Share

Pharmacy and drugstore outlets are forecast to contribute 45% of global babassu oil retail sales in 2025. Their stronghold stems from customer trust in therapeutic and dermatologist-recommended personal care.

  • 64% of USA consumers associate pharmacy-sold skincare oils with clinical-grade efficacy.
  • Drugstores in Japan and Germany saw a 22% increase in shelf space allocated to natural oils between 2021 and 2024.
  • Loyalty card data from leading European pharmacy chains shows babassu oil repurchase rates 19% higher than specialty beauty stores.

Top Babassu Oil Market Dynamics

The market is driven by growing demand for natural, sustainable skincare solutions and its positioning as a clean-label alternative to coconut oil. E-commerce expansion and product innovation have further boosted its visibility, with diverse applications across beauty, wellness, and food sectors.

Key Market Dynamics Driving Babassu Oil Growth

The global market is being significantly influenced by the rising demand for natural and organic personal care products, with consumer preferences increasingly shifting toward clean-label, chemical-free alternatives.

This shift has been fueled by heightened awareness of ingredient transparency and the benefits of plant-based oils, particularly in skincare and haircare. Babassu oil, often seen as a sustainable substitute for coconut oil, is being valued for its moisturizing properties, lightweight texture, and non-comedogenic nature. The perception of product as both therapeutic and cosmetic has been further strengthened by its inclusion in premium formulations and dermatologist-recommended products.

  • Rising consumer preference for natural, cold-pressed oils in cosmetic formulations
  • Positioning of babassu oil as a sustainable alternative to coconut oil in the beauty industry
  • Surging demand from wellness-conscious buyers prioritizing organic and non-toxic skincare

E-commerce Expansion and Innovation in Product Applications

The market has also been reshaped by the rapid expansion of e-commerce platforms and the growing accessibility of specialty oils online. A wider audience is being reached through digital retailing, where product is marketed under terms like "virgin babassu oil," "refined babassu oil," and "organic carrier oil."

The online retail environment enables niche brands and DIY-focused consumers to explore product for uses beyond personal care, such as in aromatherapy, massage therapy, and food applications. These diverse use-cases, supported by influencer marketing and social proof, have amplified product’s visibility and boosted its sales momentum across regions.
  • Greater product accessibility through online and specialty retailers targeting natural wellness niches
  • Product innovation expanding babassu oil’s role in haircare, skincare, and food-grade uses
  • Digital marketing influence through beauty bloggers and eco-conscious influencers promoting multipurpose oils

Analysis of Top Countries Manufacturing, Exporting and Supplying Babassu Oil Globally

Country Wise Analysis Of Babassu Oil Market

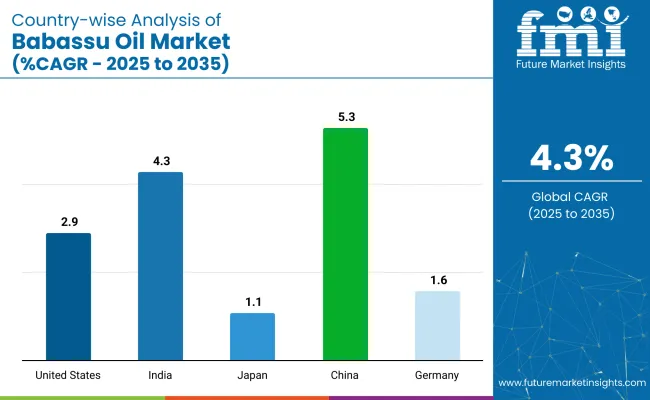
Countries CAGR (2025 to 2035)
United States 2.9%
India 4.3%
Japan 1.1%
China 5.3%
Germany 1.6%

Sales of babassu oil across key countries are forecast to rise steadily, with China leading at a CAGR of 5.3%, followed by India at 4.3%, reflecting strong personal care demand and rapid retail channel expansion. The United States grows at 2.9%, driven by clean beauty trends, while Germany (1.6%) and Japan (1.1%) report slower but steady growth rooted in premiumization and eco-label preferences.

These rates deliver a growth premium of +1.6 to +3.8 percentage points above the Western European average, with BRICS markets (China and India) delivering higher unit volume gains, while OECD countries (US, Germany, Japan) prioritize ingredient purity and traceability.

China exceeds Western Europe’s growth average by +3.7 points, supported by e-commerce integration and domestic skincare innovation. India outpaces by +2.7 points, driven by consumer shift toward plant-based oils and ayurveda-backed beauty formats. USA maintains a +1.3-point premium, reflecting clean-label demand across retail channels.Germany and Japan hold steady, with a 0.0-0.2 point variance from broader OECD trends.

Growth Analysis of Babassu Oil Market in the United States

Demand for babassu oil in the United States is projected to grow at a 2.9% CAGR during the forecast period, driven by the increasing consumer preference for natural, organic products across personal care and beauty sectors. With a growing emphasis on clean beauty and sustainable ingredients, product is being increasingly incorporated into skincare, haircare, and cosmetics formulations.

As awareness around the benefits of plant-based oils like babassu grows, the market is witnessing a surge in demand for this versatile, non-comedogenic oil, especially in high-end, eco-conscious products. The USA is also experiencing a rise in health-conscious consumers who are actively avoiding synthetic chemicals and opting for organic and natural alternatives, further bolstering the demand for babassu oil.

  • Rising consumer demand for natural and organic personal care ingredients in beauty products
  • Growing awareness of clean beauty trends pushing the adoption of product in formulations
  • Increased interest in non-toxic, plant-based ingredients as part of the health-conscious consumer shift

Demand Forecast for Babassu Oil Market in China

The babassu oil market in China is estimated to grow at a 5.3% CAGR during the forecast period, as the country continues to see rapid growth in the natural and organic beauty markets. With amanufacturing and cosmetics industry, the product is becoming a key ingredient in a variety of skincare and haircare products.

The market growth is further driven by the growing awareness among Chinese consumers about the harmful effects of synthetic chemicals and their increasing preference for natural oils. Babassu oil is valued for its lightweight, moisturizing properties and non-greasy texture, making it highly attractive to Chinese consumers seeking gentle, effective beauty products. The rise of e-commerce platforms in China has made it easier for consumers to access international, high-quality beauty products containing product.

  • Growing demand for natural skincare products as Chinese consumers increasingly favor organic ingredients
  • E-commerce expansion enabling wider access to product-based beauty and personal care products
  • Rising health awareness among Chinese consumers, leading to a shift toward non-toxic beauty alternatives

Babassu Oil Market Growth Outlook in Japan

The babassu oil market in Japan is likely to grow at a 1.1% CAGR during the forecast period, influenced by the country’s growing preference for natural and multifunctional beauty products. The Japanese skincare market has long been known for its focus on purity and efficacy, and babassu oil’s reputation for moisturizing and soothing properties has made it a valuable ingredient in cosmetics and personal care products.

The country’s aging population and heightened interest in anti-aging skincare have also contributed to the rising demand for natural oils like babassu. Furthermore, Japan's sustainability initiatives and its commitment to eco-friendly ingredients have positioned product as an attractive alternative to synthetic oils in beauty formulations, driving its growth in the Japanese market.

  • Focus on multifunctional beauty products that offer both effective skincare and eco-friendliness
  • Aging population driving the demand for natural oils with anti-aging properties
  • Sustainability trends pushing the adoption of eco-friendly and plant-based oils like product

Future Outlook for Babassu Oil Market in Germany

The babassu oil market in Germany is expected to grow at a 1.6% CAGR during the forecast period, supported by the country’s strong emphasis on sustainability, eco-friendly products, and organic beauty solutions. Germany is a key player in the European natural beauty and personal care industry, and consumers are increasingly choosing products that contain ingredients like babassu oil, which are sustainably sourced and free from harmful chemicals.

The German market’s growing interest in organic cosmetics and natural oils has driven demand for product, particularly in skincare, haircare, and wellness products. Furthermore, Germany’s regulatory environment, which promotes the use of natural ingredients in cosmetics, has created a favorable landscape for product to thrive.

  • Strong demand for organic and sustainable beauty products aligned with Germany’s eco-conscious market
  • Regulatory support for natural ingredients in the German cosmetics industry, boosting babassu oil’s appeal
  • Consumer preference for chemical-free skincare driving the adoption of babassu oil in personal care formulations

Analysis of Babassu Oil Market in India

The babassu oil market in India is likely to grow at a 4.3% CAGR during the forecast period, propelled by the country’s increasing interest in organic and natural beauty solutions. India’s rapidly expanding middle class, coupled with rising disposable incomes, has led to a greater demand for high-quality, natural personal care products. Babassu oil’s multifunctional properties, including its ability to moisturize, nourish, and protect skin and hair, have contributed to its rising popularity among Indian consumers.

The increasing adoption of plant-based, chemical-free ingredients in beauty products has paved the way for market growth. The growing trend toward eco-conscious, sustainable products, along with India’s vast agricultural sector, is helping drive both domestic and international demand for product.

  • Increasing middle-class population driving demand for premium, natural personal care products
  • Rising preference for organic and chemical-free ingredients in beauty products
  • Expanding awareness of sustainability fueling the adoption of product in skincare and haircare formulations

Leading Babassu Oil Suppliers

The industry is driven by established players and emerging innovators focused on natural oils, sustainable beauty products, and organic ingredients. Key companies like Akzo Nobel, Solvay, and BASF lead with advanced chemical solutions and sustainable sourcing, while Cargill and Bunge have made strides in the natural oils market, offering high-quality product for personal care and food applications.

Mielle Organics and ANITA GRANT are prominent innovators in the beauty sector, formulating luxurious, organic skincare and haircare products with babassu oil. In the niche natural beauty space, Sheabutter Cottage and Dr. Adorable Inc. are known for their eco-conscious formulations, blending product into their offerings to cater to health-conscious consumers. These key players, alongside the rising focus on clean beauty and sustainable sourcing, are driving the growth in global markets.

Recent Babassu Oil Industry News

  • In November 2024, BASF partners with Acies Bio to drive sustainable production of Personal and Home Care ingredients.

Leading Players

  • Akzo Nobel
  • Solvay
  • BASF
  • Mielle Organics
  • Cargill
  • Bunge
  • Dow Chemical
  • Sheabutter Cottage
  • Dr. Adorable Inc.
  • ANITA GRANT

Report Coverage and Scope Summary

Report Attributes Details
Market Size (2025) USD 255.7 million
Projected Market Size (2035) USD 390.7 million
CAGR (2025 to 2035) 4.3%
Base Year for Estimation 2024
Historical Period 2020 to 2024
Projections Period 2025 to 2035
Quantitative Units USD million for value and volume in kilo tons
Type Analyzed (Segment 1) Conventional and Organic
Form Analyzed (Segment 2) Powder and Liquid.
Applications Analyzed (Segment 3) Food & Beverage, Pharmaceutical, and Cosmetics.
Sales Channel Analyzed (Segment 4) Pharmacy, Beauty Salon, Specialty Stores, and Online Retailing.
Regions Covered North America, Europe, Asia Pacific, Middle East & Africa, Latin America
Countries Covered United States, Canada, Germany, United Kingdom, France, Italy, Spain, China, Japan, South Korea, India, Australia, Brazil, Mexico, Argentina, Saudi Arabia, UAE, South Africa
Key Players Akzo Nobel, Solvay, BASF, Mielle Organics, Cargill, Bunge, Dow Chemical, Sheabutter Cottage, Dr. Adorable Inc., ANITA GRANT.
Additional Attributes Dollar sales projections, market share by region and application, growth rates across segments (cosmetics, food, etc.), competitor strategies, demand trends, pricing analysis, distribution channels, regulatory insights, and consumer preferences.

Key Segments

By Type:

The industry is segmented conventional and organic.

By Form:

The key forms include powder and liquid.

By Application:

The industry finds applications in food & beverage, pharmaceutical, and cosmetics.

By Sales Channel:

The segment is divided into pharmacy, beauty salon, specialty stores, and online retailing.

By Region:

The industry covers regions including North America, Europe, Asia Pacific, Latin America, and the Middle East & Africa.

Table of Content

  1. Executive Summary
  2. Industry Introduction, including Taxonomy and Market Definition
  3. Trends and Success Factors, including Macro-economic Factors, Market Dynamics, and Recent Industry Developments
  4. Global Market Demand Analysis 2020 to 2024 and Forecast 2025 to 2035, including Historical Analysis and Future Projections
  5. Pricing Analysis
  6. Global Market Analysis 2020 to 2024 and Forecast 2025 to 2035
    • Type
    • Form
    • Application
    • Sales Channel
  7. By Type
    • Conventional
    • Organic
  8. By Form
    • Liquid
    • Solid
  9. By Application
    • Food & Beverage
    • Pharmaceutical
    • Cosmetics
  10. By Sales Channel
    • Pharmacy
    • Beauty Salon
    • Specialty Stores
    • Online Retailing
  11. By Region
    • North America
    • Latin America
    • Western Europe
    • Eastern Europe
    • East Asia
    • South Asia & Pacific
    • Central Asia
    • Russia and Belarus
    • Balkan & Baltic Countries
    • Middle East and Africa
  12. North America Sales Analysis 2020 to 2024 and Forecast 2025 to 2035, by Key Segments and Countries
  13. Latin America Sales Analysis 2020 to 2024 and Forecast 2025 to 2035, by Key Segments and Countries
  14. Western Europe Sales Analysis 2020 to 2024 and Forecast 2025 to 2035, by Key Segments and Countries
  15. Eastern Europe Sales Analysis 2020 to 2024 and Forecast 2025 to 2035, by Key Segments and Countries
  16. East Asia Sales Analysis 2020 to 2024 and Forecast 2025 to 2035, by Key Segments and Countries
  17. South Asia & Pacific Sales Analysis 2020 to 2024 and Forecast 2025 to 2035, by Key Segments and Countries
  18. Central Asia Sales Analysis 2020 to 2024 and Forecast 2025 to 2035, by Key Segments and Countries
  19. Russia and Belarus Sales Analysis 2020 to 2024 and Forecast 2025 to 2035, by Key Segments and Countries
  20. Balkan & Baltic Countries Sales Analysis 2020 to 2024 and Forecast 2025 to 2035, by Key Segments and Countries
  21. Middle East and Africa Sales Analysis 2020 to 2024 and Forecast 2025 to 2035, by Key Segments and Countries
  22. Sales Forecast to 2035 by Type, Form, Application, and Sales Channel for 30 Countries
  23. Competitive Assessment, Company Share Analysis by Key Players, and Competition Dashboard
  24. Company Profile
    • Akzo Nobel
    • Solvay
    • BASF
    • Mielle Organics
    • Cargill
    • Bunge
    • Dow Chemical
    • Sheabutter Cottage
    • Dr. Adorable Inc.
    • ANITA GRANT

List of Tables

  • Table 1: Global Market Value (USD Million) & Volume (MT) Forecast by Region, 2020-2035
  • Table 2: Global Market Value (USD Million) & Volume (MT) Forecast by Type, 2020-2035
  • Table 3: Global Market Value (USD Million) & Volume (MT) Forecast by Form, 2020-2035
  • Table 4: Global Market Value (USD Million) & Volume (MT) Forecast by Application, 2020-2035
  • Table 5: Global Market Value (USD Million) & Volume (MT) Forecast by Sales Channel, 2020-2035
  • Table 6: North America Market Value (USD Million) & Volume (MT) Forecast by Country, 2020-2035
  • Table 7: North America Market Value (USD Million) & Volume (MT) Forecast by Type, 2020-2035
  • Table 8: North America Market Value (USD Million) & Volume (MT) Forecast by Form, 2020-2035
  • Table 9: North America Market Value (USD Million) & Volume (MT) Forecast by Application, 2020-2035
  • Table 10: North America Market Value (USD Million) & Volume (MT) Forecast by Sales Channel, 2020-2035
  • Table 11: Latin America Market Value (USD Million) & Volume (MT) Forecast by Country, 2020-2035
  • Table 12: Latin America Market Value (USD Million) & Volume (MT) Forecast by Type, 2020-2035
  • Table 13: Latin America Market Value (USD Million) & Volume (MT) Forecast by Form, 2020-2035
  • Table 14: Latin America Market Value (USD Million) & Volume (MT) Forecast by Application, 2020-2035
  • Table 15: Latin America Market Value (USD Million) & Volume (MT) Forecast by Sales Channel, 2020-2035
  • Table 16: Western Europe Market Value (USD Million) & Volume (MT) Forecast by Country, 2020-2035
  • Table 17: Western Europe Market Value (USD Million) & Volume (MT) Forecast by Type, 2020-2035
  • Table 18: Western Europe Market Value (USD Million) & Volume (MT) Forecast by Form, 2020-2035
  • Table 19: Western Europe Market Value (USD Million) & Volume (MT) Forecast by Application, 2020-2035
  • Table 20: Western Europe Market Value (USD Million) & Volume (MT) Forecast by Sales Channel, 2020-2035
  • Table 21: Eastern Europe Market Value (USD Million) & Volume (MT) Forecast by Country, 2020-2035
  • Table 22: Eastern Europe Market Value (USD Million) & Volume (MT) Forecast by Type, 2020-2035
  • Table 23: Eastern Europe Market Value (USD Million) & Volume (MT) Forecast by Form, 2020-2035
  • Table 24: Eastern Europe Market Value (USD Million) & Volume (MT) Forecast by Application, 2020-2035
  • Table 25: Eastern Europe Market Value (USD Million) & Volume (MT) Forecast by Sales Channel, 2020-2035
  • Table 26: East Asia Market Value (USD Million) & Volume (MT) Forecast by Country, 2020-2035
  • Table 27: East Asia Market Value (USD Million) & Volume (MT) Forecast by Type, 2020-2035
  • Table 28: East Asia Market Value (USD Million) & Volume (MT) Forecast by Form, 2020-2035
  • Table 29: East Asia Market Value (USD Million) & Volume (MT) Forecast by Application, 2020-2035
  • Table 30: East Asia Market Value (USD Million) & Volume (MT) Forecast by Sales Channel, 2020-2035
  • Table 31: South Asia & Pacific Market Value (USD Million) & Volume (MT) Forecast by Country, 2020-2035
  • Table 32: South Asia & Pacific Market Value (USD Million) & Volume (MT) Forecast by Type, 2020-2035
  • Table 33: South Asia & Pacific Market Value (USD Million) & Volume (MT) Forecast by Form, 2020-2035
  • Table 34: South Asia & Pacific Market Value (USD Million) & Volume (MT) Forecast by Application, 2020-2035
  • Table 35: South Asia & Pacific Market Value (USD Million) & Volume (MT) Forecast by Sales Channel, 2020-2035
  • Table 36: Central Asia Market Value (USD Million) & Volume (MT) Forecast by Country, 2020-2035
  • Table 37: Central Asia Market Value (USD Million) & Volume (MT) Forecast by Type, 2020-2035
  • Table 38: Central Asia Market Value (USD Million) & Volume (MT) Forecast by Form, 2020-2035
  • Table 39: Central Asia Market Value (USD Million) & Volume (MT) Forecast by Application, 2020-2035
  • Table 40: Central Asia Market Value (USD Million) & Volume (MT) Forecast by Sales Channel, 2020-2035
  • Table 41: Russia and Belarus Market Value (USD Million) & Volume (MT) Forecast by Country, 2020-2035
  • Table 42: Russia and Belarus Market Value (USD Million) & Volume (MT) Forecast by Type, 2020-2035
  • Table 43: Russia and Belarus Market Value (USD Million) & Volume (MT) Forecast by Form, 2020-2035
  • Table 44: Russia and Belarus Market Value (USD Million) & Volume (MT) Forecast by Application, 2020-2035
  • Table 45: Russia and Belarus Market Value (USD Million) & Volume (MT) Forecast by Sales Channel, 2020-2035
  • Table 46: Balkan & Baltic Countries Market Value (USD Million) & Volume (MT) Forecast by Country, 2020-2035
  • Table 47: Balkan & Baltic Countries Market Value (USD Million) & Volume (MT) Forecast by Type, 2020-2035
  • Table 48: Balkan & Baltic Countries Market Value (USD Million) & Volume (MT) Forecast by Form, 2020-2035
  • Table 49: Balkan & Baltic Countries Market Value (USD Million) & Volume (MT) Forecast by Application, 2020-2035
  • Table 50: Balkan & Baltic Countries Market Value (USD Million) & Volume (MT) Forecast by Sales Channel, 2020-2035
  • Table 51: Middle East and Africa Market Value (USD Million) & Volume (MT) Forecast by Country, 2020-2035
  • Table 52: Middle East and Africa Market Value (USD Million) & Volume (MT) Forecast by Type, 2020-2035
  • Table 53: Middle East and Africa Market Value (USD Million) & Volume (MT) Forecast by Form, 2020-2035
  • Table 54: Middle East and Africa Market Value (USD Million) & Volume (MT) Forecast by Application, 2020-2035
  • Table 55: Middle East and Africa Market Value (USD Million) & Volume (MT) Forecast by Sales Channel, 2020-2035

List of Figures

  • Figure 1: Global Market Value Share (%), Growth Rate (Y-o-Y), and Value (USD Million) & Volume (MT) Projection by Type, 2020-2035
  • Figure 2: Global Market Value Share (%), Growth Rate (Y-o-Y), and Value (USD Million) & Volume (MT) Projection by Form, 2020-2035
  • Figure 3: Global Market Value Share (%), Growth Rate (Y-o-Y), and Value (USD Million) & Volume (MT) Projection by Application, 2020-2035
  • Figure 4: Global Market Value Share (%), Growth Rate (Y-o-Y), and Value (USD Million) & Volume (MT) Projection by Sales Channel, 2020-2035
  • Figure 5: Global Market Value Share (%), Growth Rate (Y-o-Y), and Value (USD Million) & Volume (MT) Projection by Region, 2020-2035
  • Figure 6: North America Market Value Share (%), Growth Rate (Y-o-Y), and Value (USD Million) & Volume (MT) Projection by Type, 2020-2035
  • Figure 7: North America Market Value Share (%), Growth Rate (Y-o-Y), and Value (USD Million) & Volume (MT) Projection by Form, 2020-2035
  • Figure 8: North America Market Value Share (%), Growth Rate (Y-o-Y), and Value (USD Million) & Volume (MT) Projection by Application, 2020-2035
  • Figure 9: North America Market Value Share (%), Growth Rate (Y-o-Y), and Value (USD Million) & Volume (MT) Projection by Sales Channel, 2020-2035
  • Figure 10: North America Market Value Share (%), Growth Rate (Y-o-Y), and Value (USD Million) & Volume (MT) Projection by Country, 2020-2035
  • Figure 11: Latin America Market Value Share (%), Growth Rate (Y-o-Y), and Value (USD Million) & Volume (MT) Projection by Type, 2020-2035
  • Figure 12: Latin America Market Value Share (%), Growth Rate (Y-o-Y), and Value (USD Million) & Volume (MT) Projection by Form, 2020-2035
  • Figure 13: Latin America Market Value Share (%), Growth Rate (Y-o-Y), and Value (USD Million) & Volume (MT) Projection by Application, 2020-2035
  • Figure 14: Latin America Market Value Share (%), Growth Rate (Y-o-Y), and Value (USD Million) & Volume (MT) Projection by Sales Channel, 2020-2035
  • Figure 15: Latin America Market Value Share (%), Growth Rate (Y-o-Y), and Value (USD Million) & Volume (MT) Projection by Country, 2020-2035
  • Figure 16: Western Europe Market Value Share (%), Growth Rate (Y-o-Y), and Value (USD Million) & Volume (MT) Projection by Type, 2020-2035
  • Figure 17: Western Europe Market Value Share (%), Growth Rate (Y-o-Y), and Value (USD Million) & Volume (MT) Projection by Form, 2020-2035
  • Figure 18: Western Europe Market Value Share (%), Growth Rate (Y-o-Y), and Value (USD Million) & Volume (MT) Projection by Application, 2020-2035
  • Figure 19: Western Europe Market Value Share (%), Growth Rate (Y-o-Y), and Value (USD Million) & Volume (MT) Projection by Sales Channel, 2020-2035
  • Figure 20: Western Europe Market Value Share (%), Growth Rate (Y-o-Y), and Value (USD Million) & Volume (MT) Projection by Country, 2020-2035
  • Figure 21: Eastern Europe Market Value Share (%), Growth Rate (Y-o-Y), and Value (USD Million) & Volume (MT) Projection by Type, 2020-2035
  • Figure 22: Eastern Europe Market Value Share (%), Growth Rate (Y-o-Y), and Value (USD Million) & Volume (MT) Projection by Form, 2020-2035
  • Figure 23: Eastern Europe Market Value Share (%), Growth Rate (Y-o-Y), and Value (USD Million) & Volume (MT) Projection by Application, 2020-2035
  • Figure 24: Eastern Europe Market Value Share (%), Growth Rate (Y-o-Y), and Value (USD Million) & Volume (MT) Projection by Sales Channel, 2020-2035
  • Figure 25: Eastern Europe Market Value Share (%), Growth Rate (Y-o-Y), and Value (USD Million) & Volume (MT) Projection by Country, 2020-2035
  • Figure 26: East Asia Market Value Share (%), Growth Rate (Y-o-Y), and Value (USD Million) & Volume (MT) Projection by Type, 2020-2035
  • Figure 27: East Asia Market Value Share (%), Growth Rate (Y-o-Y), and Value (USD Million) & Volume (MT) Projection by Form, 2020-2035
  • Figure 28: East Asia Market Value Share (%), Growth Rate (Y-o-Y), and Value (USD Million) & Volume (MT) Projection by Application, 2020-2035
  • Figure 29: East Asia Market Value Share (%), Growth Rate (Y-o-Y), and Value (USD Million) & Volume (MT) Projection by Sales Channel, 2020-2035
  • Figure 30: East Asia Market Value Share (%), Growth Rate (Y-o-Y), and Value (USD Million) & Volume (MT) Projection by Country, 2020-2035
  • Figure 31: South Asia & Pacific Market Value Share (%), Growth Rate (Y-o-Y), and Value (USD Million) & Volume (MT) Projection by Type, 2020-2035
  • Figure 32: South Asia & Pacific Market Value Share (%), Growth Rate (Y-o-Y), and Value (USD Million) & Volume (MT) Projection by Form, 2020-2035
  • Figure 33: South Asia & Pacific Market Value Share (%), Growth Rate (Y-o-Y), and Value (USD Million) & Volume (MT) Projection by Application, 2020-2035
  • Figure 34: South Asia & Pacific Market Value Share (%), Growth Rate (Y-o-Y), and Value (USD Million) & Volume (MT) Projection by Sales Channel, 2020-2035
  • Figure 35: South Asia & Pacific Market Value Share (%), Growth Rate (Y-o-Y), and Value (USD Million) & Volume (MT) Projection by Country, 2020-2035
  • Figure 36: Central Asia Market Value Share (%), Growth Rate (Y-o-Y), and Value (USD Million) & Volume (MT) Projection by Type, 2020-2035
  • Figure 37: Central Asia Market Value Share (%), Growth Rate (Y-o-Y), and Value (USD Million) & Volume (MT) Projection by Form, 2020-2035
  • Figure 38: Central Asia Market Value Share (%), Growth Rate (Y-o-Y), and Value (USD Million) & Volume (MT) Projection by Application, 2020-2035
  • Figure 39: Central Asia Market Value Share (%), Growth Rate (Y-o-Y), and Value (USD Million) & Volume (MT) Projection by Sales Channel, 2020-2035
  • Figure 40: Central Asia Market Value Share (%), Growth Rate (Y-o-Y), and Value (USD Million) & Volume (MT) Projection by Country, 2020-2035
  • Figure 41: Russia and Belarus Market Value Share (%), Growth Rate (Y-o-Y), and Value (USD Million) & Volume (MT) Projection by Type, 2020-2035
  • Figure 42: Russia and Belarus Market Value Share (%), Growth Rate (Y-o-Y), and Value (USD Million) & Volume (MT) Projection by Form, 2020-2035
  • Figure 43: Russia and Belarus Market Value Share (%), Growth Rate (Y-o-Y), and Value (USD Million) & Volume (MT) Projection by Application, 2020-2035
  • Figure 44: Russia and Belarus Market Value Share (%), Growth Rate (Y-o-Y), and Value (USD Million) & Volume (MT) Projection by Sales Channel, 2020-2035
  • Figure 45: Russia and Belarus Market Value Share (%), Growth Rate (Y-o-Y), and Value (USD Million) & Volume (MT) Projection by Country, 2020-2035
  • Figure 46: Balkan & Baltic Countries Market Value Share (%), Growth Rate (Y-o-Y), and Value (USD Million) & Volume (MT) Projection by Type, 2020-2035
  • Figure 47: Balkan & Baltic Countries Market Value Share (%), Growth Rate (Y-o-Y), and Value (USD Million) & Volume (MT) Projection by Form, 2020-2035
  • Figure 48: Balkan & Baltic Countries Market Value Share (%), Growth Rate (Y-o-Y), and Value (USD Million) & Volume (MT) Projection by Application, 2020-2035
  • Figure 49: Balkan & Baltic Countries Market Value Share (%), Growth Rate (Y-o-Y), and Value (USD Million) & Volume (MT) Projection by Sales Channel, 2020-2035
  • Figure 50: Balkan & Baltic Countries Market Value Share (%), Growth Rate (Y-o-Y), and Value (USD Million) & Volume (MT) Projection by Country, 2020-2035
  • Figure 51: Middle East and Africa Market Value Share (%), Growth Rate (Y-o-Y), and Value (USD Million) & Volume (MT) Projection by Type, 2020-2035
  • Figure 52: Middle East and Africa Market Value Share (%), Growth Rate (Y-o-Y), and Value (USD Million) & Volume (MT) Projection by Form, 2020-2035
  • Figure 53: Middle East and Africa Market Value Share (%), Growth Rate (Y-o-Y), and Value (USD Million) & Volume (MT) Projection by Application, 2020-2035
  • Figure 54: Middle East and Africa Market Value Share (%), Growth Rate (Y-o-Y), and Value (USD Million) & Volume (MT) Projection by Sales Channel, 2020-2035
  • Figure 55: Middle East and Africa Market Value Share (%), Growth Rate (Y-o-Y), and Value (USD Million) & Volume (MT) Projection by Country, 2020-2035

Frequently Asked Questions

What is the estimated market size of the babassu oil market in 2025?

The industry is valued at USD 255.7 million in 2025.

What is the projected industry size of the babassu oil market by 2035?

It is forecasted to reach USD 390.7 million by 2035.

What is the expected CAGR for the babassu oil industry between 2025 and 2035?

The industry is anticipated to grow at a CAGR of 4.3% during this period.

Which segment is expected to lead the babassu oil market in 2025?

Liquid forms are projected to lead the market with a 65% share in 2025.

Which region is expected to witness the highest growth in the babassu oil market?

Asia Pacific, particularly China, is expected to be the key growth region with a projected growth rate of 5.3%.

Explore Similar Insights

Future Market Insights

Babassu Oil Market