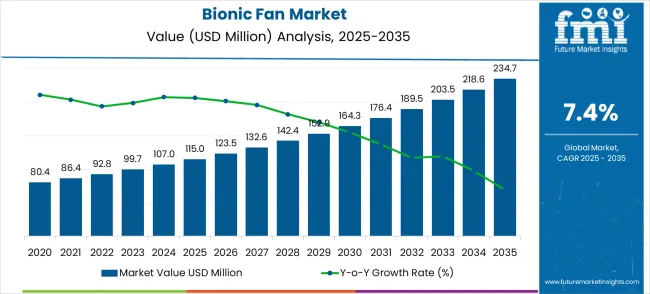
The bionic fan market, valued at USD 115 million in 2025 and projected to reach USD 234.7 million by 2035 at a CAGR of 7.4%, displays notable breakpoints where growth acceleration or moderation is evident. Between 2025 and 2027, the market experiences steady incremental growth, moving from USD 115.0 million to USD 132.6 million, driven by early adoption and rising industrial demand.
A more significant growth phase occurs between 2028 and 2031, with values climbing from USD 142.4 million to USD 176.4 million, reflecting broader market penetration and technological adoption. The final stage, 2032–2035, records an upswing to USD 234.7 million, indicating intensified consumer acceptance and scaling of production capacities.
| Metric | Value |
|---|---|
| Market Value (2025) | USD 115 million |
| Market Forecast Value (2035) | USD 234.7 million |
| Forecast CAGR (2025–2035) | 7.4% |
During the initial half-decade, market values increase from USD 115.0 million in 2025 to USD 152.9 million in 2030, representing steady growth at a moderate pace. This period is characterized by the introduction of improved bionic fan technologies, growing awareness in commercial and residential sectors, and gradual replacement of conventional fans. While growth is consistent, certain years, such as 2027 to 2028 (USD 132.6 million to USD 142.4 million), reflect subtle acceleration due to new product launches and early regional market expansions. These early breakpoints indicate the transition from foundational adoption to wider market acceptance, setting the stage for more pronounced growth in the subsequent half-decade.
From 2030 to 2035, the market experiences a more pronounced growth curve, rising from USD 152.9 million to USD 234.7 million. Breakpoints are observed around 2032 and 2033, where annual increments of USD 12–15 million signal accelerated adoption, expanded distribution, and increased consumer preference. Market maturity, coupled with cost optimization in production, enhances profitability and fuels higher revenue gains.
The second half-decade contributes the majority of overall growth, highlighting the weighted importance of late-stage adoption and large-scale deployment. This period’s breakpoints demonstrate critical inflection points for stakeholders to optimize production, marketing, and distribution strategies to maximize market share.
The Bionic Fan market is entering a new phase of growth, driven by demand for energy-efficient cooling, industrial automation expansion, and evolving sustainability and performance standards. By 2035, these pathways together can unlock USD 85-110 million in incremental revenue opportunities beyond baseline growth.
Pathway A -- Industrial Application Leadership (Manufacturing & Processing) The industrial segment already holds the largest share due to its demanding cooling requirements and energy efficiency focus. Expanding biomimetic innovations, smart controls, and industrial-grade durability can consolidate leadership. Opportunity pool: USD 25-35 million.
Pathway B -- High-Efficiency Axial Flow Designs (Energy Optimization) Axial flow fans account for the majority of demand. Growing industrial focus on energy efficiency, especially in emerging economies, will drive higher adoption of biomimetic axial designs for optimal airflow management. Opportunity pool: USD 20-28 million.
Pathway C -- Data Center & IT Cooling Growth. Professional data center operators and IT infrastructure providers are expanding, especially in digital transformation centers. Bionic fans tailored for precision cooling applications (low-noise, high-reliability, thermal-optimized) can capture significant growth. Opportunity pool: USD 12-18 million.
Pathway D -- Emerging Market Expansion. Asia-Pacific, Middle East, and Latin America present growing demand due to rising industrial infrastructure. Targeting distribution networks and cost-effective product lines will accelerate adoption. Opportunity pool: USD 10-15 million.
Pathway E -- Medical & Healthcare Applications. With stricter air quality and noise regulations in healthcare facilities, there is an opportunity to promote ultra-quiet biomimetic designs and medical-grade air circulation systems. Opportunity pool: USD 8-12 million.
Pathway F -- Premium Smart Features. Bionic fans with smart connectivity, predictive maintenance, and adaptive control systems offer premium positioning for smart factories, automated facilities, and Industry 4.0 applications. Opportunity pool: USD 6-10 million.
Pathway G -- Service, Parts & Lifecycle Value. Recurring revenue from replacement components, maintenance contracts, and performance optimization services creates a long-term revenue stream. Opportunity pool: USD 4-7 million.
Pathway H -- Sustainability & Green Technology. Digital monitoring, carbon footprint tracking, and energy optimization analytics can elevate bionic fans into "sustainable cooling" solutions while strengthening environmental compliance. Opportunity pool: USD 3-5 million.
Why is the Bionic Fan Market Growing?
Market expansion is being supported by the rapid increase in industrial automation worldwide and the corresponding need for efficient cooling equipment that provides superior aerodynamic performance and energy optimization. Modern industrial facilities rely on consistent thermal management and air circulation quality to ensure optimal equipment performance including manufacturing environments, data centers, and processing facilities. Even minor cooling inefficiencies can require comprehensive thermal protocol adjustments to maintain optimal facility standards and operational performance.
The growing complexity of industrial cooling requirements and increasing demand for high-efficiency thermal management solutions are driving demand for bionic fan equipment from certified manufacturers with appropriate performance capabilities and technical expertise. Industrial facility management companies are increasingly requiring documented energy efficiency and equipment reliability to maintain operational quality and cost effectiveness. Industry specifications and performance standards are establishing standardized cooling procedures that require specialized biomimetic technologies and trained operators.
The market is segmented by fan type, application, and region. By fan type, the market is divided into axial flow, centrifugal, and others. Based on application, the market is categorized into industrial, household, medical, and others. Regionally, the market is divided into North America, Europe, East Asia, South Asia & Pacific, Latin America, and Middle East & Africa.
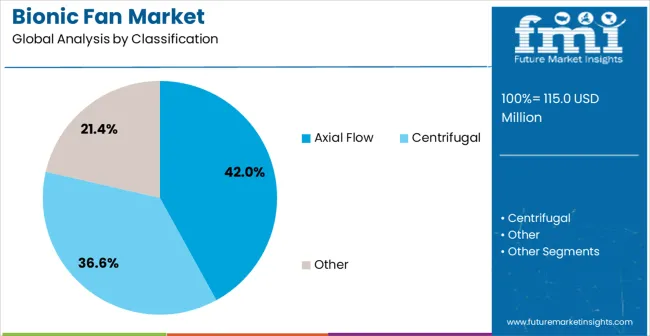
In 2025, the axial flow bionic fan segment is projected to capture 42% of the total market, positioning it as the leading product category. Its dominance is driven by biomimetic axial designs that optimize airflow patterns inspired by nature, delivering high-volume, low-pressure air movement for industrial cooling applications. Axial flow fans are preferred for energy-efficient performance, reduced noise, and reliable airflow, making them suitable for manufacturing plants, data centers, and telecommunication facilities. Established product lines, customization options, and robust technical support from manufacturers reinforce the segment’s market strength. The design’s versatility and proven operational efficiency ensure consistent demand across regions, particularly in facilities prioritizing energy conservation and cost-effective cooling. With biomimetic efficiency and advanced airflow optimization, axial flow bionic fans continue to be the preferred choice for industrial cooling solutions.
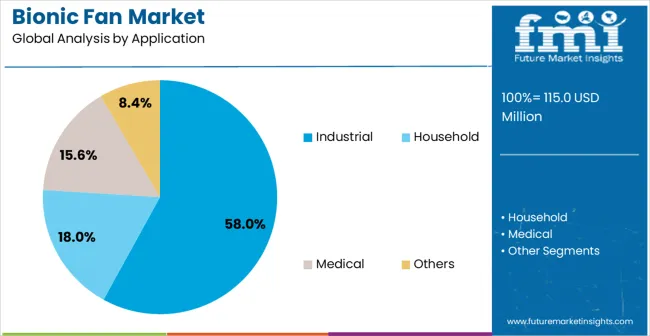
The industrial segment is projected to account for 58% of bionic fan demand in 2025, highlighting its status as the dominant application sector. Manufacturing, processing, and industrial automation environments require continuous air circulation, precise thermal management, and energy-efficient cooling solutions to maintain operational performance. Bionic fans deliver optimized airflow patterns, high energy efficiency, and reduced noise levels, meeting complex cooling requirements across extended operating periods. Growth is supported by global expansion of smart manufacturing systems, rising energy efficiency standards, and industrial investments in sustainability initiatives. Facilities increasingly adopt bionic fans to reduce operational costs, improve equipment longevity, and enhance workplace safety. The segment also benefits from rising regulatory pressures and competitive industrial environments emphasizing efficient and reliable thermal management solutions. Continuous technological advancements and focus on performance optimization ensure industrial applications remain the primary driver of bionic fan market growth.
The Bionic Fan market is advancing steadily due to increasing industrial automation and growing recognition of biomimetic technology advantages over conventional fan designs. However, the market faces challenges including higher initial equipment costs compared to traditional fans, need for specialized technical expertise for optimization, and varying performance requirements across different industrial applications. Technology advancement efforts and biomimetic research programs continue to influence equipment development and market adoption patterns.
The growing development of advanced biomimetic design systems is enabling higher aerodynamic efficiency with improved energy performance and reduced noise characteristics. Enhanced blade geometries and optimized flow patterns provide superior cooling performance while maintaining operational efficiency requirements. These technologies are particularly valuable for industrial facility operators who require reliable cooling performance that can support extensive production operations with consistent results.
Modern bionic fan manufacturers are incorporating advanced control features and intelligent monitoring systems that enhance operational efficiency and equipment effectiveness. Integration of advanced sensor systems and optimized control algorithms enables superior thermal management and comprehensive cooling capabilities. Advanced control features support operation in diverse industrial environments while meeting various performance requirements and operational specifications.
| Country | CAGR (2025–2035) |
|---|---|
| China | 10% |
| India | 9.3% |
| Germany | 8.5% |
| Brazil | 7.8% |
| United States | 7.0% |
| United Kingdom | 6.3% |
| Japan | 5.6% |
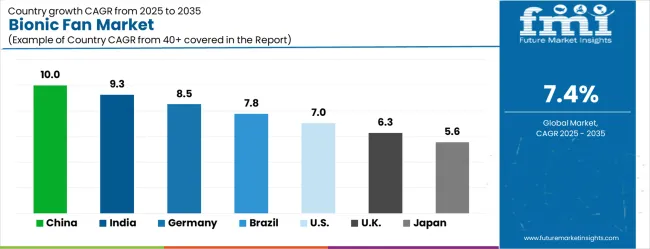
The bionic fan market is growing rapidly, with China leading at a 10% CAGR through 2035, driven by strong industrial automation development and increasing adoption of energy-efficient cooling equipment. India follows at 9.3%, supported by rising manufacturing infrastructure development and growing awareness of biomimetic technology solutions. Germany grows steadily at 8.5%, integrating bionic fan technology into its established industrial automation infrastructure. Brazil records 7.8%, emphasizing industrial modernization and equipment upgrade initiatives. The United States shows solid growth at 7%, focusing on energy efficiency enhancement and operational optimization. The United Kingdom demonstrates steady progress at 6.3%, maintaining established industrial cooling applications. Japan records 5.6% growth, concentrating on technology advancement and precision optimization.
The report covers an in-depth analysis of 40+ countries top-performing countries are highlighted below.
Revenue from bionic fans in China is projected to grow at a CAGR of 10% through 2035, driven by rapid industrial automation and strong demand for energy-efficient cooling solutions. Expanding manufacturing facilities and automated production centers are creating significant opportunities for advanced thermal management systems. Government initiatives promoting smart manufacturing and industrial modernization are further accelerating adoption of biomimetic fans. Manufacturers are establishing extensive distribution networks to serve growing industrial hubs, ensuring operational reliability and energy optimization across multiple sectors. Industrial automation expansion, combined with the need for efficient cooling in production environments, is central to China’s market growth.
Bionic fan revenue in India is expected to expand at a CAGR of 9.3%, fueled by rapid industrial sector growth and increasing adoption of energy-efficient cooling solutions. Expanding manufacturing infrastructure and higher facility management standards are creating strong demand for advanced thermal management equipment. Professional training programs and service support are enhancing technical expertise, enabling effective implementation of bionic fan systems. Industrial operators are gradually adopting biomimetic fans to meet operational requirements while improving energy efficiency and performance consistency.
The German market for bionic fans is projected to grow at a CAGR of 8.5%, driven by industrial energy efficiency priorities and regulatory standards. Manufacturing companies are implementing advanced biomimetic cooling systems to meet strict operational and performance requirements. Investments in industrial automation prioritize high-efficiency equipment capable of maintaining energy optimization while complying with rigorous German quality standards. Training and certification programs are enhancing technical expertise among operators, supporting specialized thermal management across diverse industrial applications.
Revenue from bionic fans in Brazil is projected to grow at a CAGR of 7.8%, driven by industrial facility expansion and modernization initiatives. Manufacturing and processing plants are increasingly integrating advanced thermal management equipment to meet operational and energy efficiency requirements. Professional development programs are improving technical capabilities, ensuring effective utilization of bionic fan technology across industrial sectors. Adoption of energy-efficient solutions enhances operational performance, reduces costs, and supports sustainability objectives in industrial operations.
Bionic fan demand in the USA is projected to grow at a CAGR of 7.0%, supported by established industrial infrastructure and energy efficiency initiatives. Large-scale manufacturing and industrial facilities are adopting advanced biomimetic cooling solutions to address complex thermal management needs. Professional training and certification programs ensure operator expertise in installation, operation, and maintenance, supporting consistent performance across diverse facility types. Continuous innovation and technology adoption in manufacturing operations enhance equipment efficiency, reliability, and operational sustainability.
The UK market is projected to grow at a CAGR of 6.3%, driven by energy-efficient cooling adoption and industrial modernization. Manufacturing operators are deploying biomimetic fan systems to maintain operational standards and regulatory compliance while enhancing energy efficiency. Industrial infrastructure investments and professional training programs are supporting facility operators in adopting advanced thermal management solutions. Advanced cooling technologies are becoming central to industrial performance and operational efficiency across diverse sectors.
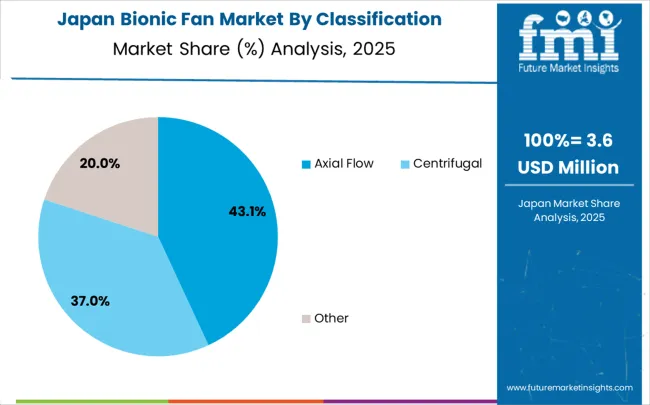
Bionic fan revenue in Japan is projected to grow at a CAGR of 5.6%, fueled by technological innovation and precision-focused industrial applications. Advanced biomimetic fan systems are being integrated with automated workflows to achieve operational reliability and enhanced performance. Investments in precision engineering and thermal management solutions are ensuring compliance with Japanese quality standards. Professional development programs strengthen operator expertise, enabling effective deployment of advanced cooling technologies in high-precision industrial environments.
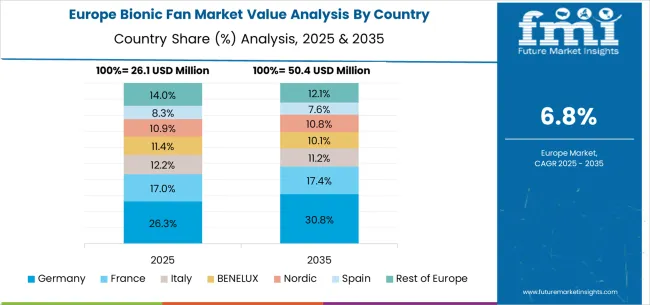
The bionic fan market in Europe is forecast to expand from USD 31.2 million in 2025 to USD 63.8 million by 2035, registering a CAGR of 7.4%. Germany will remain the largest market, holding 27.2% share in 2025, easing to 26.8% by 2035, supported by strong industrial automation and advanced thermal management systems. The United Kingdom follows, rising from 20.5% in 2025 to 21.0% by 2035, driven by manufacturing facilities and energy efficiency initiatives. France is expected to decline slightly from 16.0% to 15.6%, reflecting regulatory compliance pressures. Italy maintains stability at around 13.0%, supported by industrial facilities and processing plants, while Spain grows from 11.5% to 12.0% with expanding manufacturing and automation demand. BENELUX markets ease from 6.5% to 6.4%, while the remainder of Europe hovers near 5.3%--5.2%, balancing emerging Eastern European growth against mature Nordic markets.
Companies are investing in advanced biomimetic design development, aerodynamic performance optimization, smart control system improvements, and comprehensive service capabilities to deliver reliable, efficient, and cost-effective thermal management solutions. Strategic partnerships, technological innovation, and market expansion are central to strengthening product portfolios and market presence.
Ziehl-Abegg offers comprehensive bionic fan solutions with established manufacturing expertise and professional-grade cooling equipment capabilities. MAHLE provides specialized thermal management equipment with focus on energy efficiency and operational reliability. Delta Electronics delivers advanced cooling solutions with emphasis on smart controls and system integration. EBM-Papst specializes in industrial cooling equipment with advanced biomimetic technology integration.
Nidec Corporation offers professional-grade fan equipment with comprehensive performance optimization capabilities. Sanyo Denki delivers established industrial cooling solutions with advanced control technologies. Oriental Motor provides specialized thermal management equipment with focus on precision control optimization. Sunon, NMB Technologies, Commonwealth Industrial Corp, and ADDA Corporation offer specialized manufacturing expertise, equipment reliability, and comprehensive product development across global and regional market segments.
| Item | Value |
|---|---|
| Quantitative Units | USD 115 million |
| Fan Type | Axial Flow, Centrifugal, Others |
| Application | Industrial, Household, Medical, Others |
| Regions Covered | North America, Europe, East Asia, South Asia & Pacific, Latin America, Middle East & Africa |
| Country Covered | China, India, Germany, Brazil, United States, United Kingdom, Japan, and 40+ countries |
| Key Companies Profiled | Ziehl-Abegg, MAHLE, Delta Electronics, EBM-Papst, Nidec Corporation, Sanyo Denki, Oriental Motor, Sunon, NMB Technologies, Commonwealth Industrial Corp, ADDA Corporation, SEPA, ADDA Corporation, Mechatronics Fan Group |
| Additional Attributes | Dollar sales by fan type and application segment, regional demand trends across major markets, competitive landscape with established cooling equipment manufacturers and emerging biomimetic technology providers, customer preferences for different fan designs and efficiency options, integration with industrial automation systems and thermal management protocols, innovations in biomimetic design efficiency and smart control technologies, and adoption of energy optimization features with enhanced performance capabilities for improved operational workflows. |
The global bionic fan market is estimated to be valued at USD 115.0 million in 2025.
The market size for the bionic fan market is projected to reach USD 234.7 million by 2035.
The bionic fan market is expected to grow at a 7.4% CAGR between 2025 and 2035.
The key product types in bionic fan market are axial flow , centrifugal and other.
In terms of application, industrial segment to command 58.0% share in the bionic fan market in 2025.


Our Research Products

The "Full Research Suite" delivers actionable market intel, deep dives on markets or technologies, so clients act faster, cut risk, and unlock growth.

The Leaderboard benchmarks and ranks top vendors, classifying them as Established Leaders, Leading Challengers, or Disruptors & Challengers.

Locates where complements amplify value and substitutes erode it, forecasting net impact by horizon

We deliver granular, decision-grade intel: market sizing, 5-year forecasts, pricing, adoption, usage, revenue, and operational KPIs—plus competitor tracking, regulation, and value chains—across 60 countries broadly.

Spot the shifts before they hit your P&L. We track inflection points, adoption curves, pricing moves, and ecosystem plays to show where demand is heading, why it is changing, and what to do next across high-growth markets and disruptive tech

Real-time reads of user behavior. We track shifting priorities, perceptions of today’s and next-gen services, and provider experience, then pace how fast tech moves from trial to adoption, blending buyer, consumer, and channel inputs with social signals (#WhySwitch, #UX).

Partner with our analyst team to build a custom report designed around your business priorities. From analysing market trends to assessing competitors or crafting bespoke datasets, we tailor insights to your needs.
Supplier Intelligence
Discovery & Profiling
Capacity & Footprint
Performance & Risk
Compliance & Governance
Commercial Readiness
Who Supplies Whom
Scorecards & Shortlists
Playbooks & Docs
Category Intelligence
Definition & Scope
Demand & Use Cases
Cost Drivers
Market Structure
Supply Chain Map
Trade & Policy
Operating Norms
Deliverables
Buyer Intelligence
Account Basics
Spend & Scope
Procurement Model
Vendor Requirements
Terms & Policies
Entry Strategy
Pain Points & Triggers
Outputs
Pricing Analysis
Benchmarks
Trends
Should-Cost
Indexation
Landed Cost
Commercial Terms
Deliverables
Brand Analysis
Positioning & Value Prop
Share & Presence
Customer Evidence
Go-to-Market
Digital & Reputation
Compliance & Trust
KPIs & Gaps
Outputs
Full Research Suite comprises of:
Market outlook & trends analysis
Interviews & case studies
Strategic recommendations
Vendor profiles & capabilities analysis
5-year forecasts
8 regions and 60+ country-level data splits
Market segment data splits
12 months of continuous data updates
DELIVERED AS:
PDF EXCEL ONLINE
Bionic Glove's Market Size and Share Forecast Outlook 2025 to 2035
Bionic Eye Market Growth & Demand 2025 to 2035
Bionic Ears Market
The Medical Bionic Implant and Exoskeleton Market is segmented by Bionic Forelimbs/Hand Bionics, and Bionic Legs/Lower Limbs from 2025 to 2035
Medical Bionic Implant & Artificial Organs Market Growth – Trends & Forecast 2025 to 2035
Fanfold Market Size and Share Forecast Outlook 2025 to 2035
Fan-Out Wafer Level Packaging Market Size and Share Forecast Outlook 2025 to 2035
Fan Engagement Market Insights – Trends & Growth 2025 to 2035
Infant Positioning Aids Market Size and Share Forecast Outlook 2025 to 2035
Infant Incubators & Warmers Market Size and Share Forecast Outlook 2025 to 2035
Infant Nutrition Hydrolysate Ingredients Market Size and Share Forecast Outlook 2025 to 2035
Infant Formula DHA Algae Oil Market Size and Share Forecast Outlook 2025 to 2035
Infant Fever Stickers Market Size and Share Forecast Outlook 2025 to 2035
Infant Nutritional Premix Market Size and Share Forecast Outlook 2025 to 2035
Infant Incubators Market Analysis - Trends & Forecast 2025 to 2035
Infant Formula Industry Analysis in United States Analysis - Size, Share, and Forecast Outlook 2025 to 2035
Infant Formula Market Analysis - Size, Share, and Forecast Outlook 2025 to 2035
Infant Formula Ingredients Market Analysis - Size, Share & Forecast 2025 to 2035
Infant Care Equipment Market Growth - Trends & Forecast 2025 to 2035
Marfan Syndrome Management Market Size and Share Forecast Outlook 2025 to 2035

Thank you!
You will receive an email from our Business Development Manager. Please be sure to check your SPAM/JUNK folder too.
Chat With
MaRIA