
- Market Size (2026)
- USD 157.3 Mn
- Forecast (2036)
- USD 279.1 Mn
- CAGR (2026 to 2036)
- 5.9%
How Big Is the Blue Tea Market in 2026?
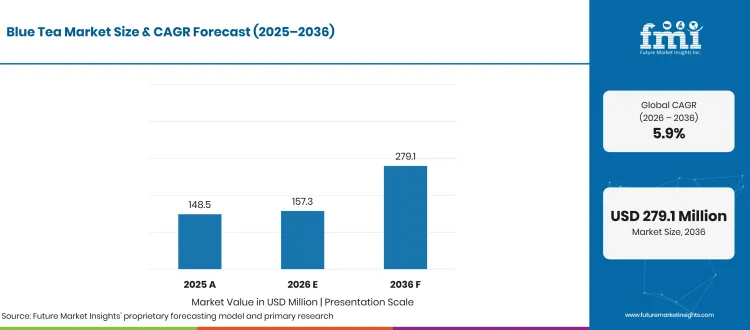
Tracking from USD 148.5 million in 2025 to USD 157.3 million in 2026, the global blue tea market valuation is projected by Future Market Insights (FMI) to hit USD 279.1 million by 2036, accompanied by a 5.9% CAGR and generating USD 121.8 million in incremental revenue over the forecast period.
| Market Metric | Valuation / Share / Forecast Benchmark |
|---|---|
| 2025 Market Size (Historical) | USD 148.5 million |
| 2026 Market Size (Estimated) | USD 157.3 million |
| 2036 Market Size (Projected) | USD 279.1 million |
| Compound Annual Growth Rate (2026 to 2036) | 5.9% CAGR |
| Incremental Dollar Opportunity (2026 to 2036) | USD 121.8 million |
| Dominant Product Segment (2026 Share) | Loose Leaves (49.0% in 2026; Other Segment Combined 51.0%) |
| Dominant Type Segment (2026 Share) | Conventional (63.0% in 2026; Other Segment Combined 37.0%) |
| Dominant Distribution Channel (2026 Share) | Off-trade (63.0% in 2026; Other Segment Combined 37.0%) |
| Largest Country Markets (2026 Valuation) | USA (USD 34.6 million), India (USD 25.2 million), China (USD 18.9 million) |
| Fastest-Growing Country Markets (2026 to 2036) | India (8.8% CAGR), Japan (7.4% CAGR), UK (6.9% CAGR) |
| Leading Tier-1 Companies | Blue Tea (Redplum Private Limited), Rishi Tea & Botanicals, Harney & Sons Fine Teas, Revival Tea Company |
Source: Future Market Insights analysis of the blue tea market, 2026.
This Report Answers
- How large the blue tea market is in 2026 and what it reaches by 2036
- Which product, type and distribution channel segments lead in 2026
- What is driving demand and what is holding the category back
- Which countries grow fastest between 2026 and 2036
- What Blue Tea (Redplum Private Limited) and other leading players have launched
- How the blue tea market is defined, segmented and measured
Executive Market Overview
Craft beverage cafes and ready-to-drink beverage innovators are using dried butterfly pea (Clitoria ternatea) flowers to engineer natural, pH-sensitive blue-to-purple color shifts that eliminate synthetic dyes on ingredient decks. Clitoria ternatea) flowers and blended botanical infusions that brew a cobalt-blue cup and shift to violet when citrus juice is added. FMI survey reflects that specialty tea merchants and cafe suppliers use this visible pH-driven color transition to attract caffeine-free herbal tea buyers without relying on unverified clinical claims. Peer-reviewed food-application research published by the National Center for Biotechnology Information (October 2025) confirms that polyacylated ternatin anthocyanins in Clitoria ternatea petals provide high thermal stability during hot steeping and cold-brew extraction. In May 2025, the U.S. Food and Drug Administration (May 2025) updated regulatory color-additive status documentation for butterfly pea flower extract, reinforcing buyer focus on clear ingredient differentiation between whole-flower infusions and extracted colorants.
Jurisdiction-specific novel-food rules and traditional brewing habits create distinct commercialization gates across Europe and East Asia. FMI believes suppliers that pair whole-petal grade control with spiced chai or citrus-herbal blends using natural flavours and organic tea formats achieve stronger repeat household replenishment. In February 2026, the European Commission (February 2026) terminated a novel-food authorization procedure for dried Clitoria ternatea L. flowers (`NF/2023/20953`) without updating the Union list, requiring European importers to verify local ingredient eligibility before listing products. Market sizing covers dried butterfly pea flower infusions sold as loose leaves and powders across off-trade and on-trade channels, while excluding ready-to-drink bottled beverages, liquid food colorants, and cafe counter drink receipts.
Analyst Perspective
"Visual color-changing appeal wins initial consumer trial in blue tea, but repeat retail orders depend on pairing earthy butterfly pea petals with balanced botanical blends and passing strict novel-food and microbiological checks. Unresolved European Union novel-food authorization remains the sharpest regulatory barrier for exporters."
- Nandini Roy Choudhury, Principal Consultant, Future Market Insights (FMI)
Key Market Trends & Insights
- Spiced Chai and Botanical Blend Formulations Lift Repeat Purchases:Because pure butterfly pea petals brew a mild, woody infusion, specialty tea brands are blending the flower with lemongrass and ginger cup flavor and repeat purchase rates. FMI finds that multi-ingredient blends command broader retail distribution owing to familiar taste profiles. Trademark filings recorded by Justia Trademarks (February 2025) and TrademarkElite (February 2026) document Noble Roots Urban Garden LLC's protection of the Herbs & Kettles mark for Lavish Blue Tea and Blue Chai Boba kits.
- Dual-Format Whole Flower and Instant Powder Catalogs for Beverage Prep:Ingredient wholesalers and specialty tea houses are supplying both intact dried flowers for pyramid sachets and fine-milled butterfly pea powders for iced latte and limeade preparation. FMI observes that offering both physical formats allows merchants to serve home steeping and foodservice baristas attributed to faster cold-water dispersion. In February 2025, Yamashin Sangyo Co., Ltd. (February 2025) listed both whole butterfly pea flowers and fine powder in its Japanese commercial catalog, while Rishi Tea & Botanicals (June 2026) markets organic loose flowers and Butterfly Pea Limeade Powder.
- Heightened European Union Novel-Food and Border Surveillance:European food safety authorities have intensified border and market surveillance on unapproved Clitoria ternatea herbal infusions. Notifications logged in the European Commission Rapid Alert System for Food and Feed (May 2025) under reference `2025.3660` flagged Clitoria ternatea for infusion in France in May 2025, followed by the European Commission (February 2026) decision terminating application `NF/2023/20953` on 12 February 2026, forcing suppliers to prioritize compliant North American and Asian channels.
What Are the Main Drivers, Restraints, and Opportunities?
Natural pH-responsive anthocyanin color and caffeine-free positioning drive consumer trial across online and specialty tea channels, whereas European novel-food restrictions and dried-herb microbiological controls restrain market access, leaving flavored pyramid tea bags and certified organic loose petals as key growth opportunities.
Driver: Natural pH-Responsive Color Differentiation and Caffeine-Free Positioning
Retailers and specialty tea brands promote butterfly pea flower infusions because the natural blue-to-purple color shift upon adding lemon juice creates immediate visual engagement on digital storefronts. FMI believes demand is expanding driven by younger buyers seeking caffeine-free evening infusions with fruit tea and kombucha. Biochemical studies published by the National Center for Biotechnology Information (October 2025) and National Center for Biotechnology Information (November 2025) confirm that ternatin anthocyanins and quercetin glycosides in Clitoria ternatea flowers deliver stable natural pigmentation across hot and iced beverage applications.
Restraint: Novel-Food Authorization Barriers and Microbiological Safety Controls
Regulatory classification of driedClitoria ternatea flowers as an unauthorized novel food in the European Union restricts mainstream grocery listings across European member states. On 12 February 2026, the European Commission (February 2026) terminated the authorization procedure for dried flowers of Clitoria ternatea L. (`NF/2023/20953`) without updating the Union novel-food list, following earlier border alerts under the European Commission Rapid Alert System for Food and Feed (May 2025). Exporters supplying botanical ingredients must also maintain strict pathogen testing under Canadian Food Inspection Agency (May 2025) dried-tea microbiological standards.
Opportunity: Pyramid Sachet Formats and Cross-Border Direct-to-Consumer Brand Scaling
Standardizing whole-flower grades in biodegradable pyramid tea bags and resealable pouches allows origin brands in India and Southeast Asia to capture higher retail margins in North America and the Middle East. FMI expects suppliers combining butterfly pea petals with clean label ingredients and tea packaging innovations to accelerate repeat household orders on account of convenient single-cup dosing. Official records from the United States Patent and Trademark Office (July 2025) confirm Redplum Private Limited's U.S. trademark registration (`7234141`) for BLUE TEA covering butterfly pea flower herbal tea.
How Is the Blue Tea Market Segmented?
Blue Tea Market is segmented by Product and Type. Forecast period from 2026 to 2036.
| Segmentation Axis | Sub-Segments Covered | 2026 Leading Segment & Share | Remainder & Total Alignment |
|---|---|---|---|
| Product | Loose Leaves, Powder, Others | Loose Leaves (49.0%) | Other Segment Combined (51.0%) | Total (100.0%) |
| Type | Conventional, Organic | Conventional (63.0%) | Other Segment Combined (37.0%) | Total (100.0%) |
| Distribution Channel | Off-trade, On-trade | Off-trade (63.0%) | Other Segment Combined (37.0%) | Total (100.0%) |
| Region | North America, Latin America, Western Europe, Eastern Europe, East Asia, South Asia and Pacific, Middle East and Africa | North America & South Asia | India leads national growth pace at 8.8% CAGR (2026 to 2036) |
Source: Future Market Insights analysis of the blue tea market, 2026.
Why Does the Loose Leaves Segment Lead by Product?
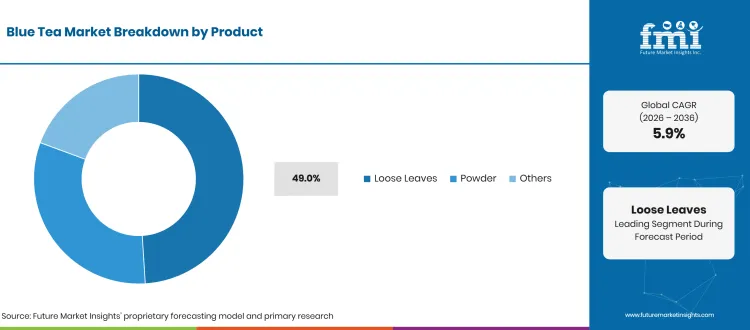
Loose Leaves account for 49.0% of Product revenue in 2026, leading global sales as tea drinkers and specialty blenders prefer whole dried blossoms for custom steeping and natural blue color extraction. Sun-dried and tray-dehydrated whole flowers retain higher anthocyanin pigment integrity than coarsely ground dust, differentiating whole-petal pouches from bulk asean superfood powder ingredients. Commercial catalogs from Yamashin Sangyo Co., Ltd. (February 2025), Rishi Tea & Botanicals (June 2026), and Lake Missoula Tea Company (June 2026) feature whole dried Clitoria ternatea blossoms as their flagship infusion format. In FMI's view, visual petal verification and customizable home steeping will keep Loose Leaves as the top revenue generator through 2036.
Why Does the Conventional Segment Lead by Type?
Conventional varieties secure a leading 63.0% share of Type revenue in 2026, as smallholder flower harvesting networks across Southeast Asia allow processors to keep retail packaging affordable for mainstream grocery shoppers. Conventional sourcing allows tea blenders to price butterfly pea infusions competitively against mainstream natural tea extract and herbal tisanes in grocery and online channels. Industry reporting from the German Tea & Herbal Infusions Association (June 2025) confirms that while organic herbal tea share is rising in Europe, conventional botanical blends still represent the majority of total infusion volume. FMI expects accessible retail pricing to preserve segment leadership through 2036.
Why Does the Off-trade Segment Lead by Distribution Channel?
Off-trade channels anchor 63.0% of category sales in 2026, maintaining retail dominance as recipe-led digital marketing and viral social media beverage tutorials drive strong home iced-tea preparation. Shoppers purchase resealable 50-gram flower packs and 20-to-100-count teabag boxes online to prepare color-changing drinks at home with flavonoids and wellness tisanes. Active retail listings from Blue Tea (June 2026)Revival Tea Company (June 2026)Sancha Tea (June 2026) demonstrate broad off-trade availability across stand-up pouches and sachets. FMI projects that subscription e-commerce and specialty retail will maintain leadership through 2036.
Regional & Country Outlook
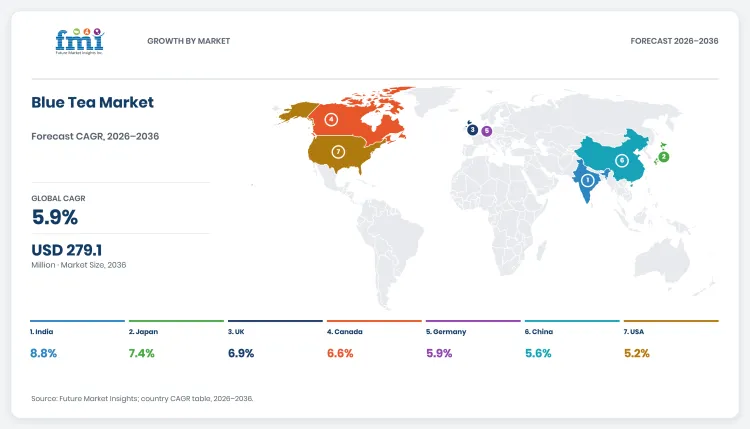
North America and South Asia generate the bulk of global blue tea sales, while Western Europe grows from a smaller base as suppliers navigate novel-food compliance. FMI projects the seven profiled countries below to represent74.0% of global valuation in 2026 (USD 116.4 million), advancing to USD 212.1 million by 2036. While the USA remains the largest individual market in 2026 at USD 34.6 million (22.0% global share), India records the fastest national growth pace at an 8.8% CAGR from USD 25.2 million in 2026 to USD 58.6 million by 2036, overtaking the USA in absolute dollar addition (+USD 33.4 million) as domestic direct-to-consumer brands scale with botanical extracts and herbal wellness infusions.
| Country | 2026 Revenue | 2036 Revenue | 10-Year Addition | 2026 to 2036 CAGR | Global Share (2026 -> 2036) |
|---|---|---|---|---|---|
| India | USD 25.2 million | USD 58.6 million | +USD 33.4 million | 8.8% | 16.0% -> 21.0% |
| Japan | USD 14.2 million | USD 29.0 million | +USD 14.8 million | 7.4% | 9.0% -> 10.4% |
| UK | USD 11.0 million | USD 21.4 million | +USD 10.4 million | 6.9% | 7.0% -> 7.7% |
| Canada | USD 7.9 million | USD 15.0 million | +USD 7.1 million | 6.6% | 5.0% -> 5.4% |
| Germany | USD 12.6 million | USD 22.4 million | +USD 9.8 million | 5.9% | 8.0% -> 8.0% |
| China | USD 18.9 million | USD 32.6 million | +USD 13.7 million | 5.6% | 12.0% -> 11.7% |
| USA | USD 34.6 million | USD 57.4 million | +USD 22.8 million | 5.2% | 22.0% -> 20.6% |
Source: Future Market Insights analysis of the blue tea market, 2026.
USA
Demand for blue tea in USA is projected to rise from USD 34.6 million in 2026 to USD 57.4 million by 2036, advancing at a 5.2% CAGR and adding USD 22.8 million in new revenue. FMI finds that American specialty tea retailers and foodservice beverage programs procure whole butterfly pea blossoms and flavored blue blends anchored by iced-tea and botanical lemonade demand. Regulatory documentation from the U.S. Food and Drug Administration (May 2025) clarifies the separate color-additive status of butterfly pea flower extract, while domestic brands including Rishi Tea & Botanicals (June 2026) and Harney & Sons Fine Teas (June 2026) distribute loose petals nationwide. FMI expects cold-brew sachet and limeade powder formats to sustain U.S. retail orders through 2036.
India
Buyer adoption of blue tea across India is estimated to expand from USD 25.2 million in 2026 to USD 58.6 million by 2036, spurred by a 8.8% CAGR and generating USD 33.4 million in commercial expansion. In FMI's view, domestic growth is fueled by vertically integrated Indian farm-to-cup brands selling sun-dried butterfly pea flowers and spiced blue chai sachets across quick-commerce apps and direct websites. Intellectual property records from the United States Patent and Trademark Office (July 2025) confirm India-based Redplum Private Limited's registered BLUE TEA mark, while Blue Tea (June 2026) and VAHDAM India (June 2026) market loose petals and pyramid bags globally. FMI projects that domestic wellness gifting and quick-commerce replenishment will propel India past the USA in total blue tea revenue by 2036.
Japan
Blue tea industry in Japan is set to scale from USD 14.2 million in 2026 to USD 29.0 million by 2036, driven by a 7.4% CAGR and adding USD 14.8 million in incremental market value. FMI observes that Japanese specialty beverage formulators and cafes procure both whole dried blossoms for transparent glass steeping and fine butterfly pea powder for seasonal confectionery and ready to drink rtd tea bases. Commercial product specifications published by Yamashin Sangyo Co., Ltd. (February 2025) document standardized whole butterfly pea flower and powder grades tailored to Japanese herbal tea and food processors. FMI expects cafe menu collaborations and portioned retail sachets to drive steady Japanese sales expansion through 2036.
UK
Sales of blue tea throughout UK are projected to increase from USD 11.0 million in 2026 to USD 21.4 million by 2036, progressing at a 6.9% CAGR and creating USD 10.4 million in additional revenue. FMI believes converting British shoppers from trial to repeat purchase requires pairing butterfly pea petals with familiar citrus or berry flavors in convenient tea bags due to entrenched national preference for traditional black tea. Survey data released by the UK Tea & Infusions Association (May 2025) shows that 7 in 10 surveyed British adults still prefer traditional black tea, while suppliers must also verify compliance with UK Food Standards Agency (May 2025) novel-food guidance. In FMI's view, flavored pyramid sachets with clear brewing instructions will expand UK specialty retail adoption through 2036.
Canada
Consumption of blue tea across Canada is estimated to climb from USD 7.9 million in 2026 to USD 15.0 million by 2036, reflecting a 6.6% CAGR and contributing USD 7.1 million over the forecast decade. FMI's analysis indicates that Canadian demand is attributed to rising household expenditure on caffeine-free fruit and herbal infusions across specialty grocers and online tea boutiques. Market analysis published by Agriculture and Agri-Food Canada (October 2025) documents steady expansion in Canadian caffeine-free hot and cold herbal drink sales, while importers must satisfy Canadian Food Inspection Agency (May 2025) pathogen surveillance standards for dried teas. FMI anticipates certified organic loose-leaf and limeade powder packs from cross-border suppliers to lift Canadian sales through 2036.
Germany
Revenue generated by blue tea suppliers in Germany is forecast to expand from USD 12.6 million in 2026 to USD 22.4 million by 2036, anchored by a 5.9% CAGR and generating USD 9.8 million in new category sales. FMI notes that Germany has Europe's largest herbal and fruit infusion consumption culture, yet commercial scaling of Clitoria ternatea requires strict regulatory diligence on account of European Union novel-food enforcement. Industry figures from the German Tea & Herbal Infusions Association (June 2025) confirm that German consumers drank nearly 47 billion cups of tea and herbal infusions in 2024, while the European Commission (February 2026) decision on `NF/2023/20953` governs EU novel-food status. FMI projects that compliant botanical blends will capture growing German specialty tea demand through 2036.
China
Buyer procurement of blue tea throughout China is tracking from USD 18.9 million in 2026 to USD 32.6 million by 2036, exhibiting a 5.6% CAGR and contributing USD 13.7 million to national market value. FMI finds that e-commerce tea merchants and modern tea-drink studios in southern China use dried butterfly pea petals for layered iced infusions, although foodservice operators must navigate provincial food-safety guidance as a result of unstandardized national raw-material filings. Scientific evaluations indexed by the National Center for Biotechnology Information (November 2025) highlight growing Asian research into butterfly pea anthocyanin stability and packaging applications, supporting quality standardization among regional botanical processors. FMI expects clear botanical grading and cautious non-clinical labeling to support steady Chinese e-commerce growth through 2036.
Competitive Environment and Notable Companies
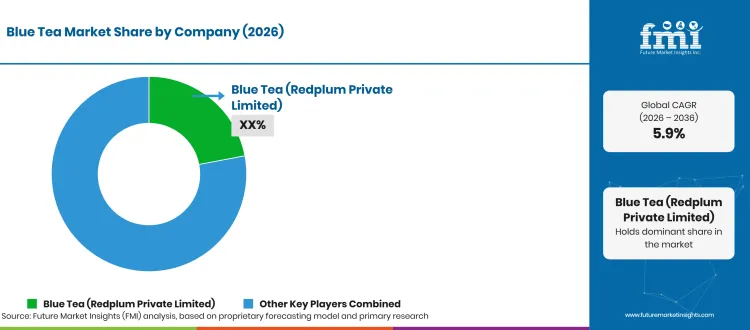
Notable companies operating in the global blue tea market include Blue Tea (Redplum Private Limited), Rishi Tea & Botanicals, Harney & Sons Fine Teas, VAHDAM India, Yamashin Sangyo Co., Ltd., Revival Tea Company, Lake Missoula Tea Company, Tucson Tea Company, Noble Roots Urban Garden LLC (Herbs & Kettles), and Sancha Tea. Competition is structured between origin-integrated Indian and Japanese suppliers that process whole driedClitoria ternatea flowers and powders at scale, and North American specialty tea brands that formulate flavored blue tea sachets and chai kits.
How Are Companies Positioned in the Blue Tea Market?
Origin-anchored brands includingBlue Tea (June 2026), VAHDAM India (June 2026), and Sancha Tea (June 2026) market sun-dried Indian butterfly pea flowers in loose pouches and pyramid tea bags. In North America, Rishi Tea & Botanicals (June 2026), Harney & Sons Fine Teas (June 2026), Lake Missoula Tea Company (June 2026), and Tucson Tea Company (June 2026) supply pure blossoms and botanical blends across retail and wholesale cafe accounts.
What Matters When a Buyer Selects a Blue Tea Supplier?
Wholesale and retail buyers evaluate suppliers on whole-petal percentage, moisture content (<10%), anthocyanin color intensity per gram, and verified microbiological and pesticide-residue certificates. Importers operating in Europe and Canada also verify novel-food compliance underEuropean Commission (February 2026) decisions and pathogen testing aligned with Canadian Food Inspection Agency (May 2025) surveys.
Which Capabilities Distinguish Product Offers?
Suppliers differentiate through multi-format processing and flavor pairing. Yamashin Sangyo Co., Ltd. (February 2025) supplies both whole dried blossoms and fine-mesh butterfly pea powder for Japanese beverage and food manufacturers; Rishi Tea & Botanicals (June 2026) pairs organic loose flowers with a ready-to-mix Butterfly Pea Limeade Powder; and Herbs & Kettles / Noble Roots Urban Garden LLC (June 2026) formulates Lavish Blue Tea and Blue Chai Boba kits.
How Does Geographic Reach Affect Competition?
Indian exporters such asBlue Tea (June 2026) and VAHDAM India (June 2026) ship directly to U.S. and global consumers via cross-border e-commerce while expanding domestic retail presence, whereas Revival Tea Company (June 2026) and The Hale Tea Company (June 2026) focus on North American cafe wholesale and specialty grocery accounts.
| Verified Company Evidence (2025 to 2026) | Commercial Effect | Buyer Action |
|---|---|---|
| February 2025: Yamashin Sangyo Co., Ltd. released its 2025 commercial catalog featuring standardized butterfly pea whole flower and fine powder lines in Japan (Yamashin Sangyo Co., Ltd., February 2025). | Establishes dual-format B2B supply covering both whole-flower herbal steeping and instant powder beverage formulation. | Source matched whole-flower and powder grades from a single audited supplier to standardize cafe and retail SKUs. |
| July 2025: USPTO office action records documented Redplum Private Limited's U.S. trademark registration (7234141) for BLUE TEA covering butterfly pea flower tea (United States Patent and Trademark Office, July 2025). | Reinforces cross-border brand protection for India-grown direct-to-consumer butterfly pea flower infusions in the U.S. market. | Verify trademark ownership and origin traceability when listing imported direct-to-consumer flower tea brands. |
| February 2026: Noble Roots Urban Garden LLC secured registration record 8148429 for the Herbs & Kettles with Love, Your Chaiwala mark covering blue tea and chai blends (TrademarkElite, February 2026). | Supports branded retail and online expansion of spiced Lavish Blue Tea and Blue Chai Boba kits in the United States. | Pair standalone butterfly pea flowers with spiced chai and citrus blends to lift repeat customer orders. |
Source: Verified corporate disclosures and Future Market Insights analysis, 2026.
| Company | Core Positioning | Verified Activity & Source Attribution |
|---|---|---|
| Blue Tea (Redplum Private Limited) | India-based farm-to-cup butterfly pea flower herbal tea and pyramid teabag brand | Markets 50 g loose butterfly pea flower packs and teabags backed by U.S. trademark registration 7234141 cited in July 2025 (Blue Tea, June 2026; United States Patent and Trademark Office, July 2025). |
| Rishi Tea & Botanicals | United States organic loose-leaf butterfly pea flower and functional botanical powder supplier | Offers USDA organic loose-leaf Butterfly Pea Flower Herbal Tea and Butterfly Pea Limeade Powder across U.S. and Canadian channels (Rishi Tea & Botanicals, June 2026). |
| Harney & Sons Fine Teas | United States specialty loose-leaf and sachet herbal infusion brand | Supplies loose-leaf Butterfly Pea Flower herbal tisane across North American retail, hospitality, and online channels (Harney & Sons Fine Teas, June 2026). |
| VAHDAM India | Global direct-to-consumer Indian wellness tea and loose-leaf butterfly pea flower exporter | Markets 1.76 oz (50 g) loose-leaf Butterfly Pea Flower Tea Herbal Tisane to U.S. and international buyers (VAHDAM India, June 2026). |
| Yamashin Sangyo Co., Ltd. | Japanese botanical ingredient wholesaler supplying butterfly pea whole flowers and powders | Published 2025 commercial specifications for whole butterfly pea blossoms and powder for tea and food applications (Yamashin Sangyo Co., Ltd., February 2025). |
| Revival Tea Company | United States specialty tea company offering spiced blue tea blends in loose and sachet formats | Supplies blended Blue Tea and standalone Butterfly Pea Flower across retail and wholesale cafe accounts (Revival Tea Company, June 2026). |
| Noble Roots Urban Garden LLC (Herbs & Kettles) | United States boutique tea brand specializing in Lavish Blue Tea and Blue Chai Boba kits | Filed U.S. trademark application in February 2025 and recorded registration 8148429 in February 2026 for Herbs & Kettles (Justia Trademarks, February 2025; TrademarkElite, February 2026). |
| Lake Missoula Tea Company | United States specialty tea merchant offering organic standalone butterfly pea flowers and Bodacious Blue Tea | Lists certified organic whole butterfly pea flowers and multi-herb blue blends for online and retail buyers (Lake Missoula Tea Company, June 2026). |
| Tucson Tea Company | United States retailer of pure butterfly pea flower herbal tea petals | Supplies standalone dried butterfly pea flowers for hot and iced color-changing infusions (Tucson Tea Company, June 2026). |
| Sancha Tea | Indian gourmet tea boutique operator and e-commerce supplier of butterfly pea infusions | Markets caffeine-free Butterfly Pea Flower Herbal Infusion across Indian boutiques and online channels (Sancha Tea, June 2026). |
Source: Verified corporate disclosures and Future Market Insights analysis, 2026.
Key takeaways
- Valued at USD 157.3 million in 2026, on course for USD 279.1 million by 2036.
- The decade adds USD 121.8 million in new value at a 5.9% CAGR.
- The product segment is led by Loose Leaves at 49.0% of 2026 revenue.
- 63.0% of type revenue goes to Conventional in 2026.
- India grows fastest at 8.8% CAGR, ahead of Japan at 7.4%.
Blue Tea Market - Report Scope and Research Methodology
FMI sizes the global blue tea market using a bottom-up and top-down methodology that reconciles driedClitoria ternatea flower harvest volumes sold for beverage infusion with retail pouch and pyramid sachet revenues across each tracked country. Primary interviews with botanical tea exporters, specialty tea blenders, and regulatory compliance consultants establish segment splits across Product and Type axes. Desk research cross-checks novel-food regulatory decisions, national tea association consumption reports and and trademark to validate 2025 and 2026 revenues. Ready-to-drink bottled beverages or liquid food colorants, and cafe counter drink sales are excluded to prevent double counting.
| Coverage Field | Report Scope |
|---|---|
| Market Definition | Revenue from dried butterfly pea flower (Clitoria ternatea) infusions and identifiable blue-flower botanical blends sold as Loose Leaves, Powder, or Others. |
| Product Segmentation | Loose Leaves (49.0% in 2026); Other Segment Combined (51.0%: Powder, Others including pyramid tea bags) | Total (100.0%). |
| Type Segmentation | Conventional (63.0% in 2026); Other Segment Combined (37.0%: Organic) | Total (100.0%). |
| Distribution Channel Segmentation | Off-trade (63.0% in 2026: retail stores and e-commerce); Other Segment Combined (37.0%: On-trade wholesale inputs) | Total (100.0%). |
| Regions Covered | North America, Latin America, Western Europe, Eastern Europe, East Asia, South Asia and Pacific, Middle East and Africa. |
| Countries Profiled | India, Japan, UK, Canada, Germany, China, USA. |
| Exclusions | Ready-to-drink (RTD) bottled beverages, prepared cafe cup revenue, concentrated liquid color additives, and non-blue herbal teas. |
| Quantitative Units | USD million (uniform unit lock across global and national valuations). |
| Historical & Base Years | 2025 (USD 148.5 million historical); 2026 (USD 157.3 million estimated). |
| Forecast Period & 2036 Projection | 2026 to 2036 (USD 279.1 million projected by 2036; 5.9% CAGR; +USD 121.8 million incremental addition). |
| Companies Profiled | Blue Tea (Redplum Private Limited), Rishi Tea & Botanicals, Harney & Sons Fine Teas, VAHDAM India, Yamashin Sangyo Co., Ltd., Revival Tea Company, Noble Roots Urban Garden LLC, Lake Missoula Tea Company, Tucson Tea Company, Sancha Tea. |
| Research Approach | Primary botanical processor and specialty retailer interviews, regulatory docket verification, trade association data, and market triangulation. |
Source: Future Market Insights analysis of the blue tea market, 2026.
Research Sources and Bibliography
- Agriculture and Agri-Food Canada. (2025, October 29).Customized Report Service: Coffee and tea (caffeine free) hot/cold drinks in Canada. https://agriculture.canada.ca/en/international-trade/reports-and-guides/customized-report-service-coffee-and-tea-caffeine-free-hotcold-drinks-canada
- Blue Tea. (2026, June 10).Butterfly Pea Flower Herbal Tea 50g Product Specification. https://bluetea.co.in/products/butterfly-pea-flower-tea-50g
- Canadian Food Inspection Agency. (2025, May 15).Bacterial Pathogens in Dried Herbs and Dried Teas: Targeted Microbiological Surveys. https://inspection.canada.ca/en/food-safety-industry/food-chemistry-and-microbiology/food-safety-testing-reports-and-journal-articles/bacterial-pathogens-dried-herbs-and-teas
- European Commission. (2026, February 12).Commission Implementing Decision Terminating the Procedure for Dried Flowers of Clitoria ternatea L. (NF/2023/20953). https://food.ec.europa.eu/food-safety/novel-food/decisions-terminating-procedure_en
- European Commission Rapid Alert System for Food and Feed. (2025, May 26).RASFF Notification 2025.3660: Clitoria ternatea for Infusion. https://webgate.ec.europa.eu/rasff-window/screen/notification/763713
- German Tea & Herbal Infusions Association. (2025, June 25).Tea Report 2025: German Consumers Embrace Variety in Herbal and Fruit Infusions. https://teeverband.de/files/bilder/Presse/Tee-Report/Tee-Report2025/Downloads/PM/PRESSEMITTEILUNG%20Tee%20bleibt%20nicht%20stehen_Deutsche%20Verbraucher%20haben%20Freude%20an%20der%20Vielfalt.pdf
- Harney & Sons Fine Teas. (2026, June 12).Butterfly Pea Flower Loose-Leaf Herbal Infusion Specification. https://www.harney.com/products/butterfly-pea-flower
- Herbs & Kettles / Noble Roots Urban Garden LLC. (2026, June 14).Lavish Blue Tea and Blue Chai Boba Kit Product Portfolio. https://www.herbsandkettles.com/products/lavish-blue-tea
- Justia Trademarks. (2025, February 16).Herbs & Kettles with Love, Your Chaiwala: Noble Roots Urban Garden LLC Filing 99043325. https://trademarks.justia.com/990/43/herbs-kettles-with-love-your-99043325.html
- Lake Missoula Tea Company. (2026, June 15).Organic Butterfly Pea Flowers and Bodacious Blue Tea Specifications. https://lakemissoulateacompany.com/products/butterfly-pea-flowers
- National Center for Biotechnology Information. (2025, October 30).Clitoria ternatea: Perspectives on Its Application in Foods and Potential Health Benefits (PMC12609804). https://pmc.ncbi.nlm.nih.gov/articles/PMC12609804/
- National Center for Biotechnology Information. (2025, November 15).Development of Self-Healing Butterfly Pea Flowers Extract-Containing Packaging (PubMed 41125187). https://pubmed.ncbi.nlm.nih.gov/41125187/
- Revival Tea Company. (2026, June 16).Blue Tea Loose-Leaf and Pyramid Sachet Product Portfolio. https://revivalteacompany.com/products/blue-tea/
- Revival Tea Company. (2026, June 18).Wholesale Tea Ordering and Foodservice Program. https://revivalteacompany.com/wholesale/
- Rishi Tea & Botanicals. (2026, June 10).Organic Butterfly Pea Flower Loose-Leaf Herbal Tea. https://www.rishi-tea.com/products/butterfly-pea-flower-herbal-tea
- Rishi Tea & Botanicals. (2026, June 12).Butterfly Pea Limeade Powder Foodservice and Retail Specification. https://www.rishi-tea.com/products/butterfly-pea-limeade-powder
- Sancha Tea. (2026, June 15).Butterfly Pea Flower Caffeine-Free Herbal Infusion. https://sanchatea.com/products/butterfly-pea-flower-caffeine-free-herbal-tea
- The Hale Tea Company. (2026, June 14).Butterfly Pea Blend (Blue Tea) Retail and Wholesale Specification. https://www.haletea.com/products/butterfly-pea-blend
- TrademarkElite. (2026, February 24).Herbs & Kettles with Love, Your Chaiwala Registration Record 8148429. https://www.trademarkelite.com/trademark/trademark-detail/99043325/HERBS-KETTLES-WITH-LOVE-YOUR-CHAIWALA
- Tucson Tea Company. (2026, June 15).Butterfly Pea Flower Tea Blue Herbal Infusion. https://tucsontea.com/products/butterfly-pea-flower-blue-tea
- UK Food Standards Agency. (2025, May 18).Novel Foods Authorisation Guidance for Herbal and Botanical Imports. https://www.gov.uk/government/publications/novel-foods-authorisation-guidance/novel-foods-authorisation-guidance
- UK Tea & Infusions Association. (2025, May 20).Back To Black: Seven In 10 Brits Prefer a Traditional Brew, Says New Tea Census Study. https://www.tea.co.uk/news/article/back-to-black-seven-in-10-brits-prefer-a-traditional-brew-says-new-tea-census-study
- United States Patent and Trademark Office. (2025, July 15).USPTO Office Action Citing Redplum Private Limited BLUE TEA Registration 7234141. https://tmng-al.uspto.gov/resting2/api/casedoc/cms/case/97622403/office-action/OfficeAction7622825.pdf
- U.S. Food and Drug Administration. (2025, May 12).Regulatory Status of Color Additives: Butterfly Pea Flower Extract. https://hfpappexternal.fda.gov/scripts/Fdcc/index.cfm?id=ButterflyPeaFlowerExtract&set=ColorAdditives
- VAHDAM India. (2026, June 12).Butterfly Pea Flower Tea Herbal Tisane Loose-Leaf 1.76 oz Specification. https://www.vahdam.com/products/butterfly-pea-flower-tea-loose-leaf
- Yamashin Sangyo Co., Ltd. (2025, February 10).Butterfly Pea Whole Flower and Powder Commercial Product Catalog. https://www.yamashin-sangyo.co.jp/wp-content/uploads/2025/02/shiki_catalog_250128_web.pdf
Table of Content
- Key Takeaways
- Market Size and CAGR
- Top Growth Driver
- Fastest Growing Segment
- Leading Region
- Key Companies
- Emerging Opportunities
- Executive Summary
- Global Market Outlook
- Demand-side Trends
- Supply-side Trends
- Technology Roadmap Analysis
- Analysis and Recommendations
- Analyst Perspective (What is happening? Why now? What should investors know?)
- Key Questions Answered
- How large is the market?
- What is the CAGR?
- What are key trends?
- Which region dominates?
- Who are the leaders?
Read More...
- Market Overview
- Market Coverage / Taxonomy
- Market Definition / Scope / Limitations
- Research Methodology
- Chapter Orientation
- Analytical Lens and Working Hypotheses
- Market Structure, Signals, and Trend Drivers
- Benchmarking and Cross-market Comparability
- Market Sizing, Forecasting, and Opportunity Mapping
- Research Design and Evidence Framework
- Desk Research Programme (Secondary Evidence)
- Expert Input and Fieldwork (Primary Evidence)
- Tooling, Models, and Reference Databases
- Data Engineering and Model Build
- Quality Assurance and Audit Trail
- Market Background
- Market Dynamics (Drivers, Restraints, Opportunity, Trends)
- Scenario Forecast (Optimistic, Likely, Conservative)
- Impact Analysis
- AI Impact
- Sustainability Impact
- Regulatory Impact
- Technology Impact
- Consumer / Buyer Analysis
- Purchase Drivers
- Adoption Barriers
- Buyer Journey
- Opportunity Map Analysis
- Product Life Cycle Analysis
- Supply Chain Analysis
- Investment Feasibility Matrix
- Value Chain Analysis
- PESTLE and Porter's Analysis
- Regulatory Landscape
- Regional Parent Market Outlook
- Production and Consumption Statistics
- Import and Export Statistics
- Global Market Analysis and Forecast, 2021 to 2036
- Historical Market Size Value (USD Million) Analysis, 2021 to 2025
- Current and Future Market Size Value (USD Million) Projections, 2026 to 2036
- Y-o-Y Growth Trend Analysis
- Absolute $ Opportunity Analysis
- Global Market Pricing Analysis, 2021 to 2036
- Global Market Analysis and Forecast, By Product, 2021 to 2036
- Introduction / Key Findings
- Historical Market Size Value (USD Million) Analysis By Product, 2021 to 2025
- Current and Future Market Size Value (USD Million) Analysis and Forecast By Product, 2026 to 2036
- Loose Leaves
- Powder
- Others
- Y-o-Y Growth Trend Analysis By Product, 2021 to 2025
- Absolute $ Opportunity Analysis By Product, 2026 to 2036
- Global Market Analysis and Forecast, By Type, 2021 to 2036
- Introduction / Key Findings
- Historical Market Size Value (USD Million) Analysis By Type, 2021 to 2025
- Current and Future Market Size Value (USD Million) Analysis and Forecast By Type, 2026 to 2036
- Conventional
- Organic
- Y-o-Y Growth Trend Analysis By Type, 2021 to 2025
- Absolute $ Opportunity Analysis By Type, 2026 to 2036
- Global Market Analysis and Forecast, By Distribution Channel, 2021 to 2036
- Introduction / Key Findings
- Historical Market Size Value (USD Million) Analysis By Distribution Channel, 2021 to 2025
- Current and Future Market Size Value (USD Million) Analysis and Forecast By Distribution Channel, 2026 to 2036
- Off-trade
- On-trade
- Y-o-Y Growth Trend Analysis By Distribution Channel, 2021 to 2025
- Absolute $ Opportunity Analysis By Distribution Channel, 2026 to 2036
- Global Market Analysis and Forecast, By Region, 2021 to 2036
- Introduction
- Historical Market Size Value (USD Million) Analysis By Region, 2021 to 2025
- Current Market Size Value (USD Million) Analysis and Forecast By Region, 2026 to 2036
- North America
- Western Europe
- East Asia
- South Asia and Pacific
- Market Attractiveness Analysis By Region
- North America Market Analysis and Forecast, By Country, 2021 to 2036
- Historical Market Size Value (USD Million) Trend Analysis By Market Taxonomy, 2021 to 2025
- Market Size Value (USD Million) Forecast By Market Taxonomy, 2026 to 2036
- By Country
- United States
- Canada
- By Product
- By Type
- By Distribution Channel
- By Country
- Market Attractiveness Analysis
- By Country
- By Product
- By Type
- By Distribution Channel
- Key Takeaways
- Western Europe Market Analysis and Forecast, By Country
- Historical Market Size Value (USD Million) Trend Analysis By Market Taxonomy, 2021 to 2025
- Market Size Value (USD Million) Forecast By Market Taxonomy, 2026 to 2036
- By Country
- United Kingdom
- Germany
- France
- By Product
- By Type
- By Distribution Channel
- By Country
- Market Attractiveness Analysis
- By Country
- By Product
- By Type
- By Distribution Channel
- Key Takeaways
- East Asia Market Analysis and Forecast, By Country
- Historical Market Size Value (USD Million) Trend Analysis By Market Taxonomy, 2021 to 2025
- Market Size Value (USD Million) Forecast By Market Taxonomy, 2026 to 2036
- By Country
- China
- Japan
- South Korea
- By Product
- By Type
- By Distribution Channel
- By Country
- Market Attractiveness Analysis
- By Country
- By Product
- By Type
- By Distribution Channel
- Key Takeaways
- South Asia and Pacific Market Analysis and Forecast, By Country
- Historical Market Size Value (USD Million) Trend Analysis By Market Taxonomy, 2021 to 2025
- Market Size Value (USD Million) Forecast By Market Taxonomy, 2026 to 2036
- By Country
- India
- Australia
- Rest of world aggregate
- By Product
- By Type
- By Distribution Channel
- By Country
- Market Attractiveness Analysis
- By Country
- By Product
- By Type
- By Distribution Channel
- Key Takeaways
- Key Countries Market Analysis
- United States
- Pricing Analysis
- Market Share Analysis, 2025
- By Product
- By Type
- By Distribution Channel
- Canada
- Pricing Analysis
- Market Share Analysis, 2025
- By Product
- By Type
- By Distribution Channel
- Germany
- Pricing Analysis
- Market Share Analysis, 2025
- By Product
- By Type
- By Distribution Channel
- United Kingdom
- Pricing Analysis
- Market Share Analysis, 2025
- By Product
- By Type
- By Distribution Channel
- France
- Pricing Analysis
- Market Share Analysis, 2025
- By Product
- By Type
- By Distribution Channel
- India
- Pricing Analysis
- Market Share Analysis, 2025
- By Product
- By Type
- By Distribution Channel
- China
- Pricing Analysis
- Market Share Analysis, 2025
- By Product
- By Type
- By Distribution Channel
- Japan
- Pricing Analysis
- Market Share Analysis, 2025
- By Product
- By Type
- By Distribution Channel
- South Korea
- Pricing Analysis
- Market Share Analysis, 2025
- By Product
- By Type
- By Distribution Channel
- Australia
- Pricing Analysis
- Market Share Analysis, 2025
- By Product
- By Type
- By Distribution Channel
- United States
- Market Structure Analysis
- Competition Dashboard
- Competition Benchmarking
- Market Share Analysis of Top Players
- By Regional
- By Product
- By Type
- By Distribution Channel
- Emerging Startups
- Innovation Benchmarking
- Competition Analysis
- Competition Deep Dive
- Blue Tea (Redplum Private Limited)
- Overview
- Product Portfolio
- Profitability by Market Segments
- Sales Footprint
- Strategy Overview
- Marketing Strategy
- Product Strategy
- Channel Strategy
- Rishi Tea & Botanicals
- Harney & Sons Fine Teas
- VAHDAM India
- Yamashin Sangyo Co., Ltd.
- Revival Tea Company
- Noble Roots Urban Garden LLC (Herbs & Kettles)
- Lake Missoula Tea Company
- Tucson Tea Company
- Sancha Tea
- Blue Tea (Redplum Private Limited)
- Case Studies
- Success Stories
- Recent Developments
- Competition Deep Dive
- Assumptions & Acronyms Used
List of Tables
- Table 1: Global Market Value (USD Million) Forecast by Region, 2021 to 2036
- Table 2: Global Market Value (USD Million) Forecast by Product, 2021 to 2036
- Table 3: Global Market Value (USD Million) Forecast by Type, 2021 to 2036
- Table 4: Global Market Value (USD Million) Forecast by Distribution Channel, 2021 to 2036
- Table 5: North America Market Value (USD Million) Forecast by Country, 2021 to 2036
- Table 6: North America Market Value (USD Million) Forecast by Product, 2021 to 2036
- Table 7: North America Market Value (USD Million) Forecast by Type, 2021 to 2036
- Table 8: North America Market Value (USD Million) Forecast by Distribution Channel, 2021 to 2036
- Table 9: Western Europe Market Value (USD Million) Forecast by Country, 2021 to 2036
- Table 10: Western Europe Market Value (USD Million) Forecast by Product, 2021 to 2036
- Table 11: Western Europe Market Value (USD Million) Forecast by Type, 2021 to 2036
- Table 12: Western Europe Market Value (USD Million) Forecast by Distribution Channel, 2021 to 2036
- Table 13: East Asia Market Value (USD Million) Forecast by Country, 2021 to 2036
- Table 14: East Asia Market Value (USD Million) Forecast by Product, 2021 to 2036
- Table 15: East Asia Market Value (USD Million) Forecast by Type, 2021 to 2036
- Table 16: East Asia Market Value (USD Million) Forecast by Distribution Channel, 2021 to 2036
- Table 17: South Asia and Pacific Market Value (USD Million) Forecast by Country, 2021 to 2036
- Table 18: South Asia and Pacific Market Value (USD Million) Forecast by Product, 2021 to 2036
- Table 19: South Asia and Pacific Market Value (USD Million) Forecast by Type, 2021 to 2036
- Table 20: South Asia and Pacific Market Value (USD Million) Forecast by Distribution Channel, 2021 to 2036
List of Figures
- Figure 1: Global Market Pricing Analysis
- Figure 2: Global Market Value (USD Million) Forecast 2021-2036
- Figure 3: Global Market Value Share and BPS Analysis by Product, 2026 and 2036
- Figure 4: Global Market Y-o-Y Growth Comparison by Product, 2026-2036
- Figure 5: Global Market Attractiveness Analysis by Product
- Figure 6: Global Market Value Share and BPS Analysis by Type, 2026 and 2036
- Figure 7: Global Market Y-o-Y Growth Comparison by Type, 2026-2036
- Figure 8: Global Market Attractiveness Analysis by Type
- Figure 9: Global Market Value Share and BPS Analysis by Distribution Channel, 2026 and 2036
- Figure 10: Global Market Y-o-Y Growth Comparison by Distribution Channel, 2026-2036
- Figure 11: Global Market Attractiveness Analysis by Distribution Channel
- Figure 12: Global Market Value (USD Million) Share and BPS Analysis by Region, 2026 and 2036
- Figure 13: Global Market Y-o-Y Growth Comparison by Region, 2026-2036
- Figure 14: Global Market Attractiveness Analysis by Region
- Figure 15: North America Market Incremental Dollar Opportunity, 2026-2036
- Figure 16: Western Europe Market Incremental Dollar Opportunity, 2026-2036
- Figure 17: East Asia Market Incremental Dollar Opportunity, 2026-2036
- Figure 18: South Asia and Pacific Market Incremental Dollar Opportunity, 2026-2036
- Figure 19: North America Market Value Share and BPS Analysis by Country, 2026 and 2036
- Figure 20: North America Market Value Share and BPS Analysis by Product, 2026 and 2036
- Figure 21: North America Market Y-o-Y Growth Comparison by Product, 2026-2036
- Figure 22: North America Market Attractiveness Analysis by Product
- Figure 23: North America Market Value Share and BPS Analysis by Type, 2026 and 2036
- Figure 24: North America Market Y-o-Y Growth Comparison by Type, 2026-2036
- Figure 25: North America Market Attractiveness Analysis by Type
- Figure 26: North America Market Value Share and BPS Analysis by Distribution Channel, 2026 and 2036
- Figure 27: North America Market Y-o-Y Growth Comparison by Distribution Channel, 2026-2036
- Figure 28: North America Market Attractiveness Analysis by Distribution Channel
- Figure 29: Western Europe Market Value Share and BPS Analysis by Country, 2026 and 2036
- Figure 30: Western Europe Market Value Share and BPS Analysis by Product, 2026 and 2036
- Figure 31: Western Europe Market Y-o-Y Growth Comparison by Product, 2026-2036
- Figure 32: Western Europe Market Attractiveness Analysis by Product
- Figure 33: Western Europe Market Value Share and BPS Analysis by Type, 2026 and 2036
- Figure 34: Western Europe Market Y-o-Y Growth Comparison by Type, 2026-2036
- Figure 35: Western Europe Market Attractiveness Analysis by Type
- Figure 36: Western Europe Market Value Share and BPS Analysis by Distribution Channel, 2026 and 2036
- Figure 37: Western Europe Market Y-o-Y Growth Comparison by Distribution Channel, 2026-2036
- Figure 38: Western Europe Market Attractiveness Analysis by Distribution Channel
- Figure 39: East Asia Market Value Share and BPS Analysis by Country, 2026 and 2036
- Figure 40: East Asia Market Value Share and BPS Analysis by Product, 2026 and 2036
- Figure 41: East Asia Market Y-o-Y Growth Comparison by Product, 2026-2036
- Figure 42: East Asia Market Attractiveness Analysis by Product
- Figure 43: East Asia Market Value Share and BPS Analysis by Type, 2026 and 2036
- Figure 44: East Asia Market Y-o-Y Growth Comparison by Type, 2026-2036
- Figure 45: East Asia Market Attractiveness Analysis by Type
- Figure 46: East Asia Market Value Share and BPS Analysis by Distribution Channel, 2026 and 2036
- Figure 47: East Asia Market Y-o-Y Growth Comparison by Distribution Channel, 2026-2036
- Figure 48: East Asia Market Attractiveness Analysis by Distribution Channel
- Figure 49: South Asia and Pacific Market Value Share and BPS Analysis by Country, 2026 and 2036
- Figure 50: South Asia and Pacific Market Value Share and BPS Analysis by Product, 2026 and 2036
- Figure 51: South Asia and Pacific Market Y-o-Y Growth Comparison by Product, 2026-2036
- Figure 52: South Asia and Pacific Market Attractiveness Analysis by Product
- Figure 53: South Asia and Pacific Market Value Share and BPS Analysis by Type, 2026 and 2036
- Figure 54: South Asia and Pacific Market Y-o-Y Growth Comparison by Type, 2026-2036
- Figure 55: South Asia and Pacific Market Attractiveness Analysis by Type
- Figure 56: South Asia and Pacific Market Value Share and BPS Analysis by Distribution Channel, 2026 and 2036
- Figure 57: South Asia and Pacific Market Y-o-Y Growth Comparison by Distribution Channel, 2026-2036
- Figure 58: South Asia and Pacific Market Attractiveness Analysis by Distribution Channel
- Figure 59: Global Market - Tier Structure Analysis
- Figure 60: Global Market - Company Share Analysis
Frequently Asked Questions
How big is the blue tea market in 2026?
Future Market Insights estimates the global blue tea market valuation at USD 157.3 million in 2026, advancing from USD 148.5 million in 2025 across dried butterfly pea flower infusions and blends.
What is the blue tea market forecast and CAGR from 2026 to 2036?
FMI projects the global blue tea market to grow at a 5.9% CAGR between 2026 and 2036, reaching USD 279.1 million by 2036 and generating USD 121.8 million in incremental dollar opportunity.
Which Product segment leads the blue tea market in 2026?
Loose Leaves lead the Product axis with 49.0% of global revenue in 2026 as whole dried flowers allow consumers and tea blenders to inspect petal quality and adjust infusion strength.
Which Type segment accounts for the largest share of the blue tea market?
Conventional leads the Type axis at 63.0% of 2026 valuation supported by extensive smallholder harvesting networks across Southeast Asia and affordable consumer price points.
Which Distribution Channel leads global blue tea sales?
Off-trade accounts for 63.0% of Distribution Channel revenue in 2026 driven by strong online sales of loose-flower pouches and supermarket retail packaging.
Which country is the largest blue tea market in 2026?
USA is the largest national blue tea market in 2026 at USD 34.6 million (22.0% global share), followed by India at USD 25.2 million (16.0% share) and China at USD 18.9 million (12.0% share).
Which profiled country is projected to grow fastest through 2036?
India records the fastest forecast growth rate among all profiled countries at an 8.8% CAGR from 2026 to 2036, expanding from USD 25.2 million to USD 58.6 million, followed by Japan at 7.4% CAGR.
Which companies are profiled as key players in the blue tea market?
Key profiled companies includeBlue Tea (Redplum Private Limited), Rishi Tea & Botanicals, Harney & Sons Fine Teas, VAHDAM India, Yamashin Sangyo Co., Ltd., Revival Tea Company, Noble Roots Urban Garden LLC, Lake Missoula Tea Company, Tucson Tea Company, and Sancha Tea.
Preview the report firsthand - request a free sample
Get SampleGet the brochure for pricing and purchase details.
Get PDF
