Methodology

Bus Isolator Market Forecast and Outlook 2025 to 2035

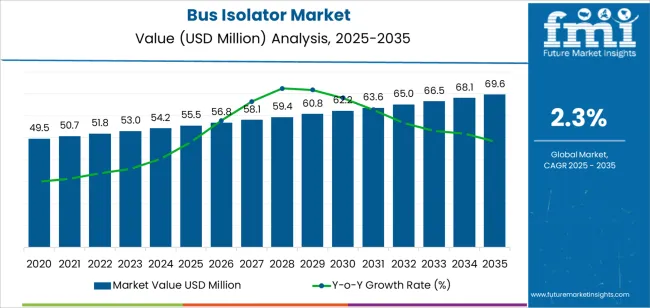
The bus isolator market is valued at USD 55.5 million in 2025 and is expected to reach USD 69.6 million by 2035 at a CAGR of 2.3%, creating an absolute dollar opportunity of USD 14.1 million over the period. Demand is strengthening as power transmission and distribution operators expand infrastructure and replace legacy switching components to support higher-voltage systems and stable grid operation. Bus isolators ensure safe circuit separation during maintenance and inspection in substations and switchyards, supported by compact assemblies, corrosion-resistant housings, and high mechanical endurance.

Modular designs and improved insulation materials enhance installation efficiency and operational reliability across industrial and utility environments. CAN bus isolators lead with a 34.0% share due to their role in protecting data communication lines from noise, ground loops, and transient surges, while industrial automation accounts for a 42.0% share as factories adopt advanced control systems requiring precise signal isolation. Regional momentum is strongest in the Asia Pacific as grid expansion programs and industrial output improvements increase equipment deployment, with North America and Europe maintaining steady replacement activity driven by renewable integration and substation refurbishment. Manufacturers focus on insulation strength, contact integrity, and thermal performance to meet evolving safety and operational standards. 
Quick Stats: Bus Isolator Market

  • Bus Isolator Market Value (2025): USD 55.5 million
  • Bus Isolator Market Forecast Value (2035): USD 69.6 million
  • Bus Isolator Market Forecast CAGR (2025-2035): 2.3%
  • Leading Type in Bus Isolator Market: CAN Bus Isolator
  • Key Growth Regions: Asia Pacific, North America, and Europe
  • Top Players: Nanjing Electric, Siemens, GE, ABB, Gulf Security Technology, MBS AG, Analog Devices, Iron Man Safety, Dowe, Mars RF, Acromag, Skyworks Solutions, NVE Corporation

Bus Isolator Market Market Value Analysis

What is the Growth Forecast for the Bus Isolator Market through 2035?

Asia Pacific remains the dominant regional market, supported by extensive infrastructure development and grid expansion programs. North America and Europe exhibit stable replacement demand associated with renewable integration and substation refurbishment projects. Through 2035, the market is expected to benefit from the ongoing transition toward higher voltage systems, consistent safety regulation enforcement, and improvements in manufacturing precision and equipment durability.

Between 2025 and 2030, the Bus Isolator Market is projected to grow from USD 55.5 million to USD 62.2 million, registering a rolling compound annual growth rate (CAGR) of approximately 2.3%. This period will be driven by increasing investments in public transportation infrastructure, coupled with the modernization of electrical systems in buses to enhance safety and reliability. The growing adoption of electric and hybrid buses is prompting manufacturers to develop compact, high-performance isolators with improved heat resistance and dielectric strength. Market players are focusing on innovation in insulation materials and design optimization to support vehicle electrification trends globally.

From 2030 to 2035, the market is forecast to expand from USD 62.2 million to USD 69.6 million, achieving a rolling CAGR of around 2.3%. This phase will be shaped by the continued shift toward electric mobility, the integration of advanced power management systems, and the rise of smart bus networks. Demand for isolators that meet high-voltage and thermal endurance standards will increase as transportation fleets upgrade to meet energy efficiency and emission targets. Strategic collaborations between component suppliers and bus OEMs will foster the development of lightweight, durable isolator solutions optimized for modern electric and hybrid bus architectures.

Bus Isolator Market Key Takeaways

Metric Value
Market Value (2025) USD 55.5 million
Market Forecast Value (2035) USD 69.6 million
Forecast CAGR (2025 to 2035) 2.3%

What Factors Are Contributing to the Expansion of the Bus Isolator Market in Power and Transportation Networks?

The bus isolator market is expanding as electrical infrastructure modernization and rising energy distribution demands require reliable disconnection mechanisms for maintenance and safety. Bus isolators, essential in substations, switchgear, and transmission systems, provide secure isolation of electrical circuits during repair or inspection. Utilities and industrial operators increasingly specify high-voltage isolators capable of withstanding elevated current loads and environmental stress. Manufacturers focus on contact design optimization, corrosion-resistant materials, and compact mechanical assemblies to ensure operational reliability and reduce arc formation during disconnection. Expanding grid capacity projects in developing economies continue to generate consistent product demand.

Growth also reflects the parallel expansion of electric transportation systems and renewable power integration. Urban transit networks and electric bus depots employ isolators for circuit protection within charging and power distribution units. The shift toward decentralized energy systems, including solar and wind installations, further increases isolator usage for sectional control and fault isolation. Automated and motorized isolators gain traction for remote operation and integration with digital monitoring platforms, improving grid flexibility. Despite challenges related to installation costs and maintenance access in high-voltage environments, technological advances in insulation materials and switching mechanisms sustain global market momentum across industrial, utility, and transportation sectors.

How Is the Bus Isolator Market Segmented by Product Type, Application, and Region?

The bus isolator market is segmented by product type, application, and region. By product type, the market is divided into CAN bus isolator, RS-485 bus isolator, and Profibus isolator. Based on application, it is categorized into industrial automation, power systems, smart buildings, and medical equipment. Regionally, the market is segmented into North America, Europe, East Asia, South Asia, Latin America, and the Middle East & Africa. These segments define technology compatibility, end-use integration, and regional adoption patterns in digital communication and control infrastructure systems.
By Product Type, Which Segment Leads the Bus Isolator Market?

Bus Isolator Market Analysis By Product Type

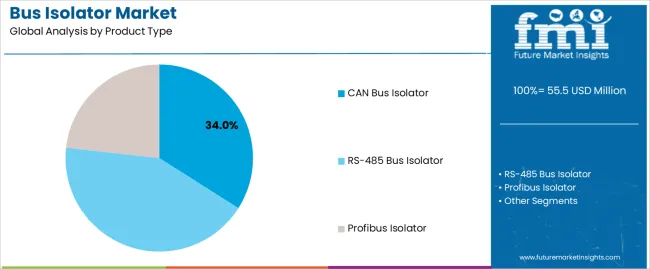
The CAN bus isolator segment accounts for approximately 34.0% of the global bus isolator market in 2025, representing the leading product category. This dominance reflects the extensive use of CAN bus systems across industrial, automotive, and building automation networks requiring reliable signal isolation and noise immunity. CAN bus isolators are critical for protecting communication interfaces from ground loops, transient surges, and electromagnetic interference, ensuring uninterrupted data integrity in harsh electrical environments.

The segment’s growth is supported by widespread CAN protocol adoption in automation and machinery control applications. Manufacturers continue to improve isolation voltage ratings, data transmission speeds, and integrated protection circuits to meet modern control system standards. CAN bus isolators are favored for their stability, compact design, and ease of integration into both legacy and contemporary communication architectures. The segment’s continued relevance in programmable logic controller (PLC) networks and distributed control systems underlines its essential role in maintaining reliable data transfer across complex industrial and vehicular communication frameworks. As automation and control requirements expand, CAN bus isolators remain central to ensuring stable and interference-free connectivity in global communication networks.
By Application, Which Segment Dominates Market Demand?

Bus Isolator Market Analysis By Application

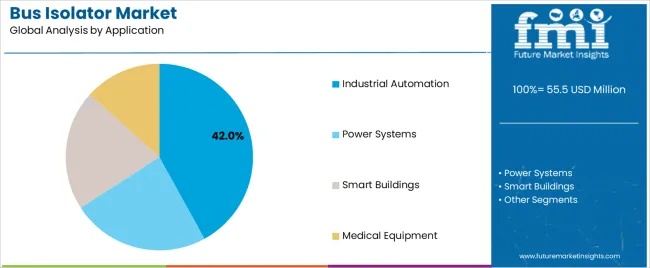
The industrial automation segment represents about 42.0% of the total bus isolator market in 2025, making it the largest application category. This leadership is attributed to the extensive deployment of communication isolation systems in automated manufacturing, process control, and industrial equipment networks. Bus isolators protect control modules, sensors, and actuators from electrical transients and signal distortion, supporting reliable operation across distributed industrial communication platforms.

Demand is reinforced by expanding factory automation and the growing adoption of industrial Ethernet and fieldbus systems. In production environments, isolators play a key role in maintaining communication stability between PLCs and connected devices under conditions of high electrical noise. The segment benefits from modernization initiatives emphasizing predictive maintenance, data monitoring, and smart manufacturing infrastructure. Regional demand is strongest in East Asia and Europe, where industrial output and process automation levels are high. Manufacturers are focusing on miniaturized isolator modules with higher isolation resistance and faster data throughput to support next-generation automation networks. The industrial automation segment continues to dominate market demand due to its integral role in ensuring electrical safety, operational efficiency, and system reliability across diverse industrial communication environments.

What are the Key Trends, Drivers, and Restraints in the Bus Isolator Market?

The bus isolator market is expanding in response to growing industrial automation, energy infrastructure upgrades and power distribution needs. Bus isolators devices used to disconnect or isolate sections of busbars or power distribution panels have become critical for city utilities, factories and data centres to manage faults and minimise downtime. Rising investments in smart grids and renewable energy systems further support demand for advanced isolation components. The market is constrained by high equipment cost, complex installation requirements, and competition from alternative switchgear solutions. A notable trend is the rise of digital-enabled isolators with monitoring capabilities and enhanced safety compliance.

What factors are driving growth in the bus isolator market?

Growth is mainly driven by expansion of power infrastructure and industrial facilities that require reliable distribution systems. As factories adopt automated production lines and data centres scale operations, the need for bus-bar installations with isolation capability increases. Renewable energy projects such as solar farms and wind installations also demand isolators to manage fluctuating supply and grid integration. In parallel, safety regulations push facility operators to adopt isolators that support maintenance isolation, arc-flash mitigation and fault segregation. These factors raise equipment adoption across varied sectors.

What restraints are limiting market expansion?

The market faces limitations due to high investment cost and technical complexity of bus-isolator systems. Installation often involves large bus-bar sections, specialised housing, and rigorous safety certification, which raises upfront cost and extends implementation timelines. Maintenance and replacement of isolators can be disruptive and costly, particularly in retrofit scenarios within operational facilities. Moreover, in some applications simpler switchgear or circuit breakers may serve similar functions at lower cost, reducing the incentive to invest in dedicated isolators. These factors reduce penetration, especially in cost-sensitive or smaller-scale operations.

What key trends are shaping future market development?

A prominent trend is the integration of digital monitoring, remote operation and predictive-maintenance features into bus isolators. Manufacturers are developing isolators that include sensors for current, temperature, vibration and arc detection, enabling real-time diagnostics and condition-based service. Modular designs that support easy expansion or retrofitting are gaining traction, along with isolators rated for higher currents, voltages and fault capacities to meet renewable and industrial power demands. Geographic growth in Asia Pacific and Latin America is notable as infrastructure modernisation and industrialisation drive new installations.
What is the Analysis of the Automobile Brake Shoes Market by Key Country?

Bus Isolator Market Cagr Analysis By Country

Country CAGR
China 3.1%
India 2.9%
Germany 2.6%
Brazil 2.4%
USA 2.2%
UK 2.0%
Japan 1.7%

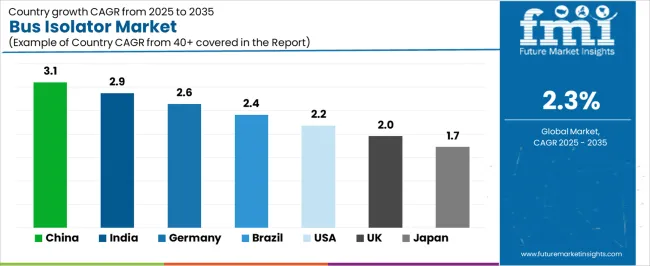
The Automobile Brake Shoes Market is expanding at a moderate pace globally, with China leading at a 3.1% CAGR through 2035, supported by strong vehicle production volumes, aftermarket demand, and the shift toward improved braking efficiency. India follows at 2.9%, driven by growing automotive manufacturing and increased consumer focus on safety and maintenance. Germany records 2.6%, reflecting advanced engineering standards and adoption of high-performance materials. Brazil grows at 2.4%, benefiting from expansion in commercial vehicle fleets and repair market activity. The USA, at 2.2%, maintains steady demand driven by replacement cycles and technological upgrades, while the UK (2.0%) and Japan (1.7%) focus on lightweight materials, sustainability, and continued integration of advanced friction technologies in braking systems.

The report covers an in-depth analysis of 40+ countries top-performing countries are highlighted below.

How Is Expanding Vehicle Manufacturing Advancing Market Growth in China?

Rapid automotive production expansion is strengthening the automobile brake shoes market in China, projected to grow at a CAGR of 3.1% through 2035. Strong output in passenger and light commercial vehicles continues to support high component demand. Local manufacturers are improving friction materials, bonding strength, and wear resistance to meet updated safety standards. Electrification trends are encouraging the development of quieter, heat-efficient brake shoes suitable for electric and hybrid vehicles, enhancing the country’s competitive edge in component manufacturing.

  • Rising vehicle output drives consistent demand for brake systems.
  • Product innovation aligns with electric vehicle applications.
  • Domestic R&D improves wear performance and reliability.
  • Compliance with safety standards supports export potential.

Why Is Component Localization Strengthening Market Potential in India?

India is witnessing strong development in the automobile brake shoes market, advancing at a CAGR of 2.9%, supported by domestic manufacturing growth and policy-driven localization. Expansion in two-wheeler and small car segments continues to sustain large-scale consumption. Local producers focus on enhancing product lifespan and friction uniformity through improved composite formulations. The government’s Make-in-India initiative and focus on supply chain resilience are reinforcing capacity expansion and cost-efficient production across the automotive component sector.

  • Localization programs strengthen manufacturing capacity and output.
  • Two-wheeler production remains a key market contributor.
  • Improved composite materials enhance braking efficiency.
  • Policy incentives sustain long-term industrial competitiveness.

How Does Precision Engineering Maintain Market Competitiveness in Germany?

Across Germany, the automobile brake shoes market is advancing at a CAGR of 2.6%, supported by high manufacturing standards and continued focus on precision engineering. The country’s automotive suppliers emphasize advanced metallurgy and surface treatment to enhance heat tolerance and friction stability. Integration with electronic braking systems ensures compatibility with evolving vehicle architectures. Export opportunities remain strong due to Europe’s demand for premium braking components meeting stringent safety regulations and performance benchmarks.

  • Advanced engineering supports durable and consistent performance.
  • Integration with electronic systems promotes design innovation.
  • Export activity reinforces industrial competitiveness.
  • Regulatory alignment maintains uniform quality standards.

Why Is Vehicle Production Recovery Supporting Market Expansion in Brazil?

Brazil is recording gradual progress in the automobile brake shoes market, projected to grow at a CAGR of 2.4% through 2035, supported by recovery in automotive manufacturing and aftermarket replacement activity. Domestic producers focus on cost-effective materials offering extended wear life and reliable performance under tropical conditions. Partnerships with global suppliers are strengthening access to technical expertise and improved production processes. Increasing demand for affordable replacement parts sustains growth within the aftermarket distribution network.
  • Automotive sector recovery sustains component procurement.
  • Global collaboration enhances product quality standards.
  • Cost-effective design meets regional performance needs.
  • Aftermarket networks drive long-term replacement cycles.

How Do Aftermarket Dynamics Support Market Growth in the United States?

Bus Isolator Market Country Value Analysis

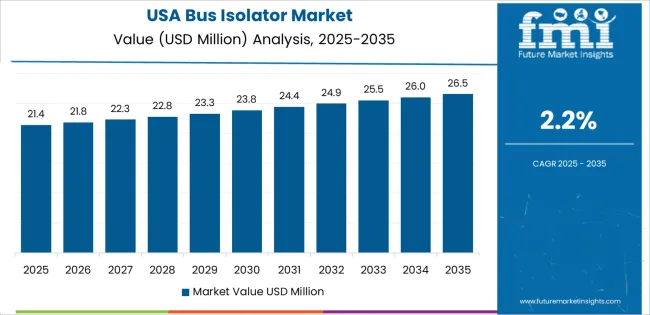
In the United States, the automobile brake shoes market is expanding at a CAGR of 2.2%, driven by a mature automotive industry and consistent aftermarket replacement demand. Manufacturers focus on noise reduction, wear resistance, and heat dissipation improvements through friction material optimization. Product innovations are addressing the needs of light trucks and passenger vehicles, which dominate replacement volume. Strong vehicle ownership rates and well-developed service networks maintain steady component consumption nationwide.

  • Aftermarket segment provides consistent revenue stability.
  • Material innovation enhances braking reliability and comfort.
  • Large vehicle base supports recurring replacement demand.
  • Service infrastructure ensures wide market availability.

Why Is E-Commerce Integration Sustaining Market Activity in the United Kingdom?

Across the United Kingdom, the automobile brake shoes market is advancing at a CAGR of 2.0%, supported by the rapid integration of e-commerce distribution in the automotive aftermarket. The shift toward online spare part sourcing improves accessibility for workshops and independent mechanics. Manufacturers emphasize compliance with European environmental standards, focusing on non-asbestos materials and recyclable components. Consistent replacement activity among older vehicle fleets maintains steady product turnover across domestic channels.

  • E-commerce expansion enhances aftermarket accessibility.
  • Environmental regulations drive material innovation.
  • Older vehicle fleets sustain replacement cycles.
  • Online retail improves supply chain efficiency.

How Is Material Innovation Sustaining Market Stability in Japan?

Japan is growing steadily in the automobile brake shoes market, with revenue projected to rise at a CAGR of 1.7% through 2035. Domestic manufacturers prioritize miniaturization, corrosion resistance, and low-noise performance in compact car braking systems. Automation and robotics integration in production improve uniformity and precision. Continuous R&D investment in composite friction materials strengthens global competitiveness while meeting local safety and durability expectations. Stable aftermarket replacement rates ensure long-term market resilience.
  • Automation supports precision and production consistency.
  • Friction material research enhances product quality.
  • Compact car demand maintains domestic consumption.
  • Aftermarket activity reinforces market continuity.

How Competitive Is the Global Bus Isolator Market and What Defines Its Strategic Landscape?

Bus Isolator Market Analysis By Company

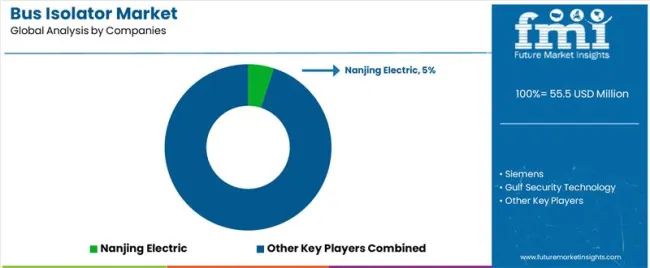
The global bus isolator market presents moderate concentration, shaped by established electrical equipment manufacturers and semiconductor component suppliers. Nanjing Electric leads with an estimated 5% market share, supported by its specialization in high-voltage isolation systems and substation components designed for power distribution networks. Siemens, GE, and ABB maintain strong positions through extensive product portfolios integrating isolator technology into smart grid infrastructure and industrial automation solutions. Gulf Security Technology competes regionally by providing isolation modules tailored for energy control and safety systems. MBS AG and Analog Devices contribute advanced signal isolation components and sensor interface modules for precision electronic and industrial communication applications.

Iron Man Safety, Dowe, and Mars RF focus on compact and application-specific isolators for low-voltage and communication system environments. Acromag and Skyworks Solutions emphasize integrated isolation technologies for data transmission, RF performance, and signal integrity in aerospace and defense applications. NVE Corporation delivers magnetically coupled isolators with high noise immunity and reliability for industrial automation and instrumentation. Competition in this market is defined by insulation strength, bandwidth capability, and thermal reliability. Strategic differentiation relies on miniaturization, digital signal compatibility, and compliance with IEC and UL safety standards, while long-term competitiveness is driven by adoption within smart grid modernization, industrial IoT integration, and power electronics efficiency improvements.

Key Players in the Market

  • Nanjing Electric
  • Siemens
  • Gulf Security Technology
  • GE
  • ABB
  • MBS AG
  • Analog Devices
  • Iron Man Safety
  • Dowe
  • Mars RF
  • Acromag
  • Skyworks Solutions
  • NVE Corporation

Report Scope for the Bus Isolator Market

Items Values
Quantitative Units (2025) USD million
Type (Product Classification) CAN Bus Isolator, RS-485 Bus Isolator, Profibus Isolator
Application Industrial Automation, Power Systems, Smart Buildings, Medical Equipment
Regions Covered North America, Europe, East Asia, South Asia, Latin America, Middle East & Africa, Eastern Europe
Countries Covered China, India, USA, Germany, Brazil, UK, Japan, and 40+ countries
Key Companies Profiled Nanjing Electric, Siemens, GE, ABB, Gulf Security Technology, MBS AG, Analog Devices, Iron Man Safety, Dowe, Mars RF, Acromag, Skyworks Solutions, NVE Corporation
Additional Attributes Dollar sales by product type and application; comparative analysis of communication isolation technologies (CAN, RS-485, Profibus); integration of digital monitoring and remote operation; regulatory compliance with IEC/UL standards; adoption in smart grid modernization and EV charging networks; technological advances in insulation, contact design, and thermal resistance; competitive benchmarking and regional adoption insights.

Bus Isolator Market by Segments

Product Type:

  • CAN Bus Isolator
  • RS-485 Bus Isolator
  • Profibus Isolator

Application:

  • Industrial Automation
  • Power Systems
  • Smart Buildings
  • Medical Equipment

Region:

  • East Asia
    • China
    • Japan
    • South Korea
    • Taiwan
    • Rest of East Asia
  • Europe
    • Germany
    • UK
    • France
    • Italy
    • Spain
    • Switzerland
    • Nordic
    • BENELUX
    • Rest of Europe
  • North America
    • USA
    • Canada
    • Mexico
  • South Asia
    • India
    • Pakistan
    • Bangladesh
    • Rest of South Asia
  • Latin America
    • Brazil
    • Argentina
    • Chile
    • Rest of Latin America
  • Middle East & Africa
    • Kingdom of Saudi Arabia
    • Other GCC Countries
    • Turkey
    • South Africa
    • Other African Union
    • Rest of Middle East & Africa
  • Eastern Europe
    • Russia
    • Poland
    • Czech Republic
    • Rest of Eastern Europe

Frequently Asked Questions

How big is the bus isolator market in 2025?

The global bus isolator market is estimated to be valued at USD 55.5 million in 2025.

What will be the size of bus isolator market in 2035?

The market size for the bus isolator market is projected to reach USD 69.6 million by 2035.

How much will be the bus isolator market growth between 2025 and 2035?

The bus isolator market is expected to grow at a 2.3% CAGR between 2025 and 2035.

What are the key product types in the bus isolator market?

The key product types in bus isolator market are can bus isolator, rs-485 bus isolator and profibus isolator.

Which application segment to contribute significant share in the bus isolator market in 2025?

In terms of application, industrial automation segment to command 42.0% share in the bus isolator market in 2025.

Table of Content

  1. Executive Summary
    • Global Market Outlook
    • Demand to side Trends
    • Supply to side Trends
    • Technology Roadmap Analysis
    • Analysis and Recommendations
  2. Market Overview
    • Market Coverage / Taxonomy
    • Market Definition / Scope / Limitations
  3. Market Background
    • Market Dynamics
      • Drivers
      • Restraints
      • Opportunity
      • Trends
    • Scenario Forecast
      • Demand in Optimistic Scenario
      • Demand in Likely Scenario
      • Demand in Conservative Scenario
    • Opportunity Map Analysis
    • Product Life Cycle Analysis
    • Supply Chain Analysis
    • Investment Feasibility Matrix
    • Value Chain Analysis
    • PESTLE and Porter’s Analysis
    • Regulatory Landscape
    • Regional Parent Market Outlook
    • Production and Consumption Statistics
    • Import and Export Statistics
  4. Global Market Analysis 2020 to 2024 and Forecast, 2025 to 2035
    • Historical Market Size Value (USD Million) Analysis, 2020 to 2024
    • Current and Future Market Size Value (USD Million) Projections, 2025 to 2035
      • Y to o to Y Growth Trend Analysis
      • Absolute $ Opportunity Analysis
  5. Global Market Pricing Analysis 2020 to 2024 and Forecast 2025 to 2035
  6. Global Market Analysis 2020 to 2024 and Forecast 2025 to 2035, By Product Type
    • Introduction / Key Findings
    • Historical Market Size Value (USD Million) Analysis By Product Type , 2020 to 2024
    • Current and Future Market Size Value (USD Million) Analysis and Forecast By Product Type , 2025 to 2035
      • CAN Bus Isolator
      • RS-485 Bus Isolator
      • Profibus Isolator
    • Y to o to Y Growth Trend Analysis By Product Type , 2020 to 2024
    • Absolute $ Opportunity Analysis By Product Type , 2025 to 2035
  7. Global Market Analysis 2020 to 2024 and Forecast 2025 to 2035, By Application
    • Introduction / Key Findings
    • Historical Market Size Value (USD Million) Analysis By Application, 2020 to 2024
    • Current and Future Market Size Value (USD Million) Analysis and Forecast By Application, 2025 to 2035
      • Industrial Automation
      • Power Systems
      • Smart Buildings
      • Medical Equipment
    • Y to o to Y Growth Trend Analysis By Application, 2020 to 2024
    • Absolute $ Opportunity Analysis By Application, 2025 to 2035
  8. Global Market Analysis 2020 to 2024 and Forecast 2025 to 2035, By Region
    • Introduction
    • Historical Market Size Value (USD Million) Analysis By Region, 2020 to 2024
    • Current Market Size Value (USD Million) Analysis and Forecast By Region, 2025 to 2035
      • North America
      • Latin America
      • Western Europe
      • Eastern Europe
      • East Asia
      • South Asia and Pacific
      • Middle East & Africa
    • Market Attractiveness Analysis By Region
  9. North America Market Analysis 2020 to 2024 and Forecast 2025 to 2035, By Country
    • Historical Market Size Value (USD Million) Trend Analysis By Market Taxonomy, 2020 to 2024
    • Market Size Value (USD Million) Forecast By Market Taxonomy, 2025 to 2035
      • By Country
        • USA
        • Canada
        • Mexico
      • By Product Type
      • By Application
    • Market Attractiveness Analysis
      • By Country
      • By Product Type
      • By Application
    • Key Takeaways
  10. Latin America Market Analysis 2020 to 2024 and Forecast 2025 to 2035, By Country
    • Historical Market Size Value (USD Million) Trend Analysis By Market Taxonomy, 2020 to 2024
    • Market Size Value (USD Million) Forecast By Market Taxonomy, 2025 to 2035
      • By Country
        • Brazil
        • Chile
        • Rest of Latin America
      • By Product Type
      • By Application
    • Market Attractiveness Analysis
      • By Country
      • By Product Type
      • By Application
    • Key Takeaways
  11. Western Europe Market Analysis 2020 to 2024 and Forecast 2025 to 2035, By Country
    • Historical Market Size Value (USD Million) Trend Analysis By Market Taxonomy, 2020 to 2024
    • Market Size Value (USD Million) Forecast By Market Taxonomy, 2025 to 2035
      • By Country
        • Germany
        • UK
        • Italy
        • Spain
        • France
        • Nordic
        • BENELUX
        • Rest of Western Europe
      • By Product Type
      • By Application
    • Market Attractiveness Analysis
      • By Country
      • By Product Type
      • By Application
    • Key Takeaways
  12. Eastern Europe Market Analysis 2020 to 2024 and Forecast 2025 to 2035, By Country
    • Historical Market Size Value (USD Million) Trend Analysis By Market Taxonomy, 2020 to 2024
    • Market Size Value (USD Million) Forecast By Market Taxonomy, 2025 to 2035
      • By Country
        • Russia
        • Poland
        • Hungary
        • Balkan & Baltic
        • Rest of Eastern Europe
      • By Product Type
      • By Application
    • Market Attractiveness Analysis
      • By Country
      • By Product Type
      • By Application
    • Key Takeaways
  13. East Asia Market Analysis 2020 to 2024 and Forecast 2025 to 2035, By Country
    • Historical Market Size Value (USD Million) Trend Analysis By Market Taxonomy, 2020 to 2024
    • Market Size Value (USD Million) Forecast By Market Taxonomy, 2025 to 2035
      • By Country
        • China
        • Japan
        • South Korea
      • By Product Type
      • By Application
    • Market Attractiveness Analysis
      • By Country
      • By Product Type
      • By Application
    • Key Takeaways
  14. South Asia and Pacific Market Analysis 2020 to 2024 and Forecast 2025 to 2035, By Country
    • Historical Market Size Value (USD Million) Trend Analysis By Market Taxonomy, 2020 to 2024
    • Market Size Value (USD Million) Forecast By Market Taxonomy, 2025 to 2035
      • By Country
        • India
        • ASEAN
        • Australia & New Zealand
        • Rest of South Asia and Pacific
      • By Product Type
      • By Application
    • Market Attractiveness Analysis
      • By Country
      • By Product Type
      • By Application
    • Key Takeaways
  15. Middle East & Africa Market Analysis 2020 to 2024 and Forecast 2025 to 2035, By Country
    • Historical Market Size Value (USD Million) Trend Analysis By Market Taxonomy, 2020 to 2024
    • Market Size Value (USD Million) Forecast By Market Taxonomy, 2025 to 2035
      • By Country
        • Kingdom of Saudi Arabia
        • Other GCC Countries
        • Turkiye
        • South Africa
        • Other African Union
        • Rest of Middle East & Africa
      • By Product Type
      • By Application
    • Market Attractiveness Analysis
      • By Country
      • By Product Type
      • By Application
    • Key Takeaways
  16. Key Countries Market Analysis
    • USA
      • Pricing Analysis
      • Market Share Analysis, 2024
        • By Product Type
        • By Application
    • Canada
      • Pricing Analysis
      • Market Share Analysis, 2024
        • By Product Type
        • By Application
    • Mexico
      • Pricing Analysis
      • Market Share Analysis, 2024
        • By Product Type
        • By Application
    • Brazil
      • Pricing Analysis
      • Market Share Analysis, 2024
        • By Product Type
        • By Application
    • Chile
      • Pricing Analysis
      • Market Share Analysis, 2024
        • By Product Type
        • By Application
    • Germany
      • Pricing Analysis
      • Market Share Analysis, 2024
        • By Product Type
        • By Application
    • UK
      • Pricing Analysis
      • Market Share Analysis, 2024
        • By Product Type
        • By Application
    • Italy
      • Pricing Analysis
      • Market Share Analysis, 2024
        • By Product Type
        • By Application
    • Spain
      • Pricing Analysis
      • Market Share Analysis, 2024
        • By Product Type
        • By Application
    • France
      • Pricing Analysis
      • Market Share Analysis, 2024
        • By Product Type
        • By Application
    • India
      • Pricing Analysis
      • Market Share Analysis, 2024
        • By Product Type
        • By Application
    • ASEAN
      • Pricing Analysis
      • Market Share Analysis, 2024
        • By Product Type
        • By Application
    • Australia & New Zealand
      • Pricing Analysis
      • Market Share Analysis, 2024
        • By Product Type
        • By Application
    • China
      • Pricing Analysis
      • Market Share Analysis, 2024
        • By Product Type
        • By Application
    • Japan
      • Pricing Analysis
      • Market Share Analysis, 2024
        • By Product Type
        • By Application
    • South Korea
      • Pricing Analysis
      • Market Share Analysis, 2024
        • By Product Type
        • By Application
    • Russia
      • Pricing Analysis
      • Market Share Analysis, 2024
        • By Product Type
        • By Application
    • Poland
      • Pricing Analysis
      • Market Share Analysis, 2024
        • By Product Type
        • By Application
    • Hungary
      • Pricing Analysis
      • Market Share Analysis, 2024
        • By Product Type
        • By Application
    • Kingdom of Saudi Arabia
      • Pricing Analysis
      • Market Share Analysis, 2024
        • By Product Type
        • By Application
    • Turkiye
      • Pricing Analysis
      • Market Share Analysis, 2024
        • By Product Type
        • By Application
    • South Africa
      • Pricing Analysis
      • Market Share Analysis, 2024
        • By Product Type
        • By Application
  17. Market Structure Analysis
    • Competition Dashboard
    • Competition Benchmarking
    • Market Share Analysis of Top Players
      • By Regional
      • By Product Type
      • By Application
  18. Competition Analysis
    • Competition Deep Dive
      • Nanjing Electric
        • Overview
        • Product Portfolio
        • Profitability by Market Segments (Product/Age /Sales Channel/Region)
        • Sales Footprint
        • Strategy Overview
          • Marketing Strategy
          • Product Strategy
          • Channel Strategy
      • Siemens
      • Gulf Security Technology
      • GE
      • ABB
      • MBS AG
      • Analog Devices
      • Iron Man Safety
      • Dowe
      • Mars RF
      • Acromag
      • Skyworks Solutions
      • NVE Corporation
  19. Assumptions & Acronyms Used
  20. Research Methodology

List of Tables

  • Table 1: Global Market Value (USD Million) Forecast by Region, 2020 to 2035
  • Table 2: Global Market Value (USD Million) Forecast by Product Type , 2020 to 2035
  • Table 3: Global Market Value (USD Million) Forecast by Application, 2020 to 2035
  • Table 4: North America Market Value (USD Million) Forecast by Country, 2020 to 2035
  • Table 5: North America Market Value (USD Million) Forecast by Product Type , 2020 to 2035
  • Table 6: North America Market Value (USD Million) Forecast by Application, 2020 to 2035
  • Table 7: Latin America Market Value (USD Million) Forecast by Country, 2020 to 2035
  • Table 8: Latin America Market Value (USD Million) Forecast by Product Type , 2020 to 2035
  • Table 9: Latin America Market Value (USD Million) Forecast by Application, 2020 to 2035
  • Table 10: Western Europe Market Value (USD Million) Forecast by Country, 2020 to 2035
  • Table 11: Western Europe Market Value (USD Million) Forecast by Product Type , 2020 to 2035
  • Table 12: Western Europe Market Value (USD Million) Forecast by Application, 2020 to 2035
  • Table 13: Eastern Europe Market Value (USD Million) Forecast by Country, 2020 to 2035
  • Table 14: Eastern Europe Market Value (USD Million) Forecast by Product Type , 2020 to 2035
  • Table 15: Eastern Europe Market Value (USD Million) Forecast by Application, 2020 to 2035
  • Table 16: East Asia Market Value (USD Million) Forecast by Country, 2020 to 2035
  • Table 17: East Asia Market Value (USD Million) Forecast by Product Type , 2020 to 2035
  • Table 18: East Asia Market Value (USD Million) Forecast by Application, 2020 to 2035
  • Table 19: South Asia and Pacific Market Value (USD Million) Forecast by Country, 2020 to 2035
  • Table 20: South Asia and Pacific Market Value (USD Million) Forecast by Product Type , 2020 to 2035
  • Table 21: South Asia and Pacific Market Value (USD Million) Forecast by Application, 2020 to 2035
  • Table 22: Middle East & Africa Market Value (USD Million) Forecast by Country, 2020 to 2035
  • Table 23: Middle East & Africa Market Value (USD Million) Forecast by Product Type , 2020 to 2035
  • Table 24: Middle East & Africa Market Value (USD Million) Forecast by Application, 2020 to 2035

List of Figures

  • Figure 1: Global Market Pricing Analysis
  • Figure 2: Global Market Value (USD Million) Forecast 2020-2035
  • Figure 3: Global Market Value Share and BPS Analysis by Product Type , 2025 and 2035
  • Figure 4: Global Market Y-o-Y Growth Comparison by Product Type , 2025-2035
  • Figure 5: Global Market Attractiveness Analysis by Product Type
  • Figure 6: Global Market Value Share and BPS Analysis by Application, 2025 and 2035
  • Figure 7: Global Market Y-o-Y Growth Comparison by Application, 2025-2035
  • Figure 8: Global Market Attractiveness Analysis by Application
  • Figure 9: Global Market Value (USD Million) Share and BPS Analysis by Region, 2025 and 2035
  • Figure 10: Global Market Y-o-Y Growth Comparison by Region, 2025-2035
  • Figure 11: Global Market Attractiveness Analysis by Region
  • Figure 12: North America Market Incremental Dollar Opportunity, 2025-2035
  • Figure 13: Latin America Market Incremental Dollar Opportunity, 2025-2035
  • Figure 14: Western Europe Market Incremental Dollar Opportunity, 2025-2035
  • Figure 15: Eastern Europe Market Incremental Dollar Opportunity, 2025-2035
  • Figure 16: East Asia Market Incremental Dollar Opportunity, 2025-2035
  • Figure 17: South Asia and Pacific Market Incremental Dollar Opportunity, 2025-2035
  • Figure 18: Middle East & Africa Market Incremental Dollar Opportunity, 2025-2035
  • Figure 19: North America Market Value Share and BPS Analysis by Country, 2025 and 2035
  • Figure 20: North America Market Value Share and BPS Analysis by Product Type , 2025 and 2035
  • Figure 21: North America Market Y-o-Y Growth Comparison by Product Type , 2025-2035
  • Figure 22: North America Market Attractiveness Analysis by Product Type
  • Figure 23: North America Market Value Share and BPS Analysis by Application, 2025 and 2035
  • Figure 24: North America Market Y-o-Y Growth Comparison by Application, 2025-2035
  • Figure 25: North America Market Attractiveness Analysis by Application
  • Figure 26: Latin America Market Value Share and BPS Analysis by Country, 2025 and 2035
  • Figure 27: Latin America Market Value Share and BPS Analysis by Product Type , 2025 and 2035
  • Figure 28: Latin America Market Y-o-Y Growth Comparison by Product Type , 2025-2035
  • Figure 29: Latin America Market Attractiveness Analysis by Product Type
  • Figure 30: Latin America Market Value Share and BPS Analysis by Application, 2025 and 2035
  • Figure 31: Latin America Market Y-o-Y Growth Comparison by Application, 2025-2035
  • Figure 32: Latin America Market Attractiveness Analysis by Application
  • Figure 33: Western Europe Market Value Share and BPS Analysis by Country, 2025 and 2035
  • Figure 34: Western Europe Market Value Share and BPS Analysis by Product Type , 2025 and 2035
  • Figure 35: Western Europe Market Y-o-Y Growth Comparison by Product Type , 2025-2035
  • Figure 36: Western Europe Market Attractiveness Analysis by Product Type
  • Figure 37: Western Europe Market Value Share and BPS Analysis by Application, 2025 and 2035
  • Figure 38: Western Europe Market Y-o-Y Growth Comparison by Application, 2025-2035
  • Figure 39: Western Europe Market Attractiveness Analysis by Application
  • Figure 40: Eastern Europe Market Value Share and BPS Analysis by Country, 2025 and 2035
  • Figure 41: Eastern Europe Market Value Share and BPS Analysis by Product Type , 2025 and 2035
  • Figure 42: Eastern Europe Market Y-o-Y Growth Comparison by Product Type , 2025-2035
  • Figure 43: Eastern Europe Market Attractiveness Analysis by Product Type
  • Figure 44: Eastern Europe Market Value Share and BPS Analysis by Application, 2025 and 2035
  • Figure 45: Eastern Europe Market Y-o-Y Growth Comparison by Application, 2025-2035
  • Figure 46: Eastern Europe Market Attractiveness Analysis by Application
  • Figure 47: East Asia Market Value Share and BPS Analysis by Country, 2025 and 2035
  • Figure 48: East Asia Market Value Share and BPS Analysis by Product Type , 2025 and 2035
  • Figure 49: East Asia Market Y-o-Y Growth Comparison by Product Type , 2025-2035
  • Figure 50: East Asia Market Attractiveness Analysis by Product Type
  • Figure 51: East Asia Market Value Share and BPS Analysis by Application, 2025 and 2035
  • Figure 52: East Asia Market Y-o-Y Growth Comparison by Application, 2025-2035
  • Figure 53: East Asia Market Attractiveness Analysis by Application
  • Figure 54: South Asia and Pacific Market Value Share and BPS Analysis by Country, 2025 and 2035
  • Figure 55: South Asia and Pacific Market Value Share and BPS Analysis by Product Type , 2025 and 2035
  • Figure 56: South Asia and Pacific Market Y-o-Y Growth Comparison by Product Type , 2025-2035
  • Figure 57: South Asia and Pacific Market Attractiveness Analysis by Product Type
  • Figure 58: South Asia and Pacific Market Value Share and BPS Analysis by Application, 2025 and 2035
  • Figure 59: South Asia and Pacific Market Y-o-Y Growth Comparison by Application, 2025-2035
  • Figure 60: South Asia and Pacific Market Attractiveness Analysis by Application
  • Figure 61: Middle East & Africa Market Value Share and BPS Analysis by Country, 2025 and 2035
  • Figure 62: Middle East & Africa Market Value Share and BPS Analysis by Product Type , 2025 and 2035
  • Figure 63: Middle East & Africa Market Y-o-Y Growth Comparison by Product Type , 2025-2035
  • Figure 64: Middle East & Africa Market Attractiveness Analysis by Product Type
  • Figure 65: Middle East & Africa Market Value Share and BPS Analysis by Application, 2025 and 2035
  • Figure 66: Middle East & Africa Market Y-o-Y Growth Comparison by Application, 2025-2035
  • Figure 67: Middle East & Africa Market Attractiveness Analysis by Application
  • Figure 68: Global Market - Tier Structure Analysis
  • Figure 69: Global Market - Company Share Analysis
Dashboard
Dashboard
Dashboard
Dashboard
Dashboard
Dashboard

Our Research Products

Full Research Suite

The "Full Research Suite" delivers actionable market intel, deep dives on markets or technologies, so clients act faster, cut risk, and unlock growth.

Competitor Leaderboard Report

The Leaderboard benchmarks and ranks top vendors, classifying them as Established Leaders, Leading Challengers, or Disruptors & Challengers.

Future Leaders Index

Locates where complements amplify value and substitutes erode it, forecasting net impact by horizon

Market Data & Forecasts

We deliver granular, decision-grade intel: market sizing, 5-year forecasts, pricing, adoption, usage, revenue, and operational KPIs—plus competitor tracking, regulation, and value chains—across 60 countries broadly.

Market Focus Report

Spot the shifts before they hit your P&L. We track inflection points, adoption curves, pricing moves, and ecosystem plays to show where demand is heading, why it is changing, and what to do next across high-growth markets and disruptive tech

Survey Report

Real-time reads of user behavior. We track shifting priorities, perceptions of today’s and next-gen services, and provider experience, then pace how fast tech moves from trial to adoption, blending buyer, consumer, and channel inputs with social signals (#WhySwitch, #UX).

Bespoke Reports

Partner with our analyst team to build a custom report designed around your business priorities. From analysing market trends to assessing competitors or crafting bespoke datasets, we tailor insights to your needs.

Supplier Intelligence

Discovery & Profiling

Capacity & Footprint

Performance & Risk

Compliance & Governance

Commercial Readiness

Who Supplies Whom

Scorecards & Shortlists

Playbooks & Docs

Category Intelligence

Definition & Scope

Demand & Use Cases

Cost Drivers

Market Structure

Supply Chain Map

Trade & Policy

Operating Norms

Deliverables

Buyer Intelligence

Account Basics

Spend & Scope

Procurement Model

Vendor Requirements

Terms & Policies

Entry Strategy

Pain Points & Triggers

Outputs

Pricing Analysis

Benchmarks

Trends

Should-Cost

Indexation

Landed Cost

Commercial Terms

Deliverables

Brand Analysis

Positioning & Value Prop

Share & Presence

Customer Evidence

Go-to-Market

Digital & Reputation

Compliance & Trust

KPIs & Gaps

Outputs

Full Research Suite comprises of:

Market outlook & trends analysis

Market outlook & trends analysis

Interviews & case studies

Interviews & case studies

Strategic recommendations

Strategic recommendations

Vendor profiles & capabilities analysis

Vendor profiles & capabilities analysis

5-year forecasts

5-year forecasts

8 regions and 60+ country-level data splits

8 regions and 60+ country-level data splits

Market segment data splits

Market segment data splits

12 months of continuous data updates

12 months of continuous data updates

DELIVERED AS:

PDF EXCEL ONLINE

Full Research Suite


$5000

$7500

$10000

Buy Report Now
Similar Industry Reports

Similar Industry Reports

Busbar for Industrial Market

Busbar for Industrial Market Size and Share Forecast Outlook 2025 to 2035

Busbars Market
Busbars Market

Busbars Market Size and Share Forecast Outlook 2025 to 2035

Business Jet Market
Business Jet Market

Business Jet Market Size and Share Forecast Outlook 2025 to 2035

Business Storage Units Market

Business Storage Units Market Size and Share Forecast Outlook 2025 to 2035

Business as a Service Market

Business as a Service Market Size and Share Forecast Outlook 2025 to 2035

Business Cloud VoIP & UC Services Market

Business Cloud VoIP & UC Services Market Size and Share Forecast Outlook 2025 to 2035

Business Intelligence Market

Business Intelligence Market Size and Share Forecast Outlook 2025 to 2035

Business Process Automation (BPA) Market

Business Process Automation (BPA) Market Size and Share Forecast Outlook 2025 to 2035

Business Analytics BPO Services Market

Business Analytics BPO Services Market Analysis – Size, Share & Forecast 2025 to 2035 

Business Value Dashboard Market

Business Value Dashboard Market Size and Share Forecast Outlook 2025 to 2035

Bus Flooring Market
Bus Flooring Market

Bus Flooring Market Growth – Trends & Forecast 2025 to 2035

Bus Bellows Market
Bus Bellows Market

Bus Bellows Market Insights – Growth & Forecast 2025 to 2035

Business Email Market

Business Email Market Analysis by Channel, Deployment, and Region Through 2035

Business Process as a Service (BPaaS) Market

Business Process as a Service (BPaaS) Market Analysis by Process and Region Through 2035

Business Analytics BPO Services Market Share Analysis

Competitive Overview of Business Analytics BPO Services Companies

Business Card Holder Market

Business Card Holder Market from 2024 to 2034

Business Analytics BPO Services Industry Analysis in Western Europe

Business Analytics BPO Services Market Growth – Trends & Forecast 2023-2033

Business Analytics BPO Services Industry Analysis in Korea

Business Analytics BPO Services Market Growth – Trends & Forecast 2023-2033

Business Analytics BPO Services Industry Analysis in Japan

Business Analytics BPO Services Market Growth – Trends & Forecast 2023-2033

Bus Chassis Market
Bus Chassis Market

Bus Chassis Market

Future Market Insights

Bus Isolator Market

Chat With MaRIA

Chat With

MaRIA

Hi There, I am MaRIA, Your Market Research Intelligence Assistant. How may I help you?