The busbar for industrial market is valued at USD 17.7 billion in 2025 and is projected to reach USD 28.6 billion by 2035 at a CAGR of 4.9%, creating USD 10.9 billion in new value over the period. Demand rises as factories, process industries, and large commercial facilities require efficient, compact, and low-loss power distribution systems capable of supporting higher electrical loads. Copper busbars lead with a 65% share due to high conductivity and stable performance in heavy duty environments, while aluminum variants hold relevance for cost sensitive installations.
Power distribution in factories represents 35% of overall usage, reflecting the dependence of automated production lines, MCCs, and switchgear assemblies on durable and heat-resistant current-carrying components. Growth is influenced by the expansion of industrial automation, wider electrification of process industries, and increased deployment of renewable and distributed energy systems that require reliable busbar integration. China grows at 6.6%, India at 6.1%, and Germany at 5.6%, supported by manufacturing expansion and electrical infrastructure upgrades, while Brazil records 5.1%, the United States posts 4.7%, the United Kingdom 4.2%, and Japan 3.7%.
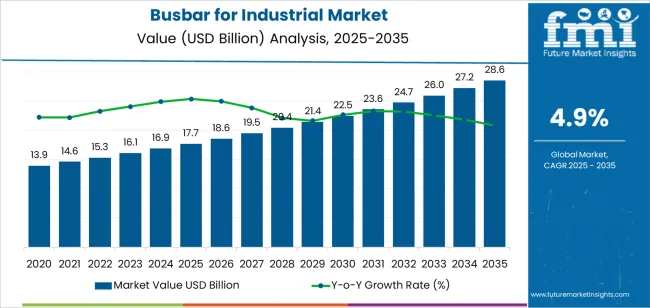
From 2025 to 2030, the market is expected to grow from USD 17.7 billion to USD 22.5 billion, an increase of USD 4.8 billion. This growth will be driven by the expanding industrial infrastructure, the rise in manufacturing activities, and the increasing demand for energy-efficient power distribution systems. The growing integration of smart technologies and renewable energy sources into industrial facilities will also contribute to this growth, pushing the demand for advanced busbar systems that can handle high electrical loads efficiently.
Between 2030 and 2035, the market will continue to expand from USD 22.5 billion to USD 28.6 billion, adding USD 6.1 billion in value. The demand for busbars will be further supported by the increasing adoption of electrification and automation in industrial processes. Additionally, the continued rise of urbanization, industrial modernization, and the integration of green energy solutions will push for more advanced and durable electrical distribution systems, positioning busbars as key enablers of energy-efficient industrial operations.
| Metric | Value |
|---|---|
| Market Value (2025) | USD 17.7 billion |
| Market Forecast Value (2035) | USD 28.6 billion |
| Forecast CAGR (2025-2035) | 4.9% |
The busbar for industrial market is growing due to the increasing demand for efficient power distribution systems in industrial settings, particularly in factories, switchgear and control panels, and motor control centers. Busbars are critical components in electrical systems, offering high current capacity and reliable power distribution. The rising demand for energy-efficient solutions, coupled with the industrial expansion and electrification of industries, is accelerating market growth. Additionally, smart manufacturing and automation systems require enhanced power distribution, further driving the adoption of busbars, especially copper busbars, due to their superior conductivity.
The demand for high-quality materials like copper and aluminum in busbar systems continues to increase as industries look for solutions that provide high performance, reliability, and safety in power management. Government regulations around energy efficiency, safety standards, and electrical infrastructure upgrades are contributing to market growth. As industrial sectors, including manufacturing, mining, oil & gas, and automotive, continue to expand, the need for robust and efficient power distribution systems will continue to drive demand for busbar systems.
The busbar for industrial market is segmented by classification and application. By classification, the market is divided into copper busbars, aluminum busbars, and other materials, with copper busbars holding the largest share, accounting for 65% of the market. By application, the market is divided into power distribution in factories, switchgear and control panels, motor control centers (MCCs), and other applications, with power distribution in factories being the leading segment, capturing 35% of the market share. This segmentation highlights the crucial role of busbars in efficient power distribution and electrical safety across various industries globally, particularly in emerging markets such as China and India, as well as mature markets like Germany and the USA.
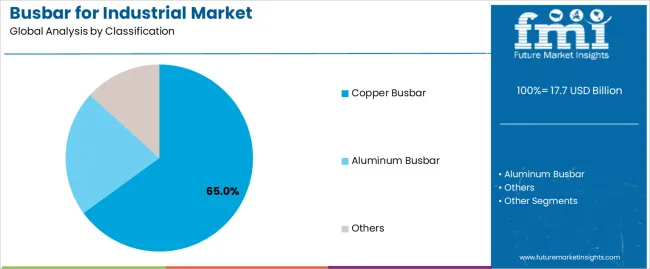
The copper busbar segment leads the busbar for industrial market, holding 65% of the total share. Copper’s superior conductivity and reliability in high-power applications make it the preferred choice for power distribution in various industrial sectors. Copper busbars are widely used in factories, power plants, industrial automation, and electric vehicle (EV) infrastructure due to their ability to handle high currents and prevent energy loss. In high-voltage systems, copper’s low electrical resistance ensures better performance, contributing to energy efficiency and long-term reliability.
The dominant market share of copper busbars is driven by industries' preference for high-performance, durable materials in mission-critical applications. In switchgear panels and motor control centers (MCCs), copper busbars provide reliable electrical connections with minimal maintenance. Copper's thermal conductivity also helps in dissipating heat generated by high current flow, preventing overheating and potential damage to electrical systems. While aluminum busbars offer a more cost-effective solution, copper’s performance, reliability, and long lifespan make it the material of choice for high-demand industrial applications. As industries continue to focus on energy efficiency, safety standards, and automation, the copper busbar segment is expected to maintain its market leadership.
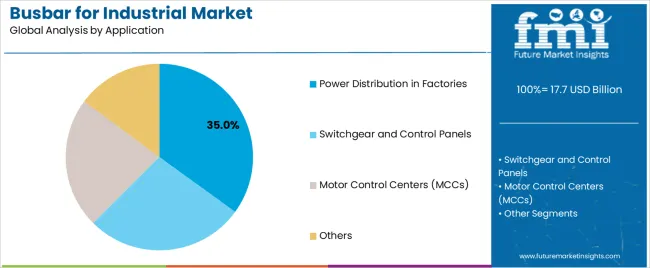
The power distribution in factories segment holds the largest share in the busbar for industrial market, accounting for 35% of the total market share. The growing demand for reliable power distribution systems in industrial environments is a key driver for this segment’s dominance. As industrial sectors expand and modernize, the need for efficient and durable electrical systems becomes critical, especially for manufacturing plants and automation lines that require constant and stable power. Busbars are essential in factory power distribution because they offer high current capacity, easy installation, and low maintenance compared to traditional wiring.
Factory power distribution is crucial in industrial automation, where reliable electrical supply ensures the smooth operation of machines, robotics, and control systems. In factories, copper busbars are particularly favored because of their conductivity and resistance to corrosion, ensuring that electrical systems operate at maximum efficiency with minimal downtime. The rise of smart manufacturing and IoT-enabled systems further boosts the demand for advanced busbar systems to support automated systems and reduce energy loss. As industries continue to invest in energy-efficient infrastructure and electrical safety, the demand for busbars in factory power distribution will continue to grow, cementing its position as the leading application in the market.
The busbar for industrial market is growing due to the increasing need for efficient power distribution systems in factories, smart buildings, and industrial automation. The demand for reliable electrical infrastructure, safety standards, and energy efficiency is pushing the adoption of busbar systems across various industries. The market is also being driven by industrial expansion, government regulations promoting electrical safety, and the rise of smart manufacturing and renewable energy solutions. As industries evolve and upgrade their electrical systems, busbars remain integral to efficient power management.
The main drivers of the busbar for industrial market include the growth of industrial automation, electrification of industries, and the rising need for energy-efficient power management. As factories and manufacturing plants increasingly implement automated systems, reliable and efficient power distribution becomes crucial to ensure smooth operations. Smart buildings and renewable energy projects are also contributing to demand for busbars, particularly in power distribution and switchgear systems.
The increasing adoption of electric vehicles (EVs) and electric vehicle infrastructure is another key factor, as busbars are necessary for efficient power flow in charging stations and battery management systems. Additionally, regulatory compliance around safety standards and electrical infrastructure continues to spur the adoption of high-quality busbars that can ensure safety, reliability, and optimal performance in high-demand environments.
Despite strong growth, the busbar for industrial market faces certain restraints. The high cost of materials, particularly copper, which is the preferred choice for power distribution in high-demand sectors, can hinder adoption, especially in price-sensitive markets. Aluminum busbars, while more cost-effective, do not offer the same performance, limiting their adoption in applications that require high conductivity and reliability.
The complexity of installation and maintenance in older infrastructure and the longer lead times for customized solutions are additional challenges. Additionally, the lack of awareness in emerging markets about the benefits of advanced busbar systems may slow adoption in some regions, affecting overall market growth. Companies may also face difficulties in meeting international standards for safety and electrical protection in regions with varying regulatory frameworks.
Key trends in the busbar for industrial market include the shift toward smart manufacturing, where IoT-enabled busbars are used for real-time monitoring and fault detection. As industries move toward energy-efficient solutions, there is increasing demand for busbar systems that provide sustainable and low-maintenance options. The trend of miniaturization is also gaining traction, with smaller, more compact busbar solutions being developed to fit into smart grid systems, electric vehicle charging stations, and automated factories.
Additionally, there is a growing focus on eco-friendly materials and sustainable manufacturing practices, which is influencing the development of recyclable busbar solutions. As the demand for high-performance power systems grows, manufacturers are focusing on creating durable, reliable, and low-cost solutions that cater to evolving industrial needs and comply with stringent regulations.
The busbar for industrial market is witnessing diverse growth across global regions, with significant demand in both emerging and developed markets. Countries such as China and India are showing the highest growth rates due to rapid industrialization, expansion in infrastructure, and adoption of smart manufacturing technologies. On the other hand, developed economies like Germany, the USA, and the UK are seeing steady growth driven by safety regulations, industrial modernization, and demand for energy-efficient solutions in power distribution systems. The busbar market is shaped by factors like regulatory compliance, energy efficiency, and increasing investments in renewable energy and electrification.
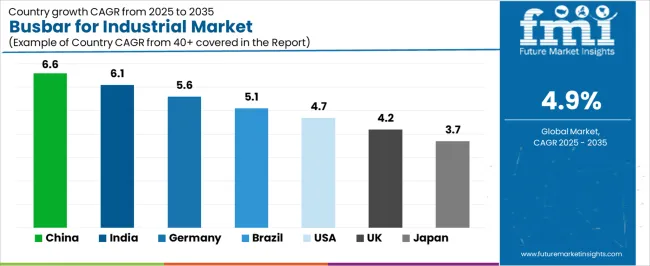
| Country | CAGR (2025-2035) |
|---|---|
| China | 6.6% |
| India | 6.1% |
| Germany | 5.6% |
| Brazil | 5.1% |
| USA | 4.7% |
| UK | 4.2% |
| Japan | 3.7% |
China is projected to grow at a CAGR of 6.6% in the busbar for industrial market. The country’s rapid industrialization, infrastructure development, and smart manufacturing adoption are driving the demand for efficient and reliable power distribution systems, particularly copper busbars. With significant expansion in energy systems, industrial automation, and the electric vehicle market, China’s need for high-performance busbars to manage high current loads is growing.
Smart factories and IoT integration in manufacturing systems further contribute to the demand for advanced power distribution solutions. China’s government-led initiatives in promoting renewable energy and upgrading electrical infrastructure are expected to continue fueling the demand for busbars. The integration of clean energy projects, along with increasing safety standards and electrical compliance regulations, further propels the market. As the largest manufacturing hub in the world, China’s market dominance is expected to remain strong, driving the global demand for busbar systems, especially in industrial and energy applications.
India is expected to grow at a CAGR of 6.1% in the busbar for industrial market. The country's expanding industrial base and rapid urbanization are key drivers of this growth. India’s push toward industrial automation, renewable energy adoption, and smart building technologies significantly boosts demand for efficient power distribution systems. As Indian industries modernize and upgrade their infrastructure, the need for copper and aluminum busbars to ensure safe and reliable electrical systems becomes increasingly important.
The Indian government’s focus on infrastructure projects, including smart cities and electric vehicle infrastructure, is pushing the market for high-capacity busbar systems that can handle increased demand. Additionally, the rise of power distribution systems in both residential and commercial buildings has heightened the need for reliable circuit protection solutions like busbars. With continuous efforts in industrial development, regulatory changes to enforce electrical safety standards, and increasing demand for energy-efficient systems, India remains a growing market for busbar solutions.
Germany is projected to grow at a CAGR of 5.6% in the busbar for industrial market. As one of Europe’s most industrialized countries, Germany's demand for busbars is driven by its advanced manufacturing capabilities, energy efficiency standards, and focus on electrical safety. The need for reliable power distribution systems in factories, energy infrastructure, and automated systems is leading to significant adoption of copper busbars in high-performance applications.
The expansion of renewable energy projects, coupled with Germany's transition to electric vehicles and smart factory systems, is further propelling the busbar market. With Germany’s strong regulatory frameworks, particularly around fire protection and power distribution in industrial plants, the demand for busbars that ensure both safety and reliability is growing. Industrial automation and smart buildings are expected to drive continued demand for energy-efficient busbar systems in the coming years. Germany’s leading role in sustainability and green technologies will also contribute to the continued growth of the busbar market.
Brazil is projected to grow at a CAGR of 5.1% in the busbar for industrial market. This growth is attributed to Brazil’s increasing investment in infrastructure development, industrial automation, and renewable energy solutions. As Brazil’s industrial base grows, there is a rising demand for power distribution systems that can handle high currents and ensure reliable electrical performance. Brazil's industrial and commercial sectors are modernizing to comply with global safety standards, making the adoption of busbar systems essential.
Additionally, the expansion of the automotive and mining industries in Brazil requires advanced electrical infrastructure that incorporates high-performance busbars for power transmission and circuit protection. The demand for energy-efficient solutions in Brazil, driven by both government initiatives and private sector investments, is another key factor supporting the growth of the busbar market. With the rise of smart manufacturing and energy-efficient buildings, Brazil remains a prominent player in the South American market for busbars.
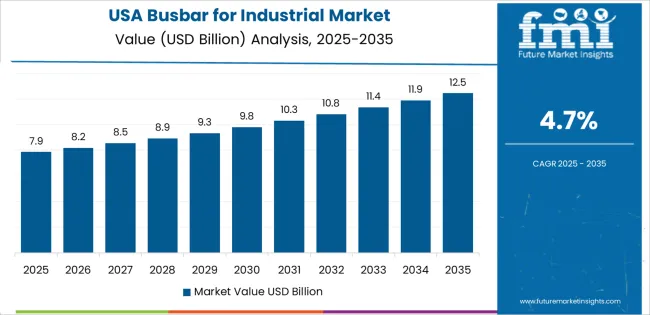
The USA is expected to grow at a CAGR of 4.7% in the busbar for industrial market. The demand for busbars in the USA is largely driven by the advancement of industrial infrastructure, the growth of renewable energy projects, and the rising adoption of smart grid technologies. As industrial automation and smart factories continue to proliferate, the need for high-efficiency power distribution systems is increasing. The USA market for busbars is further supported by infrastructure upgrades, especially in power systems, manufacturing plants, and electric vehicle charging stations.
Energy efficiency initiatives and government regulations around electrical safety also contribute to the growing demand for reliable power management systems. Additionally, as the USA pushes towards greener technologies and clean energy, the need for busbars in power distribution systems will continue to rise. With global technological leadership and continued emphasis on sustainability, the USA remains a key market in the global busbar industry.
The UK is projected to grow at a CAGR of 4.2% in the busbar for industrial market, driven by its focus on smart buildings, renewable energy, and energy efficiency in industrial automation. The UK government’s push toward sustainable energy solutions, green building initiatives, and industrial upgrades has led to growing demand for busbars in power distribution systems. As the manufacturing and commercial sectors shift toward automated systems, the need for reliable power systems becomes more critical.
Furthermore, the UK’s continued investment in smart infrastructure and electric vehicle charging systems is fueling the demand for high-performance busbars to ensure safe and efficient energy distribution. With regulatory frameworks prioritizing electrical safety and energy optimization, the UK is positioned to remain an important market in Europe. The demand for smart grid solutions and sustainable technologies will continue to drive the busbar market forward in the UK
Japan is expected to grow at a CAGR of 3.7% in the busbar for industrial market. As a leader in industrial automation, advanced manufacturing technologies, and electric vehicle infrastructure, Japan’s demand for busbars continues to rise. Japan’s focus on high-reliability and efficiency in its industrial sectors drives the adoption of copper busbars, particularly in power distribution systems for smart factories and robotic systems.
Additionally, Japan’s strong commitment to renewable energy solutions and electric mobility ensures sustained growth in busbar solutions. With technological advancements and a high standard of safety in electrical systems, Japan remains an essential player in the global busbar market. Though growth is slower compared to emerging economies, Japan's market remains strong, driven by its emphasis on precision engineering and energy-efficient solutions.
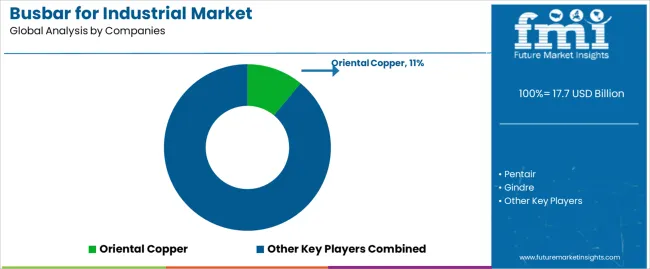
The busbar for industrial market is competitive, with several key global and regional players shaping the market landscape. Companies like Oriental Copper, Schneider Electric, and Pentair dominate the market, offering high-quality copper and aluminum busbars for industrial applications. These companies are well-established and benefit from strong relationships with major industries, particularly in power distribution, industrial automation, and renewable energy sectors. With the increasing demand for energy-efficient solutions and smart manufacturing, these players continue to innovate, offering advanced busbar systems that meet the growing requirements of industrial safety, reliability, and sustainability.
Additionally, smaller players such as Luvata and Baotai are contributing to the market by offering more cost-effective solutions, primarily targeting local markets and niche applications. These companies are particularly active in developing regions, where cost efficiency and ease of installation are key considerations. The growing adoption of smart grid technologies and the rise of electric vehicle infrastructure are opening new opportunities for both established players and emerging competitors. The competitive environment is also shaped by strategic partnerships, technology advancements, and supply chain dynamics, ensuring the market remains vibrant and continues to meet the evolving needs of industrial customers.
| Items | Details |
|---|---|
| Quantitative Units | USD Billion |
| Regions Covered | China, India, Germany, Brazil, USA, UK, Japan |
| Classification | Copper Busbar, Aluminum Busbar, Others |
| Application | Power Distribution in Factories, Switchgear and Control Panels, Motor Control Centers (MCCs), Others |
| Key Companies Profiled | Oriental Copper, Pentair, Gindre, Schneider, Watteredge, Luvata, Baotai, Metal Gems, Gonda Metal, EMS, Storm Power Components |
| Additional Attributes | The market analysis includes dollar sales by classification and application categories. It also covers regional adoption trends across major markets such as China, India, Germany, and the USA. The competitive landscape highlights key manufacturers in the busbar industry, focusing on innovations in copper and aluminum busbar technologies. Trends in the demand for busbars in power distribution, switchgear, control panels, and motor control centers are explored, along with advancements in energy efficiency and industrial automation. |
The global busbar for industrial market is estimated to be valued at USD 17.7 billion in 2025.
The market size for the busbar for industrial market is projected to reach USD 28.6 billion by 2035.
The busbar for industrial market is expected to grow at a 4.9% CAGR between 2025 and 2035.
The key product types in busbar for industrial market are copper busbar, aluminum busbar and others.
In terms of application, power distribution in factories segment to command 35.0% share in the busbar for industrial market in 2025.


Our Research Products

The "Full Research Suite" delivers actionable market intel, deep dives on markets or technologies, so clients act faster, cut risk, and unlock growth.

The Leaderboard benchmarks and ranks top vendors, classifying them as Established Leaders, Leading Challengers, or Disruptors & Challengers.

Locates where complements amplify value and substitutes erode it, forecasting net impact by horizon

We deliver granular, decision-grade intel: market sizing, 5-year forecasts, pricing, adoption, usage, revenue, and operational KPIs—plus competitor tracking, regulation, and value chains—across 60 countries broadly.

Spot the shifts before they hit your P&L. We track inflection points, adoption curves, pricing moves, and ecosystem plays to show where demand is heading, why it is changing, and what to do next across high-growth markets and disruptive tech

Real-time reads of user behavior. We track shifting priorities, perceptions of today’s and next-gen services, and provider experience, then pace how fast tech moves from trial to adoption, blending buyer, consumer, and channel inputs with social signals (#WhySwitch, #UX).

Partner with our analyst team to build a custom report designed around your business priorities. From analysing market trends to assessing competitors or crafting bespoke datasets, we tailor insights to your needs.
Supplier Intelligence
Discovery & Profiling
Capacity & Footprint
Performance & Risk
Compliance & Governance
Commercial Readiness
Who Supplies Whom
Scorecards & Shortlists
Playbooks & Docs
Category Intelligence
Definition & Scope
Demand & Use Cases
Cost Drivers
Market Structure
Supply Chain Map
Trade & Policy
Operating Norms
Deliverables
Buyer Intelligence
Account Basics
Spend & Scope
Procurement Model
Vendor Requirements
Terms & Policies
Entry Strategy
Pain Points & Triggers
Outputs
Pricing Analysis
Benchmarks
Trends
Should-Cost
Indexation
Landed Cost
Commercial Terms
Deliverables
Brand Analysis
Positioning & Value Prop
Share & Presence
Customer Evidence
Go-to-Market
Digital & Reputation
Compliance & Trust
KPIs & Gaps
Outputs
Full Research Suite comprises of:
Market outlook & trends analysis
Interviews & case studies
Strategic recommendations
Vendor profiles & capabilities analysis
5-year forecasts
8 regions and 60+ country-level data splits
Market segment data splits
12 months of continuous data updates
DELIVERED AS:
PDF EXCEL ONLINE
Busbars Market Size and Share Forecast Outlook 2025 to 2035
Laminated Busbar Market Forecast and Outlook 2025 to 2035
Fork Over Stacker Market Size and Share Forecast Outlook 2025 to 2035
Formaldehyde Removal Air Purifier Market Size and Share Forecast Outlook 2025 to 2035
Fortified Dairy Products Market Size and Share Forecast Outlook 2025 to 2035
Form-Fill-Seal (FFS) Films Market Size and Share Forecast Outlook 2025 to 2035
Formable Films Market Size and Share Forecast Outlook 2025 to 2035
Forchlorfenuron Market Size and Share Forecast Outlook 2025 to 2035
Formalin Market Size and Share Forecast Outlook 2025 to 2035
Formalin Vials Market Size and Share Forecast Outlook 2025 to 2035
Foreign Trade Digital Service Market Size and Share Forecast Outlook 2025 to 2035
Forged and Casting Component Market Size and Share Forecast Outlook 2025 to 2035
Fortified Rice Market Size and Share Forecast Outlook 2025 to 2035
Fortifying Agent Market Size and Share Forecast Outlook 2025 to 2035
Forestry Equipment Market Size and Share Forecast Outlook 2025 to 2035
Forensic Imaging Market Size and Share Forecast Outlook 2025 to 2035
Forklift Battery Market Size and Share Forecast Outlook 2025 to 2035
Formulation Development Outsourcing Market Size and Share Forecast Outlook 2025 to 2035
Forskolin Market Size and Share Forecast Outlook 2025 to 2035
Fortified Milk and Milk Products Market Analysis - Size, Share, & Forecast Outlook 2025 to 2035

Thank you!
You will receive an email from our Business Development Manager. Please be sure to check your SPAM/JUNK folder too.
Chat With
MaRIA