

- Market Size (2026)
- USD 2860.0 Mn
- Forecast (2036)
- USD 5268.6 Mn
- CAGR (2026 to 2036)
- 6.3%
How big is the Calf Rearing Solutions Market in 2026?
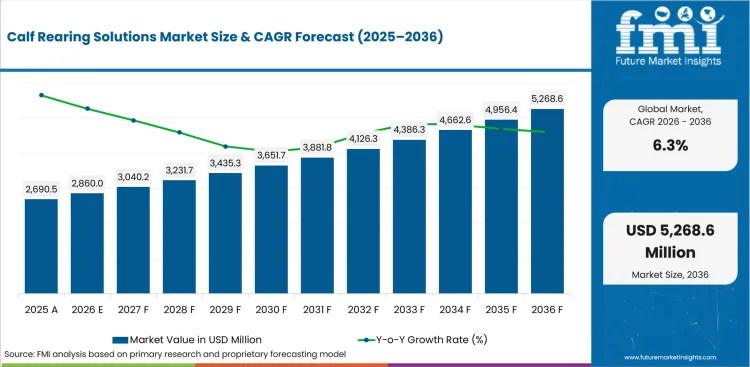
USD 2,860.0 million in 2026 and USD 5,268.6 million by 2036 at a 6.3% CAGR.
The calf rearing solutions market was valued at USD 2,690.5 million in 2025, driven by early-life nutrition control and replacement-heifer planning. It is forecast to increase from USD 2,860.0 million in 2026 to USD 5,268.6 million by 2036 at 6.3% CAGR. Early-life calf management is becoming a measured farm performance issue rather than a loose supply purchase. In January 2026, USDA NASS reported a USA calf crop of 32.9 million head for 2025. The herd scale is expected to raise pressure for repeatable milk delivery and recordable health routines. Dairy operators comparing animal feed additives outlook alongside calf-specific products are likely to favor programs that reduce manual dosing errors and daily observation gaps.
Dairy farms and calf growers are expected to anchor purchases due to labor limits and replacement-heifer quality pressure. USDA ERS reported in February 2026 that USA milk output now exceeds 231 billion pounds per year. The productivity base is expected to increase the value of young-stock consistency before first calving. Nutrition teams reviewing calf milk replacer demand are likely to compare starter intake and sanitation routines before expanding vendor accounts.
The purchase chain runs from colostrum handling into weaning records and then replacement-heifer planning. Established dairy markets are projected to weight protocol proof and service training before expanding vendor lists. Higher-growth markets are likely to weight dealer availability and product access during first account expansion. Calf programs linked to precision livestock farming tools are expected to gain attention on farms that need faster group monitoring. Procurement teams must decide whether vendors support nutrition equipment and farm training under one service model.
| Metric | Value |
|---|---|
| 2025 Market Size | USD 2,690.5 million |
| 2026 Market Size | USD 2,860.0 million |
| 2036 Market Size | USD 5,268.6 million |
| Forecast CAGR (2026-2036) | 6.3% |
| Solution Type Focus | Calf milk replacers |
| Calf milk replacers Share (2026) | 42.0% |
| Product Format Focus | Powdered products |
| Powdered Products Share (2026) | 48.0% |
| Farm Type Focus | Dairy farms |
| Dairy Farms Share (2026) | 55.0% |
| Key Countries | USA, Germany, France, UK |
Summary of the Calf Rearing Solutions Market
| Market Signal | Commercial Impact |
|---|---|
| Demand and Growth Drivers | Early-life nutrition control is poised to move spending toward documented feeding routines. Labor limits are also expected to raise demand for service-backed systems that reduce daily variation.
|
| Product and Segment View | Calf milk replacers, powdered products and dairy farms are anticipated to lead their respective categories in 2026. Direct farm sales are likely to remain visible in accounts that depend on service instructions and follow-up visits.
|
| Geography and Growth Outlook | India and China are set to form the higher-growth tier due to dairy output expansion and farm modernization. Established dairy markets are projected to grow around calf-health records and service discipline.
|
| Competitive Landscape | Competition is moderately concentrated around animal nutrition groups and dairy-equipment specialists. Farm procurement screening centers on product proof and dealer service before farms review training support.
|
| Analyst Perspective | Adoption is expected to move from product performance claims to field-verified execution proof. Farms are likely to retain suppliers that can translate calf nutrition and equipment programs into stable daily routines, cleaner records and fewer protocol gaps.
|
How is the Calf Rearing Solutions Market segmented?
The calf rearing solutions industry is segmented by solution type, product format, calf age group, farm type, sales channel, and region.
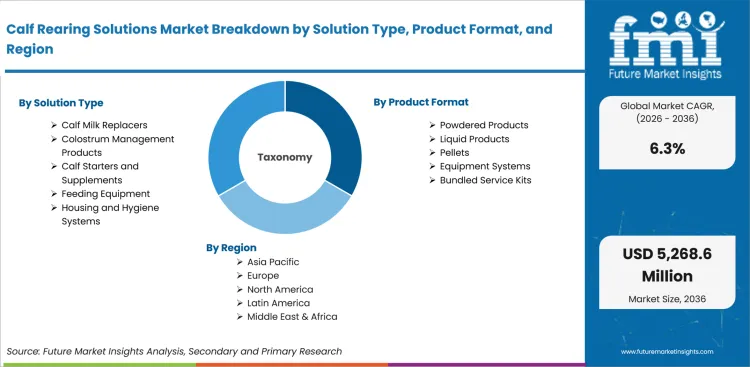
The calf rearing solutions market is segmented by solution type, product format, calf age group, farm type, sales channel, and region. By solution type, the market covers calf milk replacers, colostrum management products, calf starters and supplements, feeding equipment, and housing and hygiene systems. By product format, it covers powdered products, liquid products, pellets, equipment systems, and bundled service kits. By calf age group, it covers newborn calves, pre-weaned calves, weaned calves, replacement heifers, and beef calves. By farm type, it covers dairy farms, beef operations, mixed farms, contract calf growers, and veterinary or dealer accounts. Regional coverage includes North America, Europe, East Asia, South Asia, and Latin America linked to functional milk replacers analysis.
How do calf milk replacers shape demand within the solution type category?
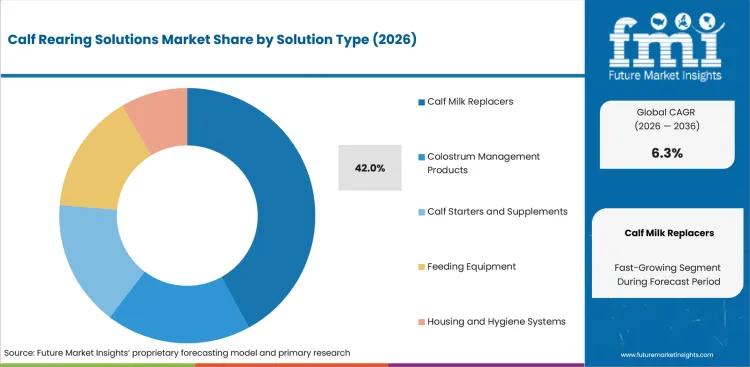
Milk replacer choice affects daily calf feeding more directly than most support products used in young-stock programs. Farms need predictable mixing and repeatable nutrient delivery during the pre-weaning period inside busy calf barns. In January 2026, USDA NASS reported 13.8 million cattle on feed across the United States. The herd base supports careful review of milk replacer programs that protect replacement-heifer quality and daily barn execution.
- Calf milk replacers are projected to account for 42.0% of solution type demand in 2026 driven by their role in controlled pre-weaning nutrition. USDA ERS reported in January 2026 that five states produced more than 65% of USA milk supply in 2024. Concentrated dairy regions therefore create larger service accounts for repeatable feeding programs during scale-up.
- Demand for calf milk replacers is expected to grow among dairy farms attributable to the need for controlled feeding during early growth. USDA ERS reported in February 2026 that USA milk cows peaked at 9.49 million head in 2025. Farm teams are expected to compare nutrient density and solubility before they review training support for repeat orders.
What supports powdered products within product format decisions?
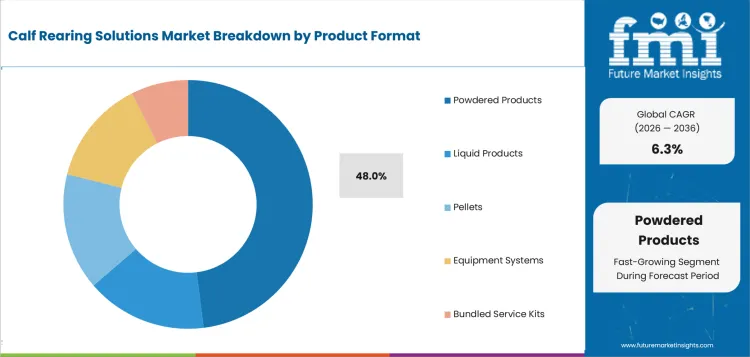
Format selection is a storage and labor decision for farms that mix calf feed under time pressure. Powdered products fit dealer inventories and allow ration adjustment without immediate changes to feeding equipment. In November 2024, Förster-Technik released product catalog materials covering automatic calf feeding systems for young-stock barns. The update supports farm interest in formats that integrate into practical feeding routines during repeat ordering cycles.
- Powdered products are estimated to hold 48.0% of product format demand in 2026 owing to shelf stability and mixing familiarity. In January 2026, USDA NASS reported the 2025 USA calf crop was down 2% from the prior year. Lower calf availability increases scrutiny of measured feeding and waste control before pre-weaning plans begin.
- Calf growers are increasingly purchasing powdered products led by the need for predictable mixing and easier stock control. Förster-Technik stated in November 2024 that COMPACT Connect supports smaller calf herds in automatic feeding. Farm teams connected to feed premix programs are likely to prefer formats that reduce spoilage risk and simplify dealer replenishment.
How are pre-weaned calves positioned within the calf age group category?
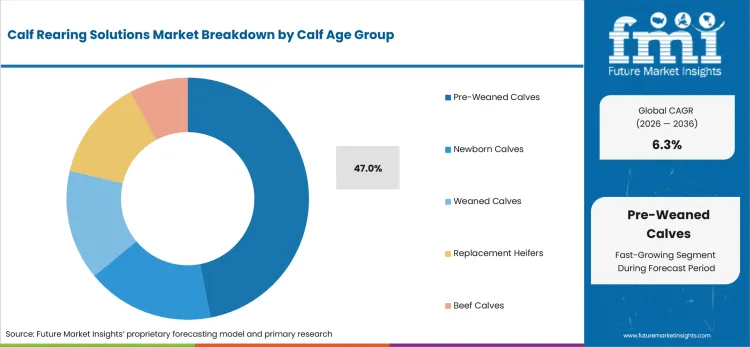
Pre-weaned calves create a narrow management window where nutrition errors appear before weaning targets are reached. Farms monitor milk intake and starter-feed transition during this period under tighter health review. USDA ERS reported in March 2025 that USA cattle inventories were expected to reach 86 million head in 2025. The cattle-cycle pressure supports tighter young-stock management during herd planning cycles before expansion decisions.
- Pre-weaned calves are forecast to represent 47.0% of calf age group demand in 2026 supported by early-life risk control. In April 2026, Statistics Korea reported Korean native cattle and beef cattle totaled 3.2 million in the first quarter. Smaller cattle populations increase the value of tools that protect each young animal before replacement planning decisions.
- Adoption of pre-weaned calf programs is expected to rise in dairy operations supported by nutrition checks and health-record needs. DeLaval reported in April 2026 that the Gustaf de Laval Fund focus areas included animal health and welfare. Farms using dairy herd management tools are likely to screen vendors for feeding instructions that match calf-group monitoring routines.
What drives dairy farms within the farm type category?
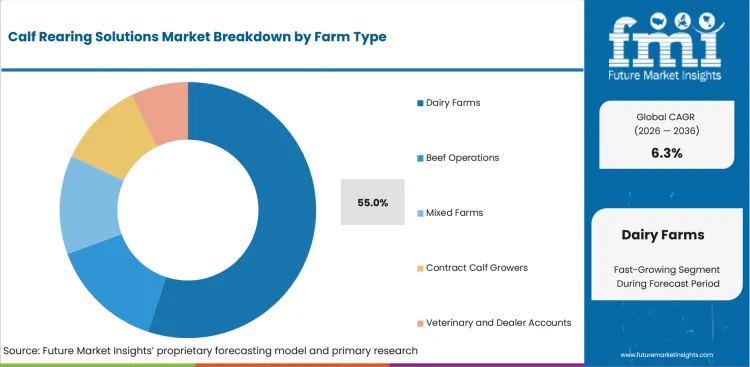
Dairy farms face calf-rearing pressure due to replacement-heifer economics and labor scheduling across young-stock barns. Early-life nutrition affects future herd productivity and culling risk during long-term herd planning and herd renewal. In November 2025, India reported per-capita milk availability of 485 grams/day for the national dairy system. The demand base is expected to widen interest in calf starters and milk-replacer programs that support organized dairy growth.
- Dairy farms are likely to capture 55.0% of farm type demand in 2026 attributable to replacement-heifer planning. India reported in November 2025 that five states contributed 54.0% of national milk production. Regional concentration is expected to support organized sourcing for calf nutrition and service packages across cooperative dairy clusters nationwide.
- Purchase activity for dairy-farm solutions is anticipated to rise driven by herd replacement pressure and labor-saving routines. India reported in November 2025 that milk production increased 3.58% over the previous year. Dairy operators linked to animal feed probiotic demand are expected to compare digestive support and starter-feed intake before approving protocol training.
How does direct farm sales influence purchasing within the sales channel category?
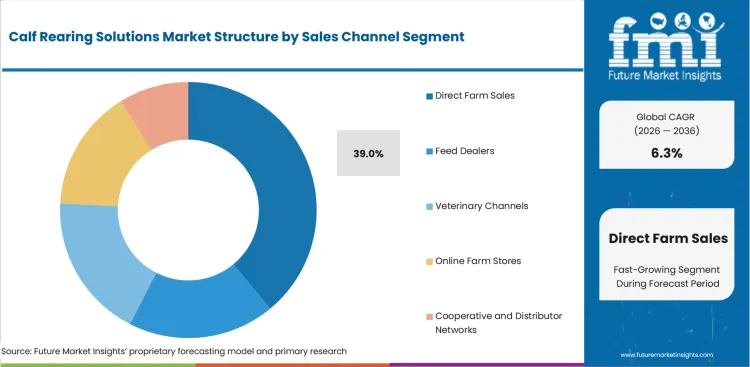
Channel choice shapes how calf protocols reach barn staff after product selection in daily farm routines. Direct farm sales keep nutrition guidance close to daily execution and reduce communication gaps. Holm & Laue published an October 2025 guide on standardized operating procedures for calf rearing. The guidance supports service-led sales in farms that need training proof before repeat orders and vendor selection.
- Direct farm sales are set to lead the sales channel category with 39.0% share in 2026 due to service intensity. In July 2024, Holm & Laue described a farm with 3700 cows using six CalfExpert automatic feeders. The case reinforces the value of direct support during equipment-led calf programs on working dairies.
- Dairy farm managers are expected to favor direct farm sales over alternatives due to training needs and equipment service. DeLaval reported in April 2026 that fund applications offered up to 15,000 euros per project. Accounts reviewing animal healthcare products are likely to value vendors that connect nutrition inputs to hygiene routines and calf health records.
What are the drivers, restraints, and opportunities in the Calf Rearing Solutions Market?
Near-term purchases are being shaped by early-life nutrition control, barn execution gaps, and service-led channel expansion outlined below.
- Driver: Replacement-heifer economics are expected to push farms toward calf solutions that improve feeding control and health records.
- Restraint: Adoption is likely to slow in farms that separate product buying from barn-level protocol ownership.
- Opportunity: Dealer-backed service packages are projected to open account access for vendors that train calf teams and document results.
Dairy farm managers are expected to increase purchases in accounts that connect calf nutrition to future herd output. DeLaval reported in April 2026 that its Gustaf de Laval Fund focused on precision dairy farming themes. The fund keeps dairy technology groups close to practical herd outcomes during vendor reviews. Nutrition teams are likely to reward vendors that translate product claims into repeatable barn routines.
Calf programs face adoption friction in operations that separate nutrition purchasing from barn execution. Protocol drift raises the risk that products are judged by weak use rather than product quality. DEFRA reported in December 2025 that the UK dairy herd reached 1.8 million animals in June 2025. Herd stability is expected to keep calf-program spending cautious unless service evidence reduces use risk.
Service-led vendors are projected to gain account access by bundling product instructions and troubleshooting support. DeLaval reported in April 2026 that its dairy fund encouraged practical decision-making in precision dairy projects. The program points to wider interest in decision support for calf barns and service planning. Providers tied to cattle supplies demand are likely to win trials by linking nutrition equipment and hygiene routines.
Which country CAGRs are profiled in the Calf Rearing Solutions Market?
.webp "Top Country Growth Comparison Calf Rearing Solutions Market Cagr (2026 2036)")
| Country | CAGR |
|---|---|
| United States | 3.8% |
| China | 4.7% |
| India | 5.7% |
| Germany | 3.2% |
| United Kingdom | 3.5% |
| Japan | 2.7% |
| South Korea | 3.7% |
Source: FMI's proprietary forecasting model and primary research
How do country-level CAGRs compare in the Calf Rearing Solutions Market?
India is projected to expand at 5.7% CAGR through 2036 and China is forecast to grow at 4.7% CAGR. The United States is anticipated to post 3.8% CAGR and South Korea is estimated to record 3.7% CAGR. The United Kingdom is likely to rise at 3.5% CAGR, Germany is predicted to advance at 3.2% CAGR and Japan is forecast to grow at 2.7% CAGR. Variation reflects dairy herd scale, calf-cost pressure and service access across farm systems before vendor commitment.
- The United States is projected to grow at 3.8% CAGR by 2036 driven by replacement-heifer economics and labor control in large dairy regions. In January 2026, USDA NASS reported a cattle inventory of 86.2 million head across the country. The herd base supports demand for feeding protocols that reduce variation in milk replacer use and starter intake across organized dairies. Adoption pressure is shaped by farm labor scarcity and the need to protect future herd output. Vendors with protocol training dealer coverage and documented use records are expected to receive stronger consideration in accounts that require repeatable calf records during annual reviews.
- China's calf rearing solutions outlook is anticipated to advance at 4.7% CAGR over the assessment period supported by milk-output scale and dairy modernization. The National Bureau of Statistics reported in February 2026 that milk output reached 40.91 million tons in 2025. Large milk supply raises attention to young-stock survival and structured feeding routines before cows enter production in organized farms. Local adoption is constrained by uneven farm sizes and service reach outside organized dairies during rural rollout. Trouw Nutrition and GEA are positioned to gain attention in farms that combine nutrition programs and equipment routines with dealer service support during modernization cycles.
- Calf rearing solution demand in India is forecast to rise at 5.7% CAGR over the forecast period led by organized dairy expansion and calf survival needs. The Department of Animal Husbandry and Dairying reported in November 2025 that milk production reached 247.87 million tonnes in 2024-25. The production base makes calf nutrition and colostrum support more relevant for cooperatives and progressive farms seeking young-stock consistency. Smallholder fragmentation keeps training and dealer support central to adoption across cooperative-linked accounts and rural service routes. Direct farm programs are expected to draw attention from dairy cooperatives in regions that need practical feeding guidance.
- Adoption of calf rearing solutions in Germany is estimated to expand at 3.2% CAGR through 2036 due to welfare scrutiny and precise calf-group management. Destatis reported in May 2025 that calves aged 8 months or under totaled 2.07 million. The calf base creates demand for feeding and housing systems that fit regulated farm routines and veterinary review. Farms are cautious about adding products unless records support veterinary review labor use and farm audit needs during herd planning. DeLaval and Holm & Laue are positioned to gain traction in accounts that prioritize equipment reliability and documentation during barn-support vendor decisions.
- The United Kingdom calf rearing solutions sector is projected to record 3.5% CAGR during the assessment period reinforced by dairy herd planning and farm service needs. The UK government reported in December 2025 that cattle and calves totaled 9.3 million in June 2025. The herd base keeps calf housing,feeding and health records visible in farm-level investment decisions across dairy regions. Adoption is constrained by cost scrutiny and uneven labor availability across dairy regions before broader vendor approval. Vendors with practical training material and routine follow-up are expected to receive stronger consideration in accounts that need dealer-supported calf routines.
- In Japan, calf rearing solution demand is predicted to advance at 2.7% CAGR through 2036 owing to careful farm investment and herd-quality control. USDA FAS reported in December 2025 that Japan had approximately 1.3 million dairy cattle on February 1, 2025. The dairy cattle base supports selective demand for milk replacers and feeding tools that reduce waste during careful farm upgrades. Farm aging and cautious spending keep replacement cycles measured before new equipment cycles begin in dairy regions. Farm managers are expected to concentrate purchases among vendors that provide reliable service and documented training before herd replacement planning meetings.
- South Korea is estimated to post 3.7% CAGR over the forecast period shaped by calf-cost pressure and tighter farm economics. Statistics Korea reported in April 2026 that dairy cattle totaled 371 thousand in the first quarter. Smaller herd scale increases attention to feeding accuracy and early health routines that protect young-stock value in each account. Adoption opportunities are concentrated in Hanwoo and dairy accounts that track calf costs closely before trial purchases and service commitments. Vendors with documented feeding protocols and clear cost records are expected to receive stronger consideration in accounts that need cost-linked performance records during annual budgeting.
Who are the notable companies in the Calf Rearing Solutions Market?
Cargill, Trouw Nutrition, DeLaval, GEA, Holm & Laue, Förster-Technik, Urban GmbH & Co. KG, Calf-Tel, Milk Bar, and Grober Nutrition are the notable companies shaping this market.
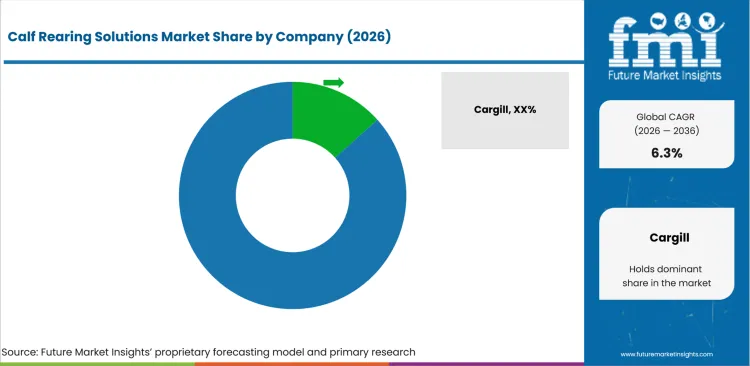
The competitive base is moderately concentrated around animal nutrition groups and dairy automation companies. Calf-equipment specialists hold narrower barn-service accounts that depend on farm visits and dealer support. Larger nutrition groups retain access through feed channels and technical service during farm trials. Equipment specialists compete in barns that need automated feeding and housing systems during farm upgrades. Competitive screening turns on by protocol proof and installation support before service continuity is reviewed. Accounts using microbial feed additives are expected to apply similar proof standards to calf digestive-health claims during vendor approval.
- Cargill and Provimi compete on calf and heifer nutrition programs that fit existing feed sourcing routines. Their role is clearest in accounts that prefer fewer nutrition handoffs during growth-program changes. Farm nutrition leads are expected to value their channel reach in accounts that combine milk replacer and starter-feed decisions inside broader nutrition contracts.
- Trouw Nutrition holds a practical position in calf milk replacers due to its Sprayfo line and technical service model. Dairy farms evaluate its products in accounts that need growth checks and feeding instructions aligned with barn routines. The company is expected to gain consideration in farms that want powder performance evidence before repeat purchases.
- DeLaval, GEA and Förster-Technik compete in automated feeding accounts that treat calf care as part of labor planning. Farm managers compare feeder reliability and data capture before they review maintenance access for equipment-led programs. These companies are expected to receive stronger consideration in dairies that need feeding records and service continuity.
- Specialists such as Holm & Laue and Urban serve narrower needs around housing and feeding equipment. Calf-Tel, Milk Bar and Grober Nutrition support accounts that need calf-specific nutrition or fixtures in dealer accounts. Specialists with dealer reach are expected to gain consideration in farms upgrading calf barns. Their practical edge is service fit inside smaller or locally managed young-stock operations that need local follow-up.
Competitive Benchmarking: Calf Rearing Solutions Market
| Company | Calf nutrition relevance | Equipment fit | Farm service access | Geographic reach |
|---|---|---|---|---|
| Cargill | High | Medium | Strong | Global |
| Trouw Nutrition | High | Medium | Strong | Global |
| DeLaval | Medium | High | Strong | Global |
| GEA | Medium | High | Strong | Global |
| Holm & Laue | Medium | High | Strong | Regional |
| Förster-Technik | Medium | High | Strong | Regional |
| Urban GmbH & Co. KG | Medium | High | Medium | Regional |
| Calf-Tel | Medium | High | Medium | Regional |
| Milk Bar | Medium | Medium | Medium | Regional |
Source: Future Market Insights competitive analysis, 2026. Ratings reflect relative portfolio relevance and workflow fit. Service capability and geographic reach shape the remaining comparison.
Key Developments in the Calf Rearing Solutions Market
- In November 2024, Trouw Nutrition introduced Sprayfo Ultimo at EuroTier 2024 in Hanover for calf milk programs. The company described the product as a calf milk replacer that links milk feeding to visible health indicators. The launch is expected to sharpen farm interest in milk replacers that link nutrition and visible calf condition.
- In September 2025, DeLaval announced the Hamra Farm expansion as part of its dairy innovation program. The expansion included a purpose-built maternity and calf barn designed for 200 calves aged 0 to 5 months. The development points to continuing investment in calf spaces inside modern dairy systems and service training.
Key Players in the Calf Rearing Solutions Market
Calf nutrition and milk replacer suppliers
- Cargill
- Trouw Nutrition
- Provimi
- Grober Nutrition
Automated feeding and dairy systems
- DeLaval
- GEA
- Förster-Technik
- Urban GmbH & Co. KG
Calf housing and feeding specialists
- Holm & Laue
- Calf-Tel
- Milk Bar
Calf Rearing Solutions Market - Report Scope
| Coverage field | Report scope |
|---|---|
| Market breakdown | Calf Rearing Solutions Market Breakdown By Solution Type, Product Format, Calf Age Group, Farm Type, Sales Channel, and Region |
| Market Definition | Calf rearing solutions are nutrition products, feeding systems, hygiene tools and service programs used by dairy and beef farms to manage calves from birth to weaning. |
| Regions Covered | North America, Europe, East Asia, South Asia, Latin America, Oceania, and Middle East and Africa |
| Countries Covered | United States, China, India, Germany, United Kingdom, Japan, South Korea and 30+ countries |
| Key Companies Profiled | Cargill, Trouw Nutrition, DeLaval, GEA, Holm & Laue, Förster-Technik, Urban GmbH & Co. KG, Calf-Tel, Milk Bar, and Grober Nutrition |
| Forecast Period | 2026 to 2036 |
| Approach | Hybrid bottom-up and top-down methodology using calf milk replacer adoption, farm type demand, product format mix and service-channel penetration |
Source: Future Market Insights - analysis driven by proprietary forecasting models and primary research
Calf Rearing Solutions Market - Research Methodology
| Method | Approach |
|---|---|
| Primary Research | FMI analysts gathered input from manufacturers, service providers, technology developers, distributors, end users, supply chain teams, and subject-matter experts. Interviews examined purchasing decisions, product or service evaluation, adoption barriers, approval requirements, pricing considerations, and expectations for technical or commercial support. Respondents were also asked what evidence is required before a trial, pilot, or initial order develops into regular purchasing. |
| Desk Research | Desk research covered government statistics, regulatory publications, trade data, industry associations, technical literature, standards, company filings, product information, and official corporate announcements. Sources were reviewed for relevance, publication date, geographic coverage, and consistency with the defined market scope. Claims relating to performance, applications, approvals, capacity, investment, and commercial activity were retained only when supported by credible public evidence. |
| Market Sizing and Forecasting | The market model combined the baseline value with historical performance, segment structure, pricing and volume indicators, adoption levels, company participation, and country-level demand conditions. Forecast assumptions considered economic activity, investment trends, regulatory developments, technology adoption, purchasing cycles, supply availability, and barriers to wider market use. Segment and regional estimates were reconciled before the final market total was calculated. |
| Data Validation | Estimates were checked against multiple independent indicators, including public data, company activity, trade patterns, industry developments, and findings from primary interviews. Validation also tested whether products, services, applications, and company revenues fell within the defined market boundaries. Adjacent categories, unsupported claims, overlapping revenues, and activities without direct market relevance were excluded to reduce double counting and maintain consistency across segments and countries. |
Calf Rearing Solutions Market by Segments
Calf Rearing Solutions Market segmented by Solution Type:
- Calf Milk Replacers
- Colostrum Management Products
- Calf Starters and Supplements
- Feeding Equipment
- Housing and Hygiene Systems
Calf Rearing Solutions Market segmented by Product Format:
- Powdered Products
- Liquid Products
- Pellets
- Equipment Systems
- Bundled Service Kits
Calf Rearing Solutions Market segmented by Calf Age Group:
- Newborn Calves
- Pre-Weaned Calves
- Weaned Calves
- Replacement Heifers
- Beef Calves
Calf Rearing Solutions Market segmented by Farm Type:
- Dairy Farms
- Beef Operations
- Mixed Farms
- Contract Calf Growers
- Veterinary and Dealer Accounts
Calf Rearing Solutions Market segmented by Sales Channel:
- Direct Farm Sales
- Feed Dealers
- Veterinary Channels
- Online Farm Stores
- Cooperative and Distributor Networks
Calf Rearing Solutions Market by Region:
- North America
- United States
- Canada
- Latin America
- Brazil
- Mexico
- Argentina
- Europe
- Germany
- United Kingdom
- France
- Italy
- Netherlands
- East Asia
- China
- Japan
- South Korea
- South Asia
- India
- Thailand
- Indonesia
- Oceania
- Australia
- New Zealand
- Middle East and Africa
- GCC Countries
- South Africa
Research Sources and Bibliography
- USA Department of Agriculture, National Agricultural Statistics Service. (2026, January). United States cattle inventory down slightly. USA Department of Agriculture.
- USA Department of Agriculture, National Agricultural Statistics Service. (2025, February). Milk Production 02/21/2025. USA Department of Agriculture.
- USA Department of Agriculture, Economic Research Service. (2026, February). Growth in output per cow drives USA milk production gains. USA Department of Agriculture.
- USA Department of Agriculture, Economic Research Service. (2026, January). Dairy - Background. USA Department of Agriculture.
- USA Department of Agriculture, Economic Research Service. (2025, March). Livestock production cycles affect long-term price outlook for cattle, hogs, and chickens. USA Department of Agriculture.
- National Bureau of Statistics of China. (2026, February). Statistical Communiqué of the People’s Republic of China on the 2025 National Economic and Social Development. National Bureau of Statistics of China.
- Department of Animal Husbandry and Dairying. (2025, November). Release of Basic Animal Husbandry Statistics-2025. Government of India.
- Destatis. (2025, May). Holdings with cattle and stock of cattle. Federal Statistical Office of Germany.
- Department for Environment, Food and Rural Affairs. (2025, December). Livestock populations in the United Kingdom at 1 June 2025. Government of the United Kingdom.
- USA Department of Agriculture, Foreign Agricultural Service. (2025, December). Dairy and Products Annual. USA Department of Agriculture.
- Statistics Korea. (2026, May). 2025 Livestock Production Cost Survey. Statistics Korea.
- Statistics Korea. (2026, April). Livestock Statistics in the First Quarter of 2026. Statistics Korea.
- Trouw Nutrition. (2024, November). EuroTier 2024. Trouw Nutrition.
- Holm & Laue. (2024, July). “Our calves’ welfare is my top priority”. Holm & Laue.
- Förster-Technik. (2024, November). History. Förster-Technik.
- DeLaval. (2025, September). Hamra Farm expansion marks new era for DeLaval innovation. DeLaval.
- DeLaval. (2026, April). Gustaf de Laval Fund - call for applications. DeLaval.
- Cargill. (2024, July). Cargill Invests $1 Million in Research on Methane Reduction. Cargill.
- Holm & Laue. (2025, October). Successful calf rearing with standardised operating procedures (SOPs). Holm & Laue.
This bibliography is provided for reader reference using primary government sources and selected standards-body official trade body and company sources.
This Report Answers
- What is the estimated market value in 2026 and the projected value by 2036?
- What CAGR is forecast for the calf rearing solutions market from 2026 to 2036?
- Which solution type, product format and farm type segments shape demand across the market?
- Which farm-level pressures support adoption or purchase activity for calf rearing solutions?
- How do country CAGRs differ across the profiled calf rearing markets?
- Which companies compete across nutrition, equipment and service dimensions in this market?
- What factors should farm procurement teams address before broader account expansion or sourcing commitment?
- How do documentation, health records and service support affect vendor selection in calf rearing accounts?
Frequently Asked Questions
Why should executives track the Calf Rearing Solutions Market?
Executives should track this market because calf rearing outcomes directly affect replacement heifer quality, future milk yields and labor efficiency. The category also signals how effectively farms convert early investment into long term herd performance.
What business problem does the Calf Rearing Solutions Market address?
The market addresses inconsistent early life nutrition, uneven feeding routines, and preventable health variation prior to weaning. Effective solutions help standardize calf performance during the most sensitive growth phase.
What should procurement leaders evaluate before selecting suppliers?
Procurement teams should assess mixing accuracy, feeding reliability, and documented calf health outcomes before supplier approval. Equipment servicing capability, dealer coverage, and training support should then guide final selection.
What limits return on investment for farm accounts?
Return on investment is constrained by weak ownership of rearing protocols and inconsistent execution at the barn level. Limited follow up after initial product trials further reduces long term program value.
How do suppliers build long term account confidence?
Suppliers build confidence by training calf care teams, documenting feeding and health outcomes, and supporting repeat on farm audits. Consistent technical engagement reinforces adoption beyond the first rearing cycle.
Preview the report firsthand - request a free sample
Get SampleGet the brochure for pricing and purchase details.
Get PDFTable of Content
- Key Takeaways
- Market Size and CAGR
- Top Growth Driver
- Fastest Growing Segment
- Leading Region
- Key Companies
- Emerging Opportunities
- Executive Summary
- Global Market Outlook
- Demand-side Trends
- Supply-side Trends
- Technology Roadmap Analysis
- Analysis and Recommendations
- Analyst Perspective (What is happening? Why now? What should investors know?)
- Key Questions Answered
- How large is the market?
- What is the CAGR?
- What are key trends?
- Which region dominates?
- Who are the leaders?
- Market Overview
- Market Coverage / Taxonomy
- Market Definition / Scope / Limitations
- Research Methodology
- Chapter Orientation
- Analytical Lens and Working Hypotheses
- Market Structure, Signals, and Trend Drivers
- Benchmarking and Cross-market Comparability
- Market Sizing, Forecasting, and Opportunity Mapping
- Research Design and Evidence Framework
- Desk Research Programme (Secondary Evidence)
- Expert Input and Fieldwork (Primary Evidence)
- Tooling, Models, and Reference Databases
- Data Engineering and Model Build
- Quality Assurance and Audit Trail
- Market Background
- Market Dynamics (Drivers, Restraints, Opportunity, Trends)
- Scenario Forecast (Optimistic, Likely, Conservative)
- Impact Analysis
- AI Impact
- Sustainability Impact
- Regulatory Impact
- Technology Impact
- Consumer / Buyer Analysis
- Purchase Drivers
- Adoption Barriers
- Buyer Journey
- Opportunity Map Analysis
- Product Life Cycle Analysis
- Supply Chain Analysis
- Investment Feasibility Matrix
- Value Chain Analysis
- PESTLE and Porter's Analysis
- Regulatory Landscape
- Regional Parent Market Outlook
- Production and Consumption Statistics
- Import and Export Statistics
- Global Market Analysis and Forecast, 2021 to 2036
- Historical Market Size Value (USD Million) & Volume (Unit) Analysis, 2021 to 2025
- Current and Future Market Size Value (USD Million) & Volume (Unit) Projections, 2026 to 2036
- Y-o-Y Growth Trend Analysis
- Absolute $ Opportunity Analysis
- Global Market Pricing Analysis, 2021 to 2036
- Global Market Analysis and Forecast, By Solution Type, 2021 to 2036
- Introduction / Key Findings
- Historical Market Size Value (USD Million) & Volume (Unit) Analysis By Solution Type, 2021 to 2025
- Current and Future Market Size Value (USD Million) & Volume (Unit) Analysis and Forecast By Solution Type, 2026 to 2036
- Calf Milk Replacers
- Colostrum Management Products
- Calf Starters and Supplements
- Feeding Equipment
- Housing and Hygiene Systems
- Calf Milk Replacers
- Y-o-Y Growth Trend Analysis By Solution Type, 2021 to 2025
- Absolute $ Opportunity Analysis By Solution Type, 2026 to 2036
- Global Market Analysis and Forecast, By Product Format, 2021 to 2036
- Introduction / Key Findings
- Historical Market Size Value (USD Million) & Volume (Unit) Analysis By Product Format, 2021 to 2025
- Current and Future Market Size Value (USD Million) & Volume (Unit) Analysis and Forecast By Product Format, 2026 to 2036
- Powdered Products
- Liquid Products
- Pellets
- Equipment Systems
- Bundled Service Kits
- Powdered Products
- Y-o-Y Growth Trend Analysis By Product Format, 2021 to 2025
- Absolute $ Opportunity Analysis By Product Format, 2026 to 2036
- Global Market Analysis and Forecast, By Calf Age Group, 2021 to 2036
- Introduction / Key Findings
- Historical Market Size Value (USD Million) & Volume (Unit) Analysis By Calf Age Group, 2021 to 2025
- Current and Future Market Size Value (USD Million) & Volume (Unit) Analysis and Forecast By Calf Age Group, 2026 to 2036
- Pre-Weaned Calves
- Newborn Calves
- Weaned Calves
- Replacement Heifers
- Beef Calves
- Pre-Weaned Calves
- Y-o-Y Growth Trend Analysis By Calf Age Group, 2021 to 2025
- Absolute $ Opportunity Analysis By Calf Age Group, 2026 to 2036
- Global Market Analysis and Forecast, By Farm Type, 2021 to 2036
- Introduction / Key Findings
- Historical Market Size Value (USD Million) & Volume (Unit) Analysis By Farm Type, 2021 to 2025
- Current and Future Market Size Value (USD Million) & Volume (Unit) Analysis and Forecast By Farm Type, 2026 to 2036
- Dairy Farms
- Beef Operations
- Mixed Farms
- Contract Calf Growers
- Veterinary and Dealer Accounts
- Dairy Farms
- Y-o-Y Growth Trend Analysis By Farm Type, 2021 to 2025
- Absolute $ Opportunity Analysis By Farm Type, 2026 to 2036
- Global Market Analysis and Forecast, By Sales Channel, 2021 to 2036
- Introduction / Key Findings
- Historical Market Size Value (USD Million) & Volume (Unit) Analysis By Sales Channel, 2021 to 2025
- Current and Future Market Size Value (USD Million) & Volume (Unit) Analysis and Forecast By Sales Channel, 2026 to 2036
- Direct Farm Sales
- Feed Dealers
- Veterinary Channels
- Online Farm Stores
- Cooperative and Distributor Networks
- Direct Farm Sales
- Y-o-Y Growth Trend Analysis By Sales Channel, 2021 to 2025
- Absolute $ Opportunity Analysis By Sales Channel, 2026 to 2036
- Global Market Analysis and Forecast, By Region, 2021 to 2036
- Introduction
- Historical Market Size Value (USD Million) & Volume (Unit) Analysis By Region, 2021 to 2025
- Current Market Size Value (USD Million) & Volume (Unit) Analysis and Forecast By Region, 2026 to 2036
- North America
- Latin America
- Western Europe
- Eastern Europe
- East Asia
- South Asia and Pacific
- Middle East & Africa
- Market Attractiveness Analysis By Region
- North America Market Analysis and Forecast, By Country, 2021 to 2036
- Historical Market Size Value (USD Million) & Volume (Unit) Trend Analysis By Market Taxonomy, 2021 to 2025
- Market Size Value (USD Million) & Volume (Unit) Forecast By Market Taxonomy, 2026 to 2036
- By Country
- USA
- Canada
- Mexico
- By Solution Type
- By Product Format
- By Calf Age Group
- By Farm Type
- By Sales Channel
- By Country
- Market Attractiveness Analysis
- By Country
- By Solution Type
- By Product Format
- By Calf Age Group
- By Farm Type
- By Sales Channel
- Key Takeaways
- Latin America Market Analysis and Forecast, By Country
- Historical Market Size Value (USD Million) & Volume (Unit) Trend Analysis By Market Taxonomy, 2021 to 2025
- Market Size Value (USD Million) & Volume (Unit) Forecast By Market Taxonomy, 2026 to 2036
- By Country
- Brazil
- Chile
- Rest of Latin America
- By Solution Type
- By Product Format
- By Calf Age Group
- By Farm Type
- By Sales Channel
- By Country
- Market Attractiveness Analysis
- By Country
- By Solution Type
- By Product Format
- By Calf Age Group
- By Farm Type
- By Sales Channel
- Key Takeaways
- Western Europe Market Analysis and Forecast, By Country
- Historical Market Size Value (USD Million) & Volume (Unit) Trend Analysis By Market Taxonomy, 2021 to 2025
- Market Size Value (USD Million) & Volume (Unit) Forecast By Market Taxonomy, 2026 to 2036
- By Country
- Germany
- UK
- Italy
- Spain
- France
- Nordic
- BENELUX
- Rest of Western Europe
- By Solution Type
- By Product Format
- By Calf Age Group
- By Farm Type
- By Sales Channel
- By Country
- Market Attractiveness Analysis
- By Country
- By Solution Type
- By Product Format
- By Calf Age Group
- By Farm Type
- By Sales Channel
- Key Takeaways
- Eastern Europe Market Analysis and Forecast, By Country
- Historical Market Size Value (USD Million) & Volume (Unit) Trend Analysis By Market Taxonomy, 2021 to 2025
- Market Size Value (USD Million) & Volume (Unit) Forecast By Market Taxonomy, 2026 to 2036
- By Country
- Russia
- Poland
- Hungary
- Balkan & Baltic
- Rest of Eastern Europe
- By Solution Type
- By Product Format
- By Calf Age Group
- By Farm Type
- By Sales Channel
- By Country
- Market Attractiveness Analysis
- By Country
- By Solution Type
- By Product Format
- By Calf Age Group
- By Farm Type
- By Sales Channel
- Key Takeaways
- East Asia Market Analysis and Forecast, By Country
- Historical Market Size Value (USD Million) & Volume (Unit) Trend Analysis By Market Taxonomy, 2021 to 2025
- Market Size Value (USD Million) & Volume (Unit) Forecast By Market Taxonomy, 2026 to 2036
- By Country
- China
- Japan
- South Korea
- By Solution Type
- By Product Format
- By Calf Age Group
- By Farm Type
- By Sales Channel
- By Country
- Market Attractiveness Analysis
- By Country
- By Solution Type
- By Product Format
- By Calf Age Group
- By Farm Type
- By Sales Channel
- Key Takeaways
- South Asia and Pacific Market Analysis and Forecast, By Country
- Historical Market Size Value (USD Million) & Volume (Unit) Trend Analysis By Market Taxonomy, 2021 to 2025
- Market Size Value (USD Million) & Volume (Unit) Forecast By Market Taxonomy, 2026 to 2036
- By Country
- India
- ASEAN
- Australia & New Zealand
- Rest of South Asia and Pacific
- By Solution Type
- By Product Format
- By Calf Age Group
- By Farm Type
- By Sales Channel
- By Country
- Market Attractiveness Analysis
- By Country
- By Solution Type
- By Product Format
- By Calf Age Group
- By Farm Type
- By Sales Channel
- Key Takeaways
- Middle East & Africa Market Analysis and Forecast, By Country
- Historical Market Size Value (USD Million) & Volume (Unit) Trend Analysis By Market Taxonomy, 2021 to 2025
- Market Size Value (USD Million) & Volume (Unit) Forecast By Market Taxonomy, 2026 to 2036
- By Country
- Kingdom of Saudi Arabia
- Other GCC Countries
- Türkiye
- South Africa
- Other African Union
- Rest of Middle East & Africa
- By Solution Type
- By Product Format
- By Calf Age Group
- By Farm Type
- By Sales Channel
- By Country
- Market Attractiveness Analysis
- By Country
- By Solution Type
- By Product Format
- By Calf Age Group
- By Farm Type
- By Sales Channel
- Key Takeaways
- Key Countries Market Analysis
- USA
- Pricing Analysis
- Market Share Analysis, 2025
- By Solution Type
- By Product Format
- By Calf Age Group
- By Farm Type
- By Sales Channel
- Canada
- Pricing Analysis
- Market Share Analysis, 2025
- By Solution Type
- By Product Format
- By Calf Age Group
- By Farm Type
- By Sales Channel
- Mexico
- Pricing Analysis
- Market Share Analysis, 2025
- By Solution Type
- By Product Format
- By Calf Age Group
- By Farm Type
- By Sales Channel
- Brazil
- Pricing Analysis
- Market Share Analysis, 2025
- By Solution Type
- By Product Format
- By Calf Age Group
- By Farm Type
- By Sales Channel
- Chile
- Pricing Analysis
- Market Share Analysis, 2025
- By Solution Type
- By Product Format
- By Calf Age Group
- By Farm Type
- By Sales Channel
- Germany
- Pricing Analysis
- Market Share Analysis, 2025
- By Solution Type
- By Product Format
- By Calf Age Group
- By Farm Type
- By Sales Channel
- UK
- Pricing Analysis
- Market Share Analysis, 2025
- By Solution Type
- By Product Format
- By Calf Age Group
- By Farm Type
- By Sales Channel
- Italy
- Pricing Analysis
- Market Share Analysis, 2025
- By Solution Type
- By Product Format
- By Calf Age Group
- By Farm Type
- By Sales Channel
- Spain
- Pricing Analysis
- Market Share Analysis, 2025
- By Solution Type
- By Product Format
- By Calf Age Group
- By Farm Type
- By Sales Channel
- France
- Pricing Analysis
- Market Share Analysis, 2025
- By Solution Type
- By Product Format
- By Calf Age Group
- By Farm Type
- By Sales Channel
- India
- Pricing Analysis
- Market Share Analysis, 2025
- By Solution Type
- By Product Format
- By Calf Age Group
- By Farm Type
- By Sales Channel
- ASEAN
- Pricing Analysis
- Market Share Analysis, 2025
- By Solution Type
- By Product Format
- By Calf Age Group
- By Farm Type
- By Sales Channel
- Australia & New Zealand
- Pricing Analysis
- Market Share Analysis, 2025
- By Solution Type
- By Product Format
- By Calf Age Group
- By Farm Type
- By Sales Channel
- China
- Pricing Analysis
- Market Share Analysis, 2025
- By Solution Type
- By Product Format
- By Calf Age Group
- By Farm Type
- By Sales Channel
- Japan
- Pricing Analysis
- Market Share Analysis, 2025
- By Solution Type
- By Product Format
- By Calf Age Group
- By Farm Type
- By Sales Channel
- South Korea
- Pricing Analysis
- Market Share Analysis, 2025
- By Solution Type
- By Product Format
- By Calf Age Group
- By Farm Type
- By Sales Channel
- Russia
- Pricing Analysis
- Market Share Analysis, 2025
- By Solution Type
- By Product Format
- By Calf Age Group
- By Farm Type
- By Sales Channel
- Poland
- Pricing Analysis
- Market Share Analysis, 2025
- By Solution Type
- By Product Format
- By Calf Age Group
- By Farm Type
- By Sales Channel
- Hungary
- Pricing Analysis
- Market Share Analysis, 2025
- By Solution Type
- By Product Format
- By Calf Age Group
- By Farm Type
- By Sales Channel
- Kingdom of Saudi Arabia
- Pricing Analysis
- Market Share Analysis, 2025
- By Solution Type
- By Product Format
- By Calf Age Group
- By Farm Type
- By Sales Channel
- Türkiye
- Pricing Analysis
- Market Share Analysis, 2025
- By Solution Type
- By Product Format
- By Calf Age Group
- By Farm Type
- By Sales Channel
- South Africa
- Pricing Analysis
- Market Share Analysis, 2025
- By Solution Type
- By Product Format
- By Calf Age Group
- By Farm Type
- By Sales Channel
- USA
- Market Structure Analysis
- Competition Dashboard
- Competition Benchmarking
- Market Share Analysis of Top Players
- By Regional
- By Solution Type
- By Product Format
- By Calf Age Group
- By Farm Type
- By Sales Channel
- Emerging Startups
- Innovation Benchmarking
- Competition Analysis
- Competition Deep Dive
- Cargill
- Overview
- Product Portfolio
- Profitability by Market Segments (Product/Region/Sales Channel)
- Sales Footprint
- Strategy Overview
- Marketing Strategy
- Product Strategy
- Channel Strategy
- Trouw Nutrition
- DeLaval
- GEA
- Holm & Laue
- Förster-Technik
- Urban GmbH & Co. KG
- Calf-Tel
- Milk Bar
- Grober Nutrition
- Cargill
- Case Studies
- Success Stories
- Recent Developments
- Competition Deep Dive
- Assumptions & Acronyms Used


