Carbon Labeled Packaged Meal Market Size and Share Forecast Outlook 2025 to 2035

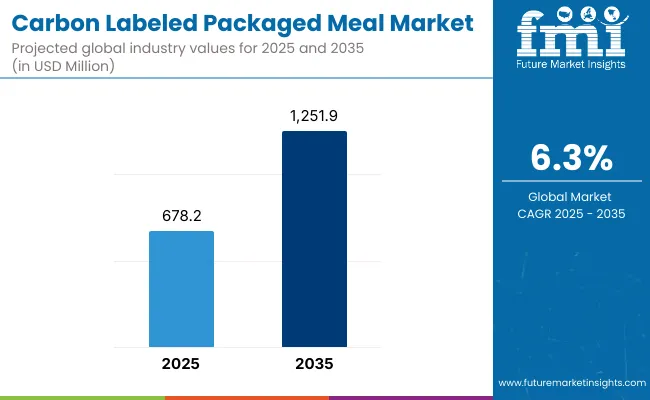
A valuation of USD 678.2 Million has been projected for the carbon-labeled packaged meal market in 2025, and by 2035 the size is anticipated to reach USD 1,251.9 Million. The overall expansion represents a 6.3%, translating into a near-doubling of value over the decade. This trajectory highlights how verified climate transparency in food choices is moving from niche adoption toward mainstream demand.
Quick Stats for Carbon Labeled Packaged Meal Market

  • Carbon-Labeled Packaged Meal Market Value (2025): USD 678.2 Million
  • Carbon-Labeled Packaged Meal Market Forecast Value (2035): USD 1,251.9 Million
  • Carbon-Labeled Packaged Meal Market Forecast CAGR (2025 to 2035): 6.3%
  • Leading Segment in 2025: Third-Party Verified Labels (~40% share, 7.1% CAGR)
  • Key Growth Regions: North America, Europe, South Asia & Pacific
  • Top Key Players: Allplants, Quorn Foods, HelloFresh (Green Chef, Factor), My Emissions (private-label partnerships), Nestlé (Garden Gourmet, Lean Cuisine carbon-labeled variants)

Carbon Labeled Packaged Meal Market

Carbon Labeled Packaged Meal Market Key Takeaways

Metric Value
Carbon Labeled Packaged Meal Market Estimated Value in (2025E) USD 678.2 Million
Carbon Labeled Packaged Meal Market Forecast Value in (2035F) USD 1,251.9 Million
Forecast CAGR (2025 to 2035) 6.3%

From 2025 to 2030, the market is expected to expand from USD 678.2 Million to USD 905.1 Million, contributing approximately USD 226.9 Million in new revenue, which equals more than one-third of total decade growth. This phase is likely to be characterized by steady consumer adoption, primarily in North America and Europe, where regulations and retailer commitments are reinforcing the uptake of certified labels. Third-party verification is projected to dominate, holding about 40% share, with consumer trust acting as the central growth lever.

In the second half, 2030 to 2035, an additional USD 346.8 Million is forecast to be generated as the market advances from USD 905.1Millionto USD 1,251.9 Million, representing the stronger growth phase of the decade. This acceleration is expected to be powered by South Asia & Pacific and broader European markets, where institutional buyers and policy support are stimulating penetration. By composition, plant-based meals are anticipated to lead with 30% share and 7.5% CAGR, shaping the category’s premium tier. Verified carbon labeling combined with sustainable packaging solutions is projected to become the decisive differentiator, anchoring long-term trust and consumer preference.

From 2020 to 2024, the Carbon-Labeled Packaged Meal Market expanded steadily, with early growth driven by niche adoption among climate-conscious consumers and pilot initiatives by leading retailers. During this period, the competitive landscape was shaped by plant-based meal innovators and sustainability-driven brands, while traditional food majors began experimenting with carbon footprint disclosures. Differentiation relied on credibility of certification and packaging sustainability, while self-declared labels were often treated as supplementary signals rather than primary purchase drivers. Institutional demand contributed minimally, Carbon Labeled Packaged Meal Market accounting for less than 10% of market value as procurement standards were still in transition.

Demand for carbon-labeled packaged meals is projected to reach USD 678.2 Million in 2025, advancing toward USD 1,251.9 Million by 2035 at a 6.3% CAGR. The revenue mix is expected to shift as third-party verified certifications secure ~40% share, supported by growing policy alignment and rising consumer trust. Traditional food players are anticipated to face intensifying competition from digital-first sustainability platforms and plant-based challengers offering transparent, audit-backed climate disclosures.

Established brands are projected to pivot toward hybrid models, integrating verified labeling, eco-packaging, and digital traceability to maintain relevance. Emerging entrants specializing in data-driven carbon analytics, QR-linked transparency tools, and premium plant-based offerings are gaining traction. Competitive advantage is expected to transition away from brand scale alone toward trustworthiness, verifiability, and alignment with consumer sustainability values, enabling long-term differentiation.

Segmental Analysis

The market is segmented by product type, certification, meal composition, sales channel, packaging, consumer group, and region. Product categories include ready-to-eat, ready-to-cook, frozen, shelf-stable, and chilled formats, reflecting diverse consumer needs. Certification is divided into government-certified, third-party verified, and self-declared labels, highlighting varying levels of trust and transparency. Meal composition spans plant-based, vegetarian, meat-based, and hybrid protein formats, capturing both traditional and emerging dietary preferences.

Sales channels encompass retail, online platforms, subscriptions, and institutional procurement, expanding accessibility. Packaging segmentation covers compostable, recyclable, reusable, and single-use solutions, aligning with sustainability commitments. Consumer groups include climate-conscious buyers, flexitarians, millennials, Gen Z, and health-focused segments. Regionally, the scope extends across North America, Latin America, Europe, East Asia, South Asia & Pacific, and the Middle East & Africa.
Insights into the Product Type Segment with Ready-to-Eat Meals Leading in Market Share

Carbon Labeled Packaged Meal Market By Product

Product Type Share%
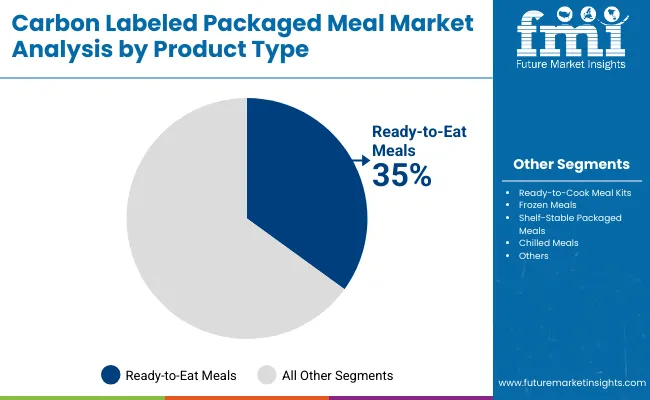
Ready-to-Eat Meals 35%
Ready-to-Cook Meal Kits 25%
Frozen Meals 20%
Shelf-Stable Packaged Meals 10%
Chilled Meals 10%

The product type segment is projected to be dominated by ready-to-eat meals, which are forecasted to hold 35% market share in 2025. Growth in this category is being reinforced by the convenience-driven lifestyles of urban consumers, who are increasingly seeking sustainable and transparent food options. Ready-to-cook meal kits are expected to follow closely, expanding at the fastest CAGR of 7.0%, as households shift toward flexible home dining formats with traceable carbon footprints. Frozen and chilled meals are forecasted to record steady mid-single-digit growth, supported by longer shelf life and premium positioning. Shelf-stable packaged meals are expected to remain the smallest category due to limited freshness perception, although demand may be maintained in developing markets and institutional channels.
Insights into the Certification Segment with Third-Party Verified Labels Dominating Adoption

Carbon Labeled Packaged Meal Market By Certification

Certification Type Share%
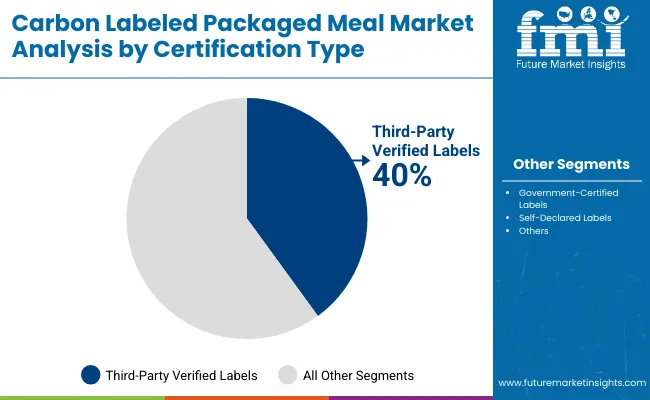
Third-Party Verified Labels 40%
Government-Certified Labels 30%
Self-Declared Labels 30%

The certification type segment is expected to be led by third-party verified labels, which are projected to secure around 40% of the total market in 2025. Growth in this category is being powered by consumer trust in independent audits and retailer demand for credible sustainability disclosures. Government-certified programs are forecasted to gain strength in highly regulated markets, particularly in Europe and the UK, where carbon disclosure legislation is advancing. In contrast, self-declared labels are projected to retain a significant presence but at a lower CAGR of 5.8%, as consumers increasingly scrutinize brand claims for credibility. Over the decade, the shift toward transparent, third-party verification is expected to position trust as the defining driver of long-term competitiveness.
Insights into the Meal Composition Segment with Meat-Based Meals Retaining Scale but Plant-Based Leading Growth

Carbon Labeled Packaged Meal Market By Meal Composition

Segment Share%
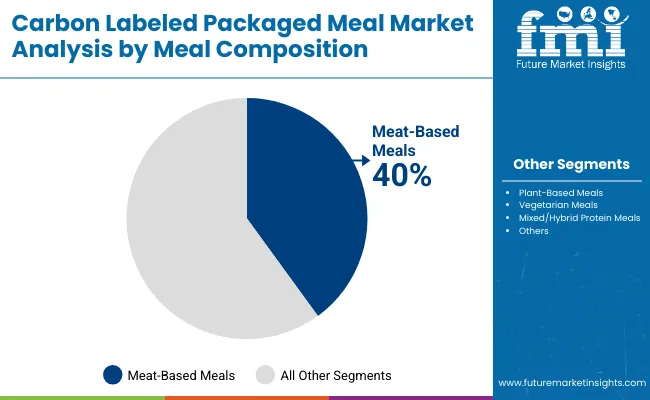
Meat-Based Meals 40%
Plant-Based Meals 30%
Vegetarian Meals 15%
Mixed/Hybrid Protein Meals 15%

The meal composition segment is anticipated to remain led by meat-based meals, which are projected to capture 40% share in 2025. However, expansion is forecasted to be strongest in the plant-based segment, advancing at a CAGR of 7.5%, outpacing all other categories. Rising adoption of flexitarian diets, coupled with sustainability commitments from retailers and foodservice operators, is expected to sustain plant-based growth across both developed and emerging markets. Vegetarian meals and hybrid protein formats are projected to record healthy mid-single-digit growth, supported by consumer interest in balance between taste, nutrition, and sustainability. While meat-based meals will maintain scale through 2035, their relative share is likely to soften as carbon-conscious consumers increasingly prioritize lower-impact meal options.

What are the Drivers, Restraints, and Key Trends of the Carbon Labeled Packaged Meal Market?

Adoption of carbon-labeled packaged meals is being accelerated by shifting regulatory frameworks and heightened consumer scrutiny, even as cost pressures and methodological inconsistencies create hurdles. Strategic advantage is expected to hinge on verified disclosures, sustainable packaging, and integration into institutional procurement policies.

Institutionalization of Carbon Disclosure in Food Procurement

Growth is being propelled by the institutional embedding of carbon disclosures within corporate and public procurement frameworks. Schools, hospitals, and corporate canteens are increasingly required to demonstrate Scope 3 reductions, positioning carbon-labeled meals as compliant and credible solutions. The incorporation of verified meal options into large-scale contracts is expected to create stable demand flows beyond retail channels. This institutionalization not only reduces dependence on individual consumer sentiment but also accelerates standardization of verification protocols, strengthening credibility. Over time, institutional adoption is projected to act as a flywheel, reinforcing brand legitimacy, improving data availability, and enabling more precise carbon footprint calculations across the value chain.

Variability in Methodology and Consumer Trust Risk

A major restraint is being presented by methodological variability in footprint measurement, which undermines comparability and risks consumer fatigue. Inconsistent boundaries whether farm-to-fork or cradle-to-retail create divergent results, complicating the establishment of a unified benchmark. This opacity leaves consumers uncertain and regulators cautious, limiting willingness to scale adoption.

Moreover, the proliferation of self-declared claims has heightened the risk of greenwashing, eroding trust among early adopters. If methodological clarity and standard verification frameworks are not advanced, competitive differentiation may collapse into pricing battles, stalling premiumization. To counter this, consensus-driven protocols and digital transparency tools are expected to be critical in rebuilding confidence and sustaining long-term growth trajectories.

Independent third-party verification is projected to remain the cornerstone of credibility, ensuring that consumers, retailers, and policymakers can rely on consistent and transparent carbon-labeling standards.
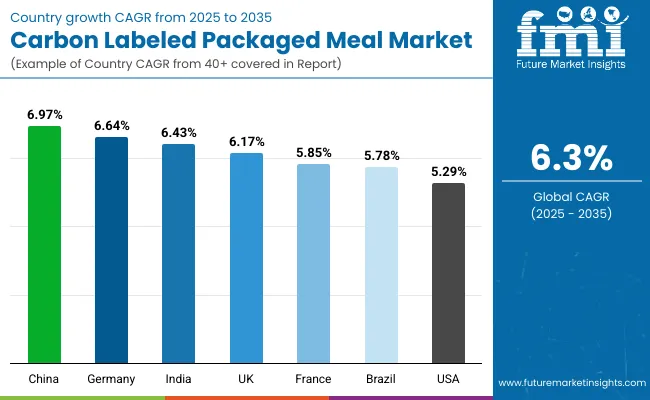
Analysis of Carbon Labeled Packaged Meal Market by Key Countries

Carbon Labeled Packaged Meal Market By Country

Country CAGR
China 6.97%
India 6.43%
Germany 6.64%
France 5.85%
UK 6.17%
USA 5.29%
Brazil 5.78%

The global carbon-labeled packaged meal market reveals clear disparities in adoption speed, shaped by regulatory frameworks, consumer engagement, and the maturity of retail ecosystems. Asia-Pacific is projected to emerge as the most dynamic growth cluster, anchored by China at 6.97% CAGR and India at 6.43% CAGR. Expansion is expected to be fueled by policy-led sustainability agendas, rapid digitization of food retail, and urban demand for climate-conscious consumption. In China, pilot regulations on carbon disclosure are anticipated to accelerate label adoption, while in India, momentum is expected from institutional procurement and rising penetration of organized retail.

Europe is projected to maintain a robust growth trajectory, led by Germany at 6.64% CAGR, the UK at 6.17%, and France at 5.85%. Progress in the region is expected to be underpinned by EU climate policies, retailer transparency commitments, and expanding demand from flexitarian and millennial consumers. The Rest of Europe is forecasted to expand its share, signaling diffusion beyond core Western markets.

North America is expected to post more moderate expansion, with the USA at 5.29% CAGR, reflecting maturity in packaged foods and a fragmented regulatory stance. Growth is anticipated to be supported primarily by private-label programs, subscription meal services, and institutional food procurement embedding carbon labeling as a compliance requirement.
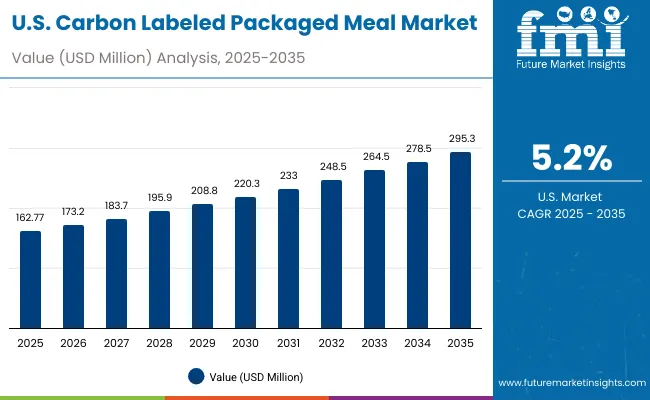
Sales Outlook for Carbon Labeled Packaged Meal Market in the United States

Carbon Labeled Packaged Meal Market Usa

Year USA Carbon Labeled Packaged Meal Market (USD Million)
2025 162.77
2026 173.2
2027 183.7
2028 195.9
2029 208.8
2030 220.3
2031 233.0
2032 248.5
2033 264.5
2034 278.5
2035 295.3

The carbon-labeled packaged meal market in the United States is projected to expand from USD 162.8 Million in 2025 to USD 295.3 Million by 2035, reflecting a steady 6.1% CAGR. Growth is expected to be underpinned by institutional procurement in schools, hospitals, and corporate canteens, where carbon transparency is being embedded into compliance frameworks. Private-label initiatives by major retailers are forecasted to drive wider affordability, while subscription meal platforms are likely to reinforce premium positioning through digital transparency tools.

Year-on-year growth patterns indicate peak expansion around 2028-2033, with annual rates exceeding 6.4%, signaling stronger consumer uptake as third-party verified certifications gain traction. Packaging innovation, particularly recyclable and compostable solutions, is anticipated to add further credibility to USA offerings. Although regulatory adoption is more fragmented than in Europe, competitive differentiation is expected to shift toward verified claims, institutional partnerships, and integration with digital disclosure platforms.

  • Institutional food procurement is embedding carbon transparency into purchasing criteria.
  • Retail private-label and subscription services are reinforcing affordability and credibility.
  • Verified labeling and sustainable packaging are projected to define long-term trust in USA adoption.

Growth and Expansion Outlook for Carbon Labeled Packaged Meal Market in the United Kingdom

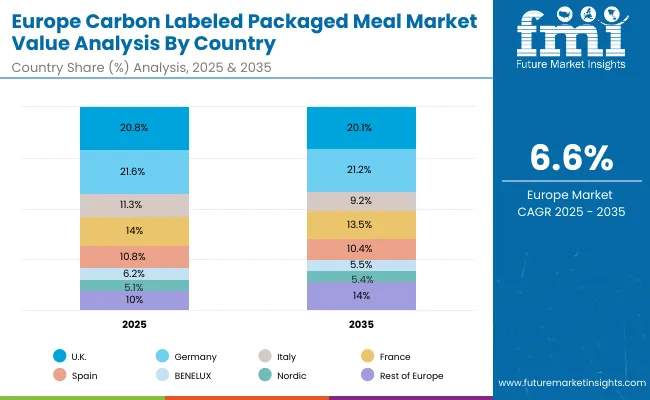
The carbon-labeled packaged meal market in the United Kingdom is forecasted to expand at a CAGR of 6.17% between 2025 and 2035. Market share is projected to soften slightly from 20.8% in 2025 to 20.1% in 2035, yet the UK will remain a European leader. The shift is expected to reflect stronger growth in Rest of Europe while the UK consolidates its base through regulatory and retailer-driven programs.

Expansion will be supported by supermarket mandates for verified carbon labels, government-backed climate disclosure frameworks, and millennial/Gen Z consumer alignment with transparency in food purchasing. Institutional buyers, including universities and healthcare providers, are expected to play a decisive role in embedding labeled meals into public procurement. Premium growth is anticipated from plant-based and hybrid protein categories, which align with evolving flexitarian preferences and resonate with the UK’s broader climate-conscious food culture.

  • Carbon-labeled meals to grow at 6.17% CAGR (2025-2035).
  • Market share projected to edge down from 20.8% → 20.1%.
  • Retailer mandates and procurement policies driving steady adoption.
  • Plant-based and hybrid meals to lead premium positioning.

Growth and Expansion Outlook for Carbon Labeled Packaged Meal Market in India

The carbon-labeled packaged meal market in India is projected to grow at a CAGR of 6.43% from 2025 to 2035, positioning the country among the fastest-expanding globally. Growth is expected to be anchored in urban centers where organized retail and e-commerce platforms are enabling access to transparent, labeled offerings. Institutional procurement, particularly in corporate canteens and educational settings, is expected to accelerate adoption as sustainability metrics are introduced into compliance frameworks.

Affordability of labeled meals remains a critical lever, with private-label and D2C subscription platforms likely to capture early momentum. Expansion in plant-based and vegetarian options is forecasted to resonate strongly with dietary patterns in India, ensuring faster acceptance compared to heavily meat-oriented regions. Packaging innovations, particularly compostable and recyclable formats, are anticipated to gain traction as consumers align sustainability with affordability.

  • Carbon-labeled meals to expand at 6.43% CAGR (2025-2035).
  • Urban organized retail and e-commerce drive accessibility.
  • Institutional canteens and education fuel procurement demand.
  • Plant-based and vegetarian offerings provide natural alignment.

Sales Outlook for Carbon Labeled Packaged Meal Market in China

The carbon-labeled packaged meal market in China is forecasted to achieve the fastest CAGR globally, at 6.97% between 2025 and 2035. Expansion is expected to be powered by strong urban consumer demand, regulatory encouragement of climate transparency, and rapid digitalization of grocery platforms. The country’s leadership in sustainability reporting and large-scale pilot programs for carbon disclosure is anticipated to create significant momentum in verified labeling.

Growth is likely to be concentrated in metropolitan hubs where climate-conscious younger demographics are driving premium consumption patterns. E-commerce channels are expected to play a defining role, integrating carbon labeling visibility directly into purchase filters and product comparisons. Challenges remain around methodology standardization, but wider adoption of government-supported frameworks is expected to mitigate consumer skepticism. Institutional buyers and large retailers are projected to institutionalize verified carbon labels across food portfolios, sustaining growth beyond retail shelves.
  • China projected to post 6.97% CAGR, fastest globally.
  • Policy-led pilots for disclosure accelerate adoption.
  • E-commerce platforms integrate carbon transparency at scale.
  • Youth-driven urban demand anchors premium uptake.

In-depth Analysis of Carbon Labeled Packaged Meal Market in Germany

Carbon Labeled Packaged Meal Market Europe

Country 2025
UK 20.80%
Germany 21.65%
Italy 11.37%
France 14.09%
Spain 10.84%
BENELUX 6.24%
Nordic 5.17%
Rest of Europe 10%
Country 2035
UK 20.14%
Germany 21.26%
Italy 9.24%
France 13.57%
Spain 10.43%
BENELUX 5.50%
Nordic 5.47%
Rest of Europe 14%

The carbon-labeled packaged meal market in Germany is expected to expand at a CAGR of 6.64% between 2025 and 2035, consolidating its role as the largest European market. Market share is forecasted to remain high, at 21.6% in 2025 and only marginally easing to 21.3% by 2035. The country’s leadership will be sustained by EU-driven sustainability regulation, national climate targets, and retailer commitments to third-party verification. Strong flexitarian and vegetarian consumption patterns are expected to amplify demand for plant-based carbon-labeled meals, which align with consumer values and health priorities.

Institutional procurement is projected to be a central lever, as German schools, hospitals, and corporates integrate climate footprint disclosures into food purchasing. Packaging alignment with recyclability and biodegradability mandates is likely to reinforce consumer trust. Premium differentiation will continue to be anchored in verified labeling, ensuring Germany’s role as a European benchmark for carbon-labeled packaged meals.
  • Germany forecasted to post 6.64% CAGR (2025-2035).
  • Market share stable: 21.65% → 21.26%.
  • EU regulatory push drives verifiable labeling.
  • Plant-based meals and institutional procurement anchor growth.

Growth Outlook for Carbon Labeled Packaged Meal Market in Japan

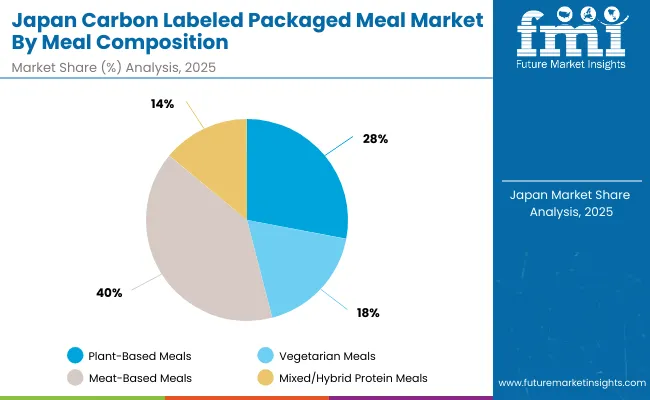
Carbon Labeled Packaged Meal Market Japan

Japan Meal Composition 2025 Share
Plant-Based Meals 28%
Vegetarian Meals 18%
Meat-Based Meals 40%
Mixed/Hybrid Protein Meals 14%
Japan Meal Composition CAGR
Plant-Based Meals 7.00%
Vegetarian Meals 6.50%
Meat-Based Meals 5.90%
Mixed/Hybrid Protein Meals 6.20%

The Carbon-Labeled Packaged Meal Market in Japan is projected to be shaped strongly by meal composition preferences in 2025, with meat-based meals holding the largest share at 40%, followed by plant-based meals at 28%. However, growth momentum is expected to shift toward plant-based meals, which are forecasted to expand at the highest CAGR of 7.0%, reflecting consumer demand for sustainable, low-carbon protein alternatives. Vegetarian meals are anticipated to follow with a CAGR of 6.5%, driven by health-conscious urban demographics.

The gradual expansion of hybrid protein meals (6.2% CAGR) highlights Japan’s transition toward flexible diets that balance traditional meat consumption with plant proteins. While meat-based meals retain dominance, their CAGR of 5.9% indicates a relative slowdown, suggesting a reallocation of consumer expenditure toward more eco-friendly meal options. With regulatory pressure on carbon transparency and growing consumer awareness of climate impact, the Japanese market is expected to pivot steadily toward plant-forward dietary solutions.
  • Meat-based meals dominate in 2025 with a 40% share but show slower growth.
  • Plant-based meals lead in growth momentum at 7.0% CAGR.
  • Hybrid protein meals gain traction as a transition category.
  • Market expansion is supported by sustainability mandates and evolving consumer preferences.

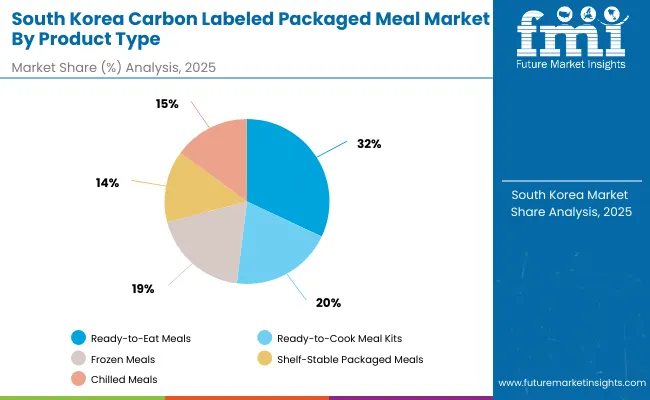
Opportunity Analysis of South Korea Carbon Labeled Packaged Meal Market

Carbon Labeled Packaged Meal Market South Korea

South Korea Product Type 2025 Share
Ready-to-Eat Meals 32%
Ready-to-Cook Meal Kits 20%
Frozen Meals 19%
Shelf-Stable Packaged Meals 14%
Chilled Meals 15%
South Korea Product Type CAGR
Ready-to-Eat Meals 6.80%
Ready-to-Cook Meal Kits 7.20%
Frozen Meals 6.50%
Shelf-Stable Packaged Meals 6.00%
Chilled Meals 6.60%

The Carbon-Labeled Packaged Meal Market in South Korea is expected to be led by ready-to-eat meals, which account for the largest share of 32% in 2025, reflecting strong consumer preference for convenience and time efficiency. However, the fastest growth trajectory is forecasted for ready-to-cook meal kits, with a CAGR of 7.2%, supported by rising household experimentation, premiumization, and sustainability-driven packaging innovations.

Frozen meals represent a 19% share in 2025 and are projected to expand at 6.5% CAGR, fueled by demand for extended shelf life and energy-efficient cold storage solutions. Meanwhile, chilled meals (15% share, 6.6% CAGR) highlight the shift toward freshness and localized food sourcing, with carbon labeling reinforcing transparency for health-conscious buyers. Shelf-stable packaged meals, although smaller in share (14%) and slower in growth (6.0% CAGR), remain relevant for rural distribution and disaster-resilient food supply chains.

Growing consumer emphasis on eco-friendly packaging, digital traceability, and balanced nutrition is expected to redefine South Korea’s competitive landscape, with hybrid models blending convenience and sustainability gaining greater traction.
  • Ready-to-eat meals dominate in 2025 with a 32% market share.
  • Ready-to-cook meal kits record the strongest CAGR at 7.2%.
  • Frozen and chilled meals expand steadily as freshness and longevity balance demand.
  • Shelf-stable meals sustain niche adoption in specific segments despite slower growth.

Competitive Landscape of Carbon Labeled Packaged Meal Market

Carbon Labeled Packaged Meal Market By Company

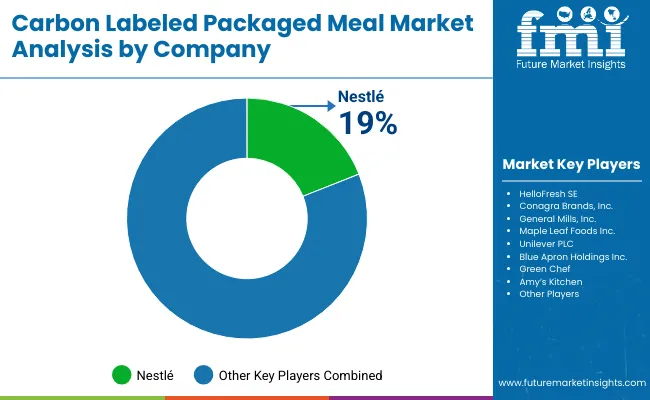
The Carbon-Labeled Packaged Meal Market is moderately fragmented, with global leaders, regional innovators, and niche-focused sustainability specialists competing across diverse consumer segments. Global food companies such as Nestlé, Unilever, and Danone hold significant market share, driven by their expansive distribution networks, portfolio diversity, and early adoption of carbon footprint transparency. Their strategies are being shaped by growing consumer preference for low-impact meals, with emphasis placed on carbon labeling as a brand-differentiation tool aligned with corporate ESG commitments.

Established mid-sized players, including Oatly, Amy’s Kitchen, and Quorn Foods, are leveraging plant-based and vegetarian offerings to strengthen their market positions. Their growth is being accelerated by partnerships with retailers, digital-first distribution channels, and consumer demand for measurable sustainability credentials. These players are increasingly integrating carbon-label certifications as a competitive necessity rather than an optional attribute.

Specialized providers, such as regional organic meal brands and sustainability-driven startups, focus on carbon-labeled ready-to-eat and hybrid protein meals that appeal to eco-conscious urban populations. Their strength lies in agility, localized sourcing, and transparent storytelling, which resonate strongly with younger demographics.

Competitive differentiation is shifting away from scale alone toward credibility in carbon disclosure, lifecycle impact reduction, and integration with digital platforms that allow consumers to track climate footprints in real time.

Key Developments in Carbon Labeled Packaged Meal Market

  • Garden Gourmet Launch (February 2025):In February 2025, Nestlé’s Garden Gourmet brand unveiled its Rote Bete Falafel across European markets, signaling innovation in plant-based carbon-labeled meals. This launch, blending beetroot and chickpeas, was positioned as a step toward diversifying sustainable meal portfolios and meeting rising demand for climate-conscious food choices.
  • HelloFresh’s Political Advocacy (July 2024):In July 2024, HelloFresh co-hosted a parliamentary event in Germany through the Together for Carbon Labelling initiative, advancing the agenda for unified food carbon-labeling standards. This initiative was positioned to strengthen regulatory frameworks, enhance consumer trust, and accelerate industry-wide adoption of carbon-labeled packaged meals.

Scope of the Report

Item Value
Quantitative Units USD 1,251.9 Million
Component Ready-to-Eat Meals, Ready-to-Cook Kits, Frozen Meals, Shelf-Stable Meals, Chilled Meals
Certification Type Government-Certified Labels, Third-Party Verified Labels, Self-Declared Labels
Meal Composition Plant-Based Meals, Vegetarian Meals, Meat-Based Meals, Mixed/Hybrid Protein Meals
End-use Industry Retail Chains & Supermarkets, Online Meal Delivery Platforms, Foodservice Operators, Healthcare Nutrition Providers, Corporate & Institutional Catering
Regions Covered North America, Europe, East Asia, South Asia & Pacific, Latin America, Middle East & Africa
Country Covered United States, Canada, Germany, France, United Kingdom, China, Japan, India, Brazil, South Korea
Key Companies Profiled Nestlé S.A., HelloFresh SE, Conagra Brands, Inc., General Mills, Inc., Maple Leaf Foods Inc., Unilever PLC, Blue Apron Holdings Inc., Green Chef, Amy’s Kitchen
Additional Attributes Dollar sales by meal type, certification type, and end-use industry; increasing adoption of digital carbon labels; eco-conscious purchasing behavior shaping innovation; plant-based and hybrid meals gaining prominence; competitive advantage linked to transparent labeling, QR-based traceability, and sustainability-driven reformulations

Key Segments

By Product Type:

  • Ready-to-Eat Meals
  • Ready-to-Cook Meal Kits
  • Frozen Meals
  • Shelf-Stable Packaged Meals
  • Chilled Meals

By Labeling Certification Type:

  • Government-Certified Carbon Labels
  • Third-Party Verified (e.g., Carbon Trust, My Emissions)
  • Self-Declared Carbon Footprint Labels

By Meal Composition:

  • Plant-Based Meals
  • Vegetarian Meals
  • Meat-Based Meals
  • Mixed/Hybrid Protein Meals

By Sales Channel:

  • Retail (Supermarkets, Convenience Stores)
  • Online Retail (eCommerce platforms, D2C websites)
  • Foodservice/Institutional (Corporate Canteens, Schools, Hospitals)
  • Subscription-Based Meal Services

By Packaging Type:

  • Compostable/Biodegradable
  • Recyclable Plastic
  • Reusable Containers
  • Standard Single-Use Plastic

By Consumer Segment:

  • Climate-Conscious Consumers
  • Flexitarians & Vegetarians
  • Millennials & Gen Z
  • Health-Focused Consumers
  • Institutional Buyers

By Region:

  • North America
  • Latin America
  • Europe
  • East Asia
  • South Asia & Pacific
  • Middle East and Africa

Table of Content

  1. Executive Summary
    • Global Market Outlook
    • Demand-side Trends
    • Supply-side Trends
    • Technology Roadmap Analysis
    • Analysis and Recommendations
  2. Market Overview
    • Market Coverage / Taxonomy
    • Market Definition / Scope / Limitations
  3. Market Background
    • Market Dynamics
      • Drivers
      • Restraints
      • Opportunity
      • Trends
    • Scenario Forecast
      • Demand in Optimistic Scenario
      • Demand in Likely Scenario
      • Demand in Conservative Scenario
    • Opportunity Map Analysis
    • Product Life Cycle Analysis
    • Supply Chain Analysis
    • Investment Feasibility Matrix
    • Value Chain Analysis
    • PESTLE and Porter’s Analysis
    • Regulatory Landscape
    • Regional Parent Market Outlook
    • Production and Consumption Statistics
    • Import and Export Statistics
  4. Global Market Analysis 2020 to 2024 and Forecast, 2025 to 2035
    • Historical Market Size Value (USD Million) Analysis, 2020 to 2024
    • Current and Future Market Size Value (USD Million) Projections, 2025 to 2035
      • Y-o-Y Growth Trend Analysis
      • Absolute $ Opportunity Analysis
  5. Global Market Pricing Analysis 2020 to 2024 and Forecast 2025 to 2035
  6. Global Market Analysis 2020 to 2024 and Forecast 2025 to 2035, By Product Type
    • Introduction / Key Findings
    • Historical Market Size Value (USD Million) Analysis By Product Type, 2020 to 2024
    • Current and Future Market Size Value (USD Million) Analysis and Forecast By Product Type, 2025 to 2035
      • Ready-to-Eat Meals
      • Ready-to-Cook Meal Kits
      • Frozen Meals
      • Shelf-Stable Packaged Meals
      • Chilled Meals
    • Y-o-Y Growth Trend Analysis By Product Type, 2020 to 2024
    • Absolute $ Opportunity Analysis By Product Type, 2025 to 2035
  7. Global Market Analysis 2020 to 2024 and Forecast 2025 to 2035, By Labeling Certification Type
    • Introduction / Key Findings
    • Historical Market Size Value (USD Million) Analysis By Labeling Certification Type, 2020 to 2024
    • Current and Future Market Size Value (USD Million) Analysis and Forecast By Labeling Certification Type, 2025 to 2035
      • Government-Certified Carbon Labels
      • Third-Party Verified (e.g., Carbon Trust, My Emissions)
      • Self-Declared Carbon Footprint Labels
    • Y-o-Y Growth Trend Analysis By Labeling Certification Type, 2020 to 2024
    • Absolute $ Opportunity Analysis By Labeling Certification Type, 2025 to 2035
  8. Global Market Analysis 2020 to 2024 and Forecast 2025 to 2035, By Meal Composition
    • Introduction / Key Findings
    • Historical Market Size Value (USD Million) Analysis By Meal Composition, 2020 to 2024
    • Current and Future Market Size Value (USD Million) Analysis and Forecast By Meal Composition, 2025 to 2035
      • Plant-Based Meals
      • Vegetarian Meals
      • Meat-Based Meals
      • Mixed/Hybrid Protein Meals
    • Y-o-Y Growth Trend Analysis By Meal Composition, 2020 to 2024
    • Absolute $ Opportunity Analysis By Meal Composition, 2025 to 2035
  9. Global Market Analysis 2020 to 2024 and Forecast 2025 to 2035, By Sales Channel
    • Introduction / Key Findings
    • Historical Market Size Value (USD Million) Analysis By Sales Channel, 2020 to 2024
    • Current and Future Market Size Value (USD Million) Analysis and Forecast By Sales Channel, 2025 to 2035
      • Retail (Supermarkets, Convenience Stores)
      • Online Retail (eCommerce platforms, D2C websites)
      • Foodservice/Institutional (Corporate Canteens, Schools, Hospitals)
      • Subscription-Based Meal Services
    • Y-o-Y Growth Trend Analysis By Sales Channel, 2020 to 2024
    • Absolute $ Opportunity Analysis By Sales Channel, 2025 to 2035
  10. Global Market Analysis 2020 to 2024 and Forecast 2025 to 2035, By Packaging Type
    • Introduction / Key Findings
    • Historical Market Size Value (USD Million) Analysis By Packaging Type, 2020 to 2024
    • Current and Future Market Size Value (USD Million) Analysis and Forecast By Packaging Type, 2025 to 2035
      • Compostable/Biodegradable
      • Recyclable Plastic
      • Reusable Containers
      • Standard Single-Use Plastic
    • Y-o-Y Growth Trend Analysis By Packaging Type, 2020 to 2024
    • Absolute $ Opportunity Analysis By Packaging Type, 2025 to 2035
  11. Global Market Analysis 2020 to 2024 and Forecast 2025 to 2035, By Consumer Segment
    • Introduction / Key Findings
    • Historical Market Size Value (USD Million) Analysis By Consumer Segment, 2020 to 2024
    • Current and Future Market Size Value (USD Million) Analysis and Forecast By Consumer Segment, 2025 to 2035
      • Climate-Conscious Consumers
      • Flexitarians & Vegetarians
      • Millennials & Gen Z
      • Health-Focused Consumers
      • Institutional Buyers
    • Y-o-Y Growth Trend Analysis By Consumer Segment, 2020 to 2024
    • Absolute $ Opportunity Analysis By Consumer Segment, 2025 to 2035
  12. Global Market Analysis 2020 to 2024 and Forecast 2025 to 2035, By Region
    • Introduction
    • Historical Market Size Value (USD Million) Analysis By Region, 2020 to 2024
    • Current Market Size Value (USD Million) Analysis and Forecast By Region, 2025 to 2035
      • North America
      • Latin America
      • Europe
      • East Asia
      • South Asia & Pacific
      • Middle East and Africa
    • Market Attractiveness Analysis By Region
  13. North America Market Analysis 2020 to 2024 and Forecast 2025 to 2035, By Country
    • Historical Market Size Value (USD Million) Trend Analysis By Market Taxonomy, 2020 to 2024
    • Market Size Value (USD Million) Forecast By Market Taxonomy, 2025 to 2035
      • By Country
        • USA
        • Canada
      • By Product Type
      • By Labeling Certification Type
      • By Meal Composition
      • By Sales Channel
      • By Packaging Type
      • By Consumer Segment
    • Market Attractiveness Analysis
      • By Country
      • By Product Type
      • By Labeling Certification Type
      • By Meal Composition
      • By Sales Channel
      • By Packaging Type
      • By Consumer Segment
    • Key Takeaways
  14. Latin America Market Analysis 2020 to 2024 and Forecast 2025 to 2035, By Country
    • Historical Market Size Value (USD Million) Trend Analysis By Market Taxonomy, 2020 to 2024
    • Market Size Value (USD Million) Forecast By Market Taxonomy, 2025 to 2035
      • By Country
        • Brazil
        • Mexico
        • Colombia
        • Rest of Latin America
      • By Product Type
      • By Labeling Certification Type
      • By Meal Composition
      • By Sales Channel
      • By Packaging Type
      • By Consumer Segment
    • Market Attractiveness Analysis
      • By Country
      • By Product Type
      • By Labeling Certification Type
      • By Meal Composition
      • By Sales Channel
      • By Packaging Type
      • By Consumer Segment
    • Key Takeaways
  15. Europe Market Analysis 2020 to 2024 and Forecast 2025 to 2035, By Country
    • Historical Market Size Value (USD Million) Trend Analysis By Market Taxonomy, 2020 to 2024
    • Market Size Value (USD Million) Forecast By Market Taxonomy, 2025 to 2035
      • By Country
        • Germany
        • UK
        • France
        • Italy
        • Spain
        • Belgium
        • Netherlands
        • Nordic
        • Switzerland
        • Russia
        • Poland
        • Rest of Europe
      • By Product Type
      • By Labeling Certification Type
      • By Meal Composition
      • By Sales Channel
      • By Packaging Type
      • By Consumer Segment
    • Market Attractiveness Analysis
      • By Country
      • By Product Type
      • By Labeling Certification Type
      • By Meal Composition
      • By Sales Channel
      • By Packaging Type
      • By Consumer Segment
    • Key Takeaways
  16. East Asia Market Analysis 2020 to 2024 and Forecast 2025 to 2035, By Country
    • Historical Market Size Value (USD Million) Trend Analysis By Market Taxonomy, 2020 to 2024
    • Market Size Value (USD Million) Forecast By Market Taxonomy, 2025 to 2035
      • By Country
        • China
        • Japan
        • South Korea
      • By Product Type
      • By Labeling Certification Type
      • By Meal Composition
      • By Sales Channel
      • By Packaging Type
      • By Consumer Segment
    • Market Attractiveness Analysis
      • By Country
      • By Product Type
      • By Labeling Certification Type
      • By Meal Composition
      • By Sales Channel
      • By Packaging Type
      • By Consumer Segment
    • Key Takeaways
  17. South Asia & Pacific Market Analysis 2020 to 2024 and Forecast 2025 to 2035, By Country
    • Historical Market Size Value (USD Million) Trend Analysis By Market Taxonomy, 2020 to 2024
    • Market Size Value (USD Million) Forecast By Market Taxonomy, 2025 to 2035
      • By Country
        • India
        • Thailand
        • Malaysia
        • Indonesia
        • Singapore
        • Vietnam
        • Australia
        • New Zealand
        • Rest of South Asia
      • By Product Type
      • By Labeling Certification Type
      • By Meal Composition
      • By Sales Channel
      • By Packaging Type
      • By Consumer Segment
    • Market Attractiveness Analysis
      • By Country
      • By Product Type
      • By Labeling Certification Type
      • By Meal Composition
      • By Sales Channel
      • By Packaging Type
      • By Consumer Segment
    • Key Takeaways
  18. Middle East and Africa Market Analysis 2020 to 2024 and Forecast 2025 to 2035, By Country
    • Historical Market Size Value (USD Million) Trend Analysis By Market Taxonomy, 2020 to 2024
    • Market Size Value (USD Million) Forecast By Market Taxonomy, 2025 to 2035
      • By Country
        • Turkey
        • UAE
        • Saudi Arabia
        • Israel
        • Other GCC Countries
        • North Africa
        • South Africa
      • By Product Type
      • By Labeling Certification Type
      • By Meal Composition
      • By Sales Channel
      • By Packaging Type
      • By Consumer Segment
    • Market Attractiveness Analysis
      • By Country
      • By Product Type
      • By Labeling Certification Type
      • By Meal Composition
      • By Sales Channel
      • By Packaging Type
      • By Consumer Segment
    • Key Takeaways
  19. Key Countries Market Analysis
    • USA
      • Pricing Analysis
      • Market Share Analysis, 2024
        • By Product Type
        • By Labeling Certification Type
        • By Meal Composition
        • By Sales Channel
        • By Packaging Type
        • By Consumer Segment
    • Canada
      • Pricing Analysis
      • Market Share Analysis, 2024
        • By Product Type
        • By Labeling Certification Type
        • By Meal Composition
        • By Sales Channel
        • By Packaging Type
        • By Consumer Segment
    • Brazil
      • Pricing Analysis
      • Market Share Analysis, 2024
        • By Product Type
        • By Labeling Certification Type
        • By Meal Composition
        • By Sales Channel
        • By Packaging Type
        • By Consumer Segment
    • Mexico
      • Pricing Analysis
      • Market Share Analysis, 2024
        • By Product Type
        • By Labeling Certification Type
        • By Meal Composition
        • By Sales Channel
        • By Packaging Type
        • By Consumer Segment
    • Colombia
      • Pricing Analysis
      • Market Share Analysis, 2024
        • By Product Type
        • By Labeling Certification Type
        • By Meal Composition
        • By Sales Channel
        • By Packaging Type
        • By Consumer Segment
    • Rest of Latin America
      • Pricing Analysis
      • Market Share Analysis, 2024
        • By Product Type
        • By Labeling Certification Type
        • By Meal Composition
        • By Sales Channel
        • By Packaging Type
        • By Consumer Segment
    • Germany
      • Pricing Analysis
      • Market Share Analysis, 2024
        • By Product Type
        • By Labeling Certification Type
        • By Meal Composition
        • By Sales Channel
        • By Packaging Type
        • By Consumer Segment
    • UK
      • Pricing Analysis
      • Market Share Analysis, 2024
        • By Product Type
        • By Labeling Certification Type
        • By Meal Composition
        • By Sales Channel
        • By Packaging Type
        • By Consumer Segment
    • France
      • Pricing Analysis
      • Market Share Analysis, 2024
        • By Product Type
        • By Labeling Certification Type
        • By Meal Composition
        • By Sales Channel
        • By Packaging Type
        • By Consumer Segment
    • Italy
      • Pricing Analysis
      • Market Share Analysis, 2024
        • By Product Type
        • By Labeling Certification Type
        • By Meal Composition
        • By Sales Channel
        • By Packaging Type
        • By Consumer Segment
    • Spain
      • Pricing Analysis
      • Market Share Analysis, 2024
        • By Product Type
        • By Labeling Certification Type
        • By Meal Composition
        • By Sales Channel
        • By Packaging Type
        • By Consumer Segment
    • Belgium
      • Pricing Analysis
      • Market Share Analysis, 2024
        • By Product Type
        • By Labeling Certification Type
        • By Meal Composition
        • By Sales Channel
        • By Packaging Type
        • By Consumer Segment
    • Netherlands
      • Pricing Analysis
      • Market Share Analysis, 2024
        • By Product Type
        • By Labeling Certification Type
        • By Meal Composition
        • By Sales Channel
        • By Packaging Type
        • By Consumer Segment
    • Nordic
      • Pricing Analysis
      • Market Share Analysis, 2024
        • By Product Type
        • By Labeling Certification Type
        • By Meal Composition
        • By Sales Channel
        • By Packaging Type
        • By Consumer Segment
    • Switzerland
      • Pricing Analysis
      • Market Share Analysis, 2024
        • By Product Type
        • By Labeling Certification Type
        • By Meal Composition
        • By Sales Channel
        • By Packaging Type
        • By Consumer Segment
    • Russia
      • Pricing Analysis
      • Market Share Analysis, 2024
        • By Product Type
        • By Labeling Certification Type
        • By Meal Composition
        • By Sales Channel
        • By Packaging Type
        • By Consumer Segment
    • Poland
      • Pricing Analysis
      • Market Share Analysis, 2024
        • By Product Type
        • By Labeling Certification Type
        • By Meal Composition
        • By Sales Channel
        • By Packaging Type
        • By Consumer Segment
    • Rest of Europe
      • Pricing Analysis
      • Market Share Analysis, 2024
        • By Product Type
        • By Labeling Certification Type
        • By Meal Composition
        • By Sales Channel
        • By Packaging Type
        • By Consumer Segment
    • China
      • Pricing Analysis
      • Market Share Analysis, 2024
        • By Product Type
        • By Labeling Certification Type
        • By Meal Composition
        • By Sales Channel
        • By Packaging Type
        • By Consumer Segment
    • Japan
      • Pricing Analysis
      • Market Share Analysis, 2024
        • By Product Type
        • By Labeling Certification Type
        • By Meal Composition
        • By Sales Channel
        • By Packaging Type
        • By Consumer Segment
    • South Korea
      • Pricing Analysis
      • Market Share Analysis, 2024
        • By Product Type
        • By Labeling Certification Type
        • By Meal Composition
        • By Sales Channel
        • By Packaging Type
        • By Consumer Segment
    • India
      • Pricing Analysis
      • Market Share Analysis, 2024
        • By Product Type
        • By Labeling Certification Type
        • By Meal Composition
        • By Sales Channel
        • By Packaging Type
        • By Consumer Segment
    • Thailand
      • Pricing Analysis
      • Market Share Analysis, 2024
        • By Product Type
        • By Labeling Certification Type
        • By Meal Composition
        • By Sales Channel
        • By Packaging Type
        • By Consumer Segment
    • Malaysia
      • Pricing Analysis
      • Market Share Analysis, 2024
        • By Product Type
        • By Labeling Certification Type
        • By Meal Composition
        • By Sales Channel
        • By Packaging Type
        • By Consumer Segment
    • Indonesia
      • Pricing Analysis
      • Market Share Analysis, 2024
        • By Product Type
        • By Labeling Certification Type
        • By Meal Composition
        • By Sales Channel
        • By Packaging Type
        • By Consumer Segment
    • Singapore
      • Pricing Analysis
      • Market Share Analysis, 2024
        • By Product Type
        • By Labeling Certification Type
        • By Meal Composition
        • By Sales Channel
        • By Packaging Type
        • By Consumer Segment
    • Vietnam
      • Pricing Analysis
      • Market Share Analysis, 2024
        • By Product Type
        • By Labeling Certification Type
        • By Meal Composition
        • By Sales Channel
        • By Packaging Type
        • By Consumer Segment
    • Australia
      • Pricing Analysis
      • Market Share Analysis, 2024
        • By Product Type
        • By Labeling Certification Type
        • By Meal Composition
        • By Sales Channel
        • By Packaging Type
        • By Consumer Segment
    • New Zealand
      • Pricing Analysis
      • Market Share Analysis, 2024
        • By Product Type
        • By Labeling Certification Type
        • By Meal Composition
        • By Sales Channel
        • By Packaging Type
        • By Consumer Segment
    • Rest of South Asia
      • Pricing Analysis
      • Market Share Analysis, 2024
        • By Product Type
        • By Labeling Certification Type
        • By Meal Composition
        • By Sales Channel
        • By Packaging Type
        • By Consumer Segment
  20. Market Structure Analysis
    • Competition Dashboard
    • Competition Benchmarking
    • Market Share Analysis of Top Players
      • By Regional
      • By Product Type
      • By Labeling Certification Type
      • By Meal Composition
      • By Sales Channel
      • By Packaging Type
      • By Consumer Segment
  21. Competition Analysis
    • Competition Deep Dive
      • Allplants
        • Overview
        • Product Portfolio
        • Profitability by Market Segments (Product/Age /Sales Channel/Region)
        • Sales Footprint
        • Strategy Overview
        • Quorn Foods
        • HelloFresh (Green Chef, Factor)
        • My Emissions (partnerships with private-label brands)
        • Nestlé (Garden Gourmet, Lean Cuisine - carbon-labeled variants)
    • Assumptions & Acronyms Used
    • Research Methodology

List of Tables

  • Table 1: Global Market Value (USD Million) Forecast by Region, 2020-2035
  • Table 2: Global Market Value (USD Million) Forecast by Product Type, 2020-2035
  • Table 3: Global Market Value (USD Million) Forecast by Labeling Certification Type, 2020-2035
  • Table 4: Global Market Value (USD Million) Forecast by Meal Composition, 2020-2035
  • Table 5: Global Market Value (USD Million) Forecast by Sales Channel, 2020-2035
  • Table 6: Global Market Value (USD Million) Forecast by Packaging Type, 2020-2035
  • Table 7: Global Market Value (USD Million) Forecast by Consumer Segment, 2020-2035
  • Table 8: North America Market Value (USD Million) Forecast by Country, 2020-2035
  • Table 9: North America Market Value (USD Million) Forecast by Product Type, 2020-2035
  • Table 10: North America Market Value (USD Million) Forecast by Labeling Certification Type, 2020-2035
  • Table 11: North America Market Value (USD Million) Forecast by Meal Composition, 2020-2035
  • Table 12: North America Market Value (USD Million) Forecast by Sales Channel, 2020-2035
  • Table 13: North America Market Value (USD Million) Forecast by Packaging Type, 2020-2035
  • Table 14: North America Market Value (USD Million) Forecast by Consumer Segment, 2020-2035
  • Table 15: Latin America Market Value (USD Million) Forecast by Country, 2020-2035
  • Table 16: Latin America Market Value (USD Million) Forecast by Product Type, 2020-2035
  • Table 17: Latin America Market Value (USD Million) Forecast by Labeling Certification Type, 2020-2035
  • Table 18: Latin America Market Value (USD Million) Forecast by Meal Composition, 2020-2035
  • Table 19: Latin America Market Value (USD Million) Forecast by Sales Channel, 2020-2035
  • Table 20: Latin America Market Value (USD Million) Forecast by Packaging Type, 2020-2035
  • Table 21: Latin America Market Value (USD Million) Forecast by Consumer Segment, 2020-2035
  • Table 22: Europe Market Value (USD Million) Forecast by Country, 2020-2035
  • Table 23: Europe Market Value (USD Million) Forecast by Product Type, 2020-2035
  • Table 24: Europe Market Value (USD Million) Forecast by Labeling Certification Type, 2020-2035
  • Table 25: Europe Market Value (USD Million) Forecast by Meal Composition, 2020-2035
  • Table 26: Europe Market Value (USD Million) Forecast by Sales Channel, 2020-2035
  • Table 27: Europe Market Value (USD Million) Forecast by Packaging Type, 2020-2035
  • Table 28: Europe Market Value (USD Million) Forecast by Consumer Segment, 2020-2035
  • Table 29: East Asia Market Value (USD Million) Forecast by Country, 2020-2035
  • Table 30: East Asia Market Value (USD Million) Forecast by Product Type, 2020-2035
  • Table 31: East Asia Market Value (USD Million) Forecast by Labeling Certification Type, 2020-2035
  • Table 32: East Asia Market Value (USD Million) Forecast by Meal Composition, 2020-2035
  • Table 33: East Asia Market Value (USD Million) Forecast by Sales Channel, 2020-2035
  • Table 34: East Asia Market Value (USD Million) Forecast by Packaging Type, 2020-2035
  • Table 35: East Asia Market Value (USD Million) Forecast by Consumer Segment, 2020-2035
  • Table 36: South Asia & Pacific Market Value (USD Million) Forecast by Country, 2020-2035
  • Table 37: South Asia & Pacific Market Value (USD Million) Forecast by Product Type, 2020-2035
  • Table 38: South Asia & Pacific Market Value (USD Million) Forecast by Labeling Certification Type, 2020-2035
  • Table 39: South Asia & Pacific Market Value (USD Million) Forecast by Meal Composition, 2020-2035
  • Table 40: South Asia & Pacific Market Value (USD Million) Forecast by Sales Channel, 2020-2035
  • Table 41: South Asia & Pacific Market Value (USD Million) Forecast by Packaging Type, 2020-2035
  • Table 42: South Asia & Pacific Market Value (USD Million) Forecast by Consumer Segment, 2020-2035
  • Table 43: Middle East and Africa Market Value (USD Million) Forecast by Country, 2020-2035
  • Table 44: Middle East and Africa Market Value (USD Million) Forecast by Product Type, 2020-2035
  • Table 45: Middle East and Africa Market Value (USD Million) Forecast by Labeling Certification Type, 2020-2035
  • Table 46: Middle East and Africa Market Value (USD Million) Forecast by Meal Composition, 2020-2035
  • Table 47: Middle East and Africa Market Value (USD Million) Forecast by Sales Channel, 2020-2035
  • Table 48: Middle East and Africa Market Value (USD Million) Forecast by Packaging Type, 2020-2035
  • Table 49: Middle East and Africa Market Value (USD Million) Forecast by Consumer Segment, 2020-2035

List of Figures

  • Figure 1: Global Market Pricing Analysis
  • Figure 2: Global Market Value (USD Million) Forecast 2020-2035
  • Figure 3: Global Market Value Share and BPS Analysis by Product Type, 2025 and 2035
  • Figure 4: Global Market Y-o-Y Growth Comparison by Product Type, 2025-2035
  • Figure 5: Global Market Attractiveness Analysis by Product Type
  • Figure 6: Global Market Value Share and BPS Analysis by Labeling Certification Type, 2025 and 2035
  • Figure 7: Global Market Y-o-Y Growth Comparison by Labeling Certification Type, 2025-2035
  • Figure 8: Global Market Attractiveness Analysis by Labeling Certification Type
  • Figure 9: Global Market Value Share and BPS Analysis by Meal Composition, 2025 and 2035
  • Figure 10: Global Market Y-o-Y Growth Comparison by Meal Composition, 2025-2035
  • Figure 11: Global Market Attractiveness Analysis by Meal Composition
  • Figure 12: Global Market Value Share and BPS Analysis by Sales Channel, 2025 and 2035
  • Figure 13: Global Market Y-o-Y Growth Comparison by Sales Channel, 2025-2035
  • Figure 14: Global Market Attractiveness Analysis by Sales Channel
  • Figure 15: Global Market Value Share and BPS Analysis by Packaging Type, 2025 and 2035
  • Figure 16: Global Market Y-o-Y Growth Comparison by Packaging Type, 2025-2035
  • Figure 17: Global Market Attractiveness Analysis by Packaging Type
  • Figure 18: Global Market Value Share and BPS Analysis by Consumer Segment, 2025 and 2035
  • Figure 19: Global Market Y-o-Y Growth Comparison by Consumer Segment, 2025-2035
  • Figure 20: Global Market Attractiveness Analysis by Consumer Segment
  • Figure 21: Global Market Value (USD Million) Share and BPS Analysis by Region, 2025 and 2035
  • Figure 22: Global Market Y-o-Y Growth Comparison by Region, 2025-2035
  • Figure 23: Global Market Attractiveness Analysis by Region
  • Figure 24: North America Market Incremental $ Opportunity, 2025-2035
  • Figure 25: Latin America Market Incremental $ Opportunity, 2025-2035
  • Figure 26: Europe Market Incremental $ Opportunity, 2025-2035
  • Figure 27: East Asia Market Incremental $ Opportunity, 2025-2035
  • Figure 28: South Asia & Pacific Market Incremental $ Opportunity, 2025-2035
  • Figure 29: Middle East and Africa Market Incremental $ Opportunity, 2025-2035
  • Figure 30: North America Market Value Share and BPS Analysis by Country, 2025 and 2035
  • Figure 31: North America Market Value Share and BPS Analysis by Product Type, 2025 and 2035
  • Figure 32: North America Market Y-o-Y Growth Comparison by Product Type, 2025-2035
  • Figure 33: North America Market Attractiveness Analysis by Product Type
  • Figure 34: North America Market Value Share and BPS Analysis by Labeling Certification Type, 2025 and 2035
  • Figure 35: North America Market Y-o-Y Growth Comparison by Labeling Certification Type, 2025-2035
  • Figure 36: North America Market Attractiveness Analysis by Labeling Certification Type
  • Figure 37: North America Market Value Share and BPS Analysis by Meal Composition, 2025 and 2035
  • Figure 38: North America Market Y-o-Y Growth Comparison by Meal Composition, 2025-2035
  • Figure 39: North America Market Attractiveness Analysis by Meal Composition
  • Figure 40: North America Market Value Share and BPS Analysis by Sales Channel, 2025 and 2035
  • Figure 41: North America Market Y-o-Y Growth Comparison by Sales Channel, 2025-2035
  • Figure 42: North America Market Attractiveness Analysis by Sales Channel
  • Figure 43: North America Market Value Share and BPS Analysis by Packaging Type, 2025 and 2035
  • Figure 44: North America Market Y-o-Y Growth Comparison by Packaging Type, 2025-2035
  • Figure 45: North America Market Attractiveness Analysis by Packaging Type
  • Figure 46: North America Market Value Share and BPS Analysis by Consumer Segment, 2025 and 2035
  • Figure 47: North America Market Y-o-Y Growth Comparison by Consumer Segment, 2025-2035
  • Figure 48: North America Market Attractiveness Analysis by Consumer Segment
  • Figure 49: Latin America Market Value Share and BPS Analysis by Country, 2025 and 2035
  • Figure 50: Latin America Market Value Share and BPS Analysis by Product Type, 2025 and 2035
  • Figure 51: Latin America Market Y-o-Y Growth Comparison by Product Type, 2025-2035
  • Figure 52: Latin America Market Attractiveness Analysis by Product Type
  • Figure 53: Latin America Market Value Share and BPS Analysis by Labeling Certification Type, 2025 and 2035
  • Figure 54: Latin America Market Y-o-Y Growth Comparison by Labeling Certification Type, 2025-2035
  • Figure 55: Latin America Market Attractiveness Analysis by Labeling Certification Type
  • Figure 56: Latin America Market Value Share and BPS Analysis by Meal Composition, 2025 and 2035
  • Figure 57: Latin America Market Y-o-Y Growth Comparison by Meal Composition, 2025-2035
  • Figure 58: Latin America Market Attractiveness Analysis by Meal Composition
  • Figure 59: Latin America Market Value Share and BPS Analysis by Sales Channel, 2025 and 2035
  • Figure 60: Latin America Market Y-o-Y Growth Comparison by Sales Channel, 2025-2035
  • Figure 61: Latin America Market Attractiveness Analysis by Sales Channel
  • Figure 62: Latin America Market Value Share and BPS Analysis by Packaging Type, 2025 and 2035
  • Figure 63: Latin America Market Y-o-Y Growth Comparison by Packaging Type, 2025-2035
  • Figure 64: Latin America Market Attractiveness Analysis by Packaging Type
  • Figure 65: Latin America Market Value Share and BPS Analysis by Consumer Segment, 2025 and 2035
  • Figure 66: Latin America Market Y-o-Y Growth Comparison by Consumer Segment, 2025-2035
  • Figure 67: Latin America Market Attractiveness Analysis by Consumer Segment
  • Figure 68: Europe Market Value Share and BPS Analysis by Country, 2025 and 2035
  • Figure 69: Europe Market Value Share and BPS Analysis by Product Type, 2025 and 2035
  • Figure 70: Europe Market Y-o-Y Growth Comparison by Product Type, 2025-2035
  • Figure 71: Europe Market Attractiveness Analysis by Product Type
  • Figure 72: Europe Market Value Share and BPS Analysis by Labeling Certification Type, 2025 and 2035
  • Figure 73: Europe Market Y-o-Y Growth Comparison by Labeling Certification Type, 2025-2035
  • Figure 74: Europe Market Attractiveness Analysis by Labeling Certification Type
  • Figure 75: Europe Market Value Share and BPS Analysis by Meal Composition, 2025 and 2035
  • Figure 76: Europe Market Y-o-Y Growth Comparison by Meal Composition, 2025-2035
  • Figure 77: Europe Market Attractiveness Analysis by Meal Composition
  • Figure 78: Europe Market Value Share and BPS Analysis by Sales Channel, 2025 and 2035
  • Figure 79: Europe Market Y-o-Y Growth Comparison by Sales Channel, 2025-2035
  • Figure 80: Europe Market Attractiveness Analysis by Sales Channel
  • Figure 81: Europe Market Value Share and BPS Analysis by Packaging Type, 2025 and 2035
  • Figure 82: Europe Market Y-o-Y Growth Comparison by Packaging Type, 2025-2035
  • Figure 83: Europe Market Attractiveness Analysis by Packaging Type
  • Figure 84: Europe Market Value Share and BPS Analysis by Consumer Segment, 2025 and 2035
  • Figure 85: Europe Market Y-o-Y Growth Comparison by Consumer Segment, 2025-2035
  • Figure 86: Europe Market Attractiveness Analysis by Consumer Segment
  • Figure 87: East Asia Market Value Share and BPS Analysis by Country, 2025 and 2035
  • Figure 88: East Asia Market Value Share and BPS Analysis by Product Type, 2025 and 2035
  • Figure 89: East Asia Market Y-o-Y Growth Comparison by Product Type, 2025-2035
  • Figure 90: East Asia Market Attractiveness Analysis by Product Type
  • Figure 91: East Asia Market Value Share and BPS Analysis by Labeling Certification Type, 2025 and 2035
  • Figure 92: East Asia Market Y-o-Y Growth Comparison by Labeling Certification Type, 2025-2035
  • Figure 93: East Asia Market Attractiveness Analysis by Labeling Certification Type
  • Figure 94: East Asia Market Value Share and BPS Analysis by Meal Composition, 2025 and 2035
  • Figure 95: East Asia Market Y-o-Y Growth Comparison by Meal Composition, 2025-2035
  • Figure 96: East Asia Market Attractiveness Analysis by Meal Composition
  • Figure 97: East Asia Market Value Share and BPS Analysis by Sales Channel, 2025 and 2035
  • Figure 98: East Asia Market Y-o-Y Growth Comparison by Sales Channel, 2025-2035
  • Figure 99: East Asia Market Attractiveness Analysis by Sales Channel
  • Figure 100: East Asia Market Value Share and BPS Analysis by Packaging Type, 2025 and 2035
  • Figure 101: East Asia Market Y-o-Y Growth Comparison by Packaging Type, 2025-2035
  • Figure 102: East Asia Market Attractiveness Analysis by Packaging Type
  • Figure 103: East Asia Market Value Share and BPS Analysis by Consumer Segment, 2025 and 2035
  • Figure 104: East Asia Market Y-o-Y Growth Comparison by Consumer Segment, 2025-2035
  • Figure 105: East Asia Market Attractiveness Analysis by Consumer Segment
  • Figure 106: South Asia & Pacific Market Value Share and BPS Analysis by Country, 2025 and 2035
  • Figure 107: South Asia & Pacific Market Value Share and BPS Analysis by Product Type, 2025 and 2035
  • Figure 108: South Asia & Pacific Market Y-o-Y Growth Comparison by Product Type, 2025-2035
  • Figure 109: South Asia & Pacific Market Attractiveness Analysis by Product Type
  • Figure 110: South Asia & Pacific Market Value Share and BPS Analysis by Labeling Certification Type, 2025 and 2035
  • Figure 111: South Asia & Pacific Market Y-o-Y Growth Comparison by Labeling Certification Type, 2025-2035
  • Figure 112: South Asia & Pacific Market Attractiveness Analysis by Labeling Certification Type
  • Figure 113: South Asia & Pacific Market Value Share and BPS Analysis by Meal Composition, 2025 and 2035
  • Figure 114: South Asia & Pacific Market Y-o-Y Growth Comparison by Meal Composition, 2025-2035
  • Figure 115: South Asia & Pacific Market Attractiveness Analysis by Meal Composition
  • Figure 116: South Asia & Pacific Market Value Share and BPS Analysis by Sales Channel, 2025 and 2035
  • Figure 117: South Asia & Pacific Market Y-o-Y Growth Comparison by Sales Channel, 2025-2035
  • Figure 118: South Asia & Pacific Market Attractiveness Analysis by Sales Channel
  • Figure 119: South Asia & Pacific Market Value Share and BPS Analysis by Packaging Type, 2025 and 2035
  • Figure 120: South Asia & Pacific Market Y-o-Y Growth Comparison by Packaging Type, 2025-2035
  • Figure 121: South Asia & Pacific Market Attractiveness Analysis by Packaging Type
  • Figure 122: South Asia & Pacific Market Value Share and BPS Analysis by Consumer Segment, 2025 and 2035
  • Figure 123: South Asia & Pacific Market Y-o-Y Growth Comparison by Consumer Segment, 2025-2035
  • Figure 124: South Asia & Pacific Market Attractiveness Analysis by Consumer Segment
  • Figure 125: Middle East and Africa Market Value Share and BPS Analysis by Country, 2025 and 2035
  • Figure 126: Middle East and Africa Market Value Share and BPS Analysis by Product Type, 2025 and 2035
  • Figure 127: Middle East and Africa Market Y-o-Y Growth Comparison by Product Type, 2025-2035
  • Figure 128: Middle East and Africa Market Attractiveness Analysis by Product Type
  • Figure 129: Middle East and Africa Market Value Share and BPS Analysis by Labeling Certification Type, 2025 and 2035
  • Figure 130: Middle East and Africa Market Y-o-Y Growth Comparison by Labeling Certification Type, 2025-2035
  • Figure 131: Middle East and Africa Market Attractiveness Analysis by Labeling Certification Type
  • Figure 132: Middle East and Africa Market Value Share and BPS Analysis by Meal Composition, 2025 and 2035
  • Figure 133: Middle East and Africa Market Y-o-Y Growth Comparison by Meal Composition, 2025-2035
  • Figure 134: Middle East and Africa Market Attractiveness Analysis by Meal Composition
  • Figure 135: Middle East and Africa Market Value Share and BPS Analysis by Sales Channel, 2025 and 2035
  • Figure 136: Middle East and Africa Market Y-o-Y Growth Comparison by Sales Channel, 2025-2035
  • Figure 137: Middle East and Africa Market Attractiveness Analysis by Sales Channel
  • Figure 138: Middle East and Africa Market Value Share and BPS Analysis by Packaging Type, 2025 and 2035
  • Figure 139: Middle East and Africa Market Y-o-Y Growth Comparison by Packaging Type, 2025-2035
  • Figure 140: Middle East and Africa Market Attractiveness Analysis by Packaging Type
  • Figure 141: Middle East and Africa Market Value Share and BPS Analysis by Consumer Segment, 2025 and 2035
  • Figure 142: Middle East and Africa Market Y-o-Y Growth Comparison by Consumer Segment, 2025-2035
  • Figure 143: Middle East and Africa Market Attractiveness Analysis by Consumer Segment
  • Figure 144: Global Market - Tier Structure Analysis
  • Figure 145: Global Market - Company Share Analysis

Frequently Asked Questions

How big is the Carbon Labeled Packaged Meal Market in 2025?

The global Carbon Labeled Packaged Meal Market is projected to be valued at approximately USD 678.2 Million in 2025.

What will be the size of the Carbon Labeled Packaged Meal Market in 2035?

The market size for the Carbon Labeled Packaged Meal Market is projected to reach USD 1,251.9 Million by 2035.

How much will the Carbon Labeled Packaged Meal Market grow between 2025 and 2035?

The Carbon Labeled Packaged Meal Market is expected to expand at a CAGR of 6.3% between 2025 and 2035.

What are the key product types in the Carbon Labeled Packaged Meal Market?

The key product types in the Carbon Labeled Packaged Meal Market are Ready-to-Eat Meals, Ready-to-Cook Meal Kits, Frozen Meals, Shelf-Stable Packaged Meals, and Chilled Meals.

Which meal composition segment will contribute a significant share in the Carbon Labeled Packaged Meal Market in 2025?

In 2025, Meat-Based Meals are projected to hold the largest share at around 40%, while Plant-Based Meals are anticipated to expand the fastest at 7.5% CAGR, highlighting shifting consumer preference toward sustainable options.

Explore Similar Insights

Future Market Insights

Carbon Labeled Packaged Meal Market

Chat With

MaRIA

Hi There, I am MaRIA, Your Market Research Intelligence Assistant. How may I help you?