

- Market Size (2026)
- USD 640.0 Mn
- Forecast (2036)
- USD 1473.9 Mn
- CAGR (2026 to 2036)
- 8.7%
How big is the Chitosan-Based Natural Cosmetics Market in 2026?
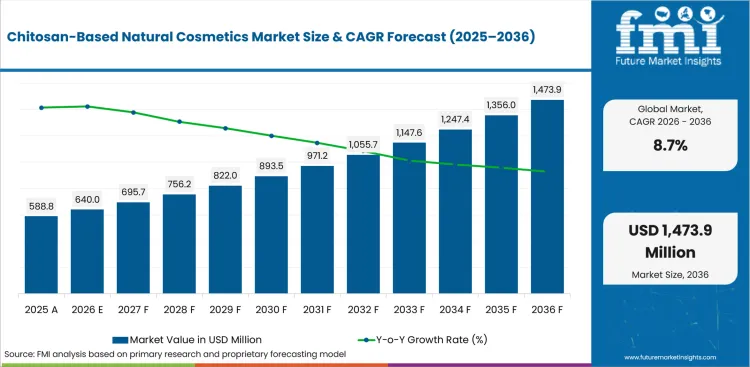
USD 640.0 million in 2026 and USD 1,473.9 million by 2036 at an 8.7% CAGR.
The chitosan-based natural cosmetics market was valued at USD 588.8 million in 2025. It is projected to expand from USD 640.0 million in 2026 to USD 1,473.9 million by 2036 at 8.7% CAGR, driven by rising awareness of eco-friendly personal care products and the expanding use of chitosan in cosmetic formulations. MoCRA-driven product listing is making cosmetic ingredients harder to qualify without a clear origin file. FDA reported 1.1 million unique active cosmetic product listings under MoCRA by March 2026, raising the review burden for natural-origin polymers used in skincare formulas. Chitosan gains relevance in this setting due to film formation, moisture support and ingredient-story compatibility. Brand owners comparing natural cosmetics outlook data therefore ask whether each grade supports repeat claims and batch release.
Beauty brand owners and contract manufacturers are expected to adopt chitosan-based inputs to reduce reformulation risk before line approval. FDA guidance updated in December 2024 kept facility registration and product listing procedures visible for responsible persons, which places ingredient identity inside launch planning. Sourcing teams reviewing personal care ingredient supply evidence therefore look beyond price during supplier qualification. The practical value comes from supplier files that help R&D, quality and regulatory teams approve skincare batches without repeated handoffs.
Formulation value is expected to increase from raw material choice to finished label review across audited premium skincare launches. Cosmetics Europe reported €104 billion in European cosmetics and personal care retail sales for 2024, which shows why documentation-heavy regions influence global ingredient expectations. Established markets weight safety records and function references before account expansion moves into repeat purchasing. Higher-growth markets weight channel speed and local formulation access before brands widen product ranges. Chitosan suppliers linked to upcycled cosmetic ingredients themes face a practical decision: prove source control or lose premium-brand trial access.
| Metric | Value |
|---|---|
| 2025 Market Size | USD 588.8 million |
| 2026 Market Size | USD 640.0 million |
| 2036 Market Size | USD 1,473.9 million |
| Forecast CAGR (2026-2036) | 8.7% |
| Product Type Focus | Skincare |
| Skincare Share (2026) | 41.5% |
| Source Focus | Marine |
| Marine Share (2026) | 34.5% |
| Function Focus | Moisturizing |
| Moisturizing Share (2026) | 41.0% |
| Fastest-growing Country | India |
| India CAGR by 2036 | 7.8% |
Summary of the Chitosan-Based Natural Cosmetics Market
| Market Signal | Commercial Impact |
|---|---|
| Demand and Growth Drivers | Growth is expected to be driven by formulation proof and ingredient-origin documentation. Brand owners need chitosan grades that support texture, safety records and repeat commercial batches. The urgency is clearest in skincare accounts that need origin proof before claims reach retail review.
|
| Product and Segment View | Skincare, marine sources and moisturizing functions are estimated to shape the main 2026 segment positions. Premium brands add channel discipline due to claim-support needs inside launch files.
|
| Geography and Growth Outlook | India and China form the higher-growth tier due to digital beauty channels that shorten trial cycles. Europe and Japan show steadier adoption due to longer dossier review.
|
| Competitive Landscape | Competition is moderately fragmented between chitosan specialists and personal-care ingredient houses. Vendor screening focus on purity,origin documentation and application support.
|
| Analyst Perspective | The central adoption factor is proof that chitosan improves formulation behavior without raising launch risk. Account retention depends on technical support and repeatable source documentation.
- Rahul Pandita, Principal Analyst at Future Market Insights |
Source: FMI's proprietary forecasting model and primary research
How is the chitosan-based natural cosmetics market segmented?
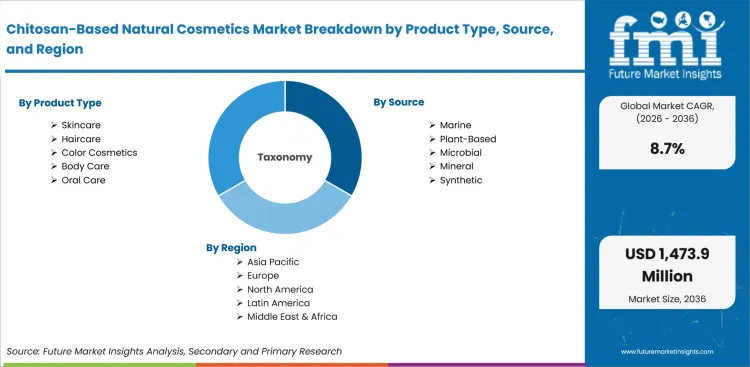
The chitosan-based natural cosmetics market industry is segmented by product type, source, function, end user, and region.
The chitosan-based natural cosmetics market is segmented by product type, source, function, end user, and region. Product type covers skincare, haircare, color cosmetics, body care, and oral care for finished beauty formats. Source covers plant-based, marine, microbial, mineral, and synthetic inputs used by cosmetic formulators. Function covers anti-aging, moisturizing, cleansing, UV protection, and repair roles in cosmetic claims. End user covers premium brands, mass brands, professional and salon accounts, private label, and DTC brands. Regional coverage includes North America, Europe, East Asia, South Asia, and Latin America, alongside adjacent vegan cosmetics demand in clean-label beauty programs and premium product planning.
How does skincare shape demand within the product type category?
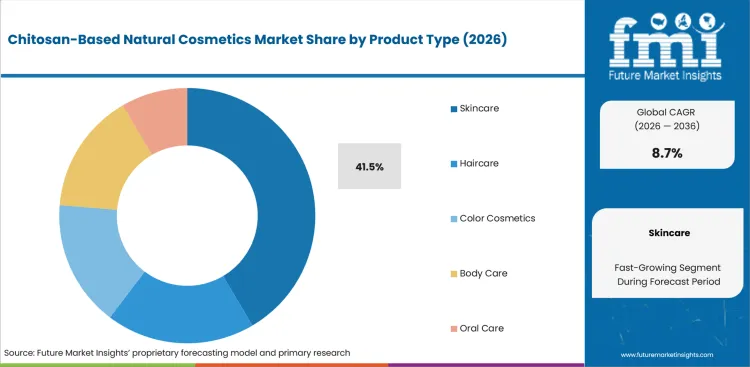
Skincare formulas carry the qualification burden for chitosan-based natural cosmetics before brand owners approve launches. KitoZyme describes fungal chitosan as a natural biopolymer for cosmetic formulations, which keeps source documentation close to skincare claims. Brand owners test chitosan in moisturizers and masks before wider body or hair extensions. Serum launches also create a separate trial route for texture and film behavior. The segment therefore depends on repeatable texture, sensory feel and documentation fit in commercial batches.
- By product type, skincare is projected to account for 41.5% of demand in 2026 driven by hydration claims and facial-care launch frequency. Formulators need chitosan grades that form films without disrupting emulsions. KitoZyme describes fungal chitosan for cosmetic use, which reinforces why organic cosmetics formats receive early trials from premium skincare teams before wider body-care extensions.
- Premium brands are turning to chitosan in skincare, largely because it gives them tighter control over texture and makes claims easier to defend. Product managers reach for it to improve how a formula feels on the skin and to support moisture claims before a product goes to retail review. It's also favored because its natural origin story stays intact through stability testing and the larger batch approvals that facial care launches have to clear.
What supports marine sourcing within the source category?
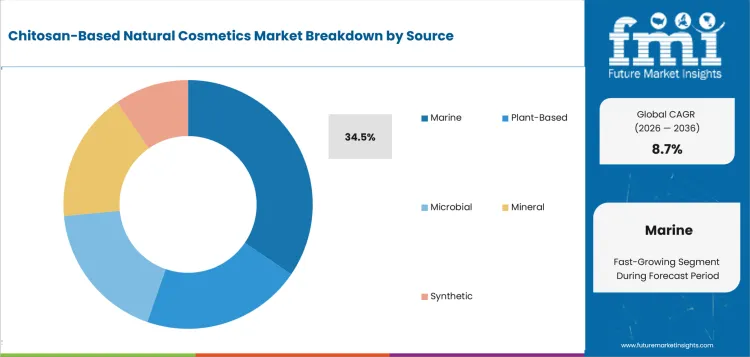
Marine chitosan remains familiar to many formulators due to shellfish-derived commercial supply and established technical behavior. Source choice affects allergen discussion, traceability language and batch consistency before a supplier receives larger purchase orders. Insectta states that its cosmetic-grade chitosan is 100% heavy-metal free, which shows how non-traditional sourcing competes on purity claims. Marine suppliers must therefore prove contaminant control and origin disclosure before formulation trials expand.
- By source, marine is estimated to hold 34.5% of demand in 2026 owing to availability and established processing knowledge. Ingredient distributors favor marine grades for familiar viscosity and film-forming behavior across skincare prototypes. Shellfish-origin disclosure still requires careful records, so marine suppliers must provide contaminant files before contract manufacturers scale repeated batches in audited programs.
- Demand for marine chitosan is expected to grow among contract manufacturers attributable to supply familiarity and documented application behavior. Regional suppliers serving ASEAN cosmetic chemicals accounts still need source files that address shellfish origin and heavy-metal control. Marine grades therefore gain repeat orders if technical teams link viscosity behavior to formula stability across skincare and haircare prototypes.
How do formulators evaluate moisturizing within the function category?
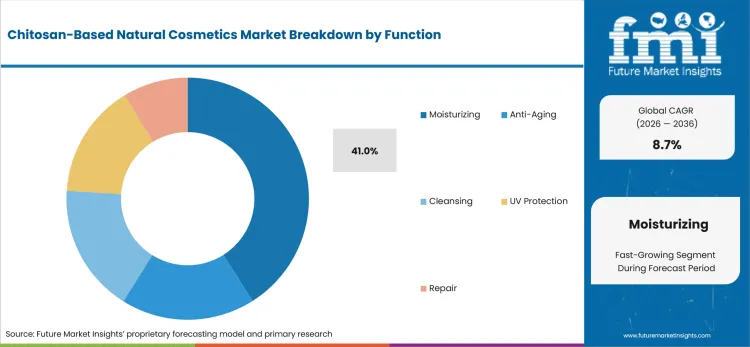
Moisturizing gives chitosan a clear formulation role instead of a broad natural-origin story. Formulators evaluate whether the ingredient supports a light film, reduces tackiness and allows stable sensory performance in creams or masks. FDA product listing rules require marketed cosmetic products to include ingredients in submissions, which keeps function claims tied to ingredient records.
- By function, moisturizing is forecast to represent 41.0% of demand in 2026 supported by film-forming and hydration-positioning needs. Chitosan is useful for brands seeking a polymeric ingredient that supports skin feel and claim language. The functional role is clearest in leave-on formulas that need sensory control before the finished product enters retailer review.
- Purchase activity for moisturizing chitosan is anticipated to rise driven by premium skincare briefs that compare hydration claims before launch. Brand teams reviewing hyaluronic acid personal care adjacency require evidence that chitosan adds film behavior and texture support. Application teams then test tackiness, moisture feel and compatibility before approving wider commercial sourcing inside facial skincare lines.
How are premium brands positioned within the end user category?
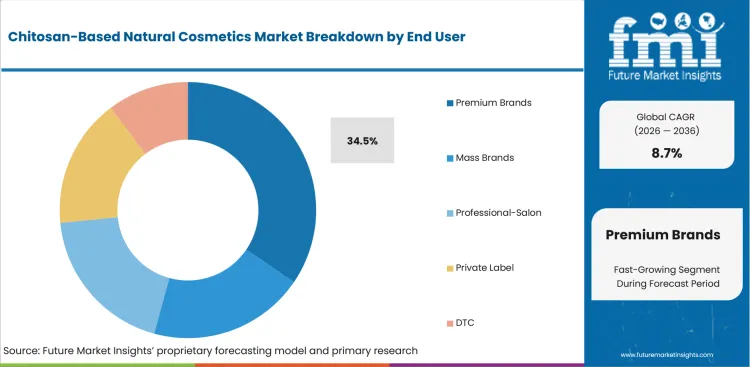
Premium brands evaluate chitosan-based ingredients before mass brands due to product stories, texture targets and claim reviews that sit closer to launch economics. Retailer review also pushes these brands to request clearer dossiers from ingredient suppliers during premium product listing decisions. Premium skincare teams want source origin, safety records and technical service before investing in a full launch.
- The premium brands end user group is likely to capture 34.5% share in 2026 attributable to tighter claim governance and higher service expectations. These accounts need chitosan suppliers that explain source, molecular weight and formula behavior before launch. Retail review adds pressure on documentation packages, so premium brands screen suppliers before larger ingredient commitments in audited skincare programs.
- Premium brands are expected to favor documented chitosan grades over generic natural polymers due to texture, story and audit requirements. Supplier teams gain access by providing sample protocols and specification ranges for reviewed formulas. Evidence that the ingredient survives scale-up also helps premium teams approve repeat sourcing in skincare and haircare extensions without reopening basic material qualification files.
What are the drivers, restraints, and opportunities in the Chitosan-Based Natural Cosmetics Market?
Near-term purchases are being shaped by claim documentation and formulation stability. Premium channel expansion defines the main access route outlined below.
- Driver: Brand owners are expected to purchase chitosan grades that support moisturizing claims, film behavior and natural-origin positioning.
- Restraint: Adoption is likely to slow in accounts lacking source disclosure, impurity records and stability evidence for finished formulas.
- Opportunity: Fungal and insect-derived chitosan are projected to open vegan-positioned briefs that avoid shellfish-origin objections.
Premium skincare teams are expected to increase chitosan trials if ingredient files connect moisture claims to stable processing. FDA’s 2024 registration and listing guidance kept product ingredients inside official listing procedures, which links ingredient control to launch readiness. The driver therefore centers on proof quality over broad natural-beauty language during supplier screening. Suppliers that translate chitosan functions into batch checks receive earlier access to R&D pipelines across moisturizing and repair-focused launches.
Regulatory teams are likely to delay adoption if chitosan grades arrive without clear source origin and contaminant testing. European Commission SCCS opinions issued in 2026 show ongoing review of cosmetic ingredient safety questions, which keeps dossier quality under close technical review. The restraint is sharper for marine sourcing due to allergen discussions and variable raw material origin. Brand owners therefore require test files before they approve wider sourcing across premium skincare programs.
Alternative chitosan sources are expected to convert the restraint into a premium access route. Insectta describes cosmetic-grade chitosan for skincare and haircare applications covering moisturizing and anti-aging roles. The positioning supports non-marine sourcing for brand owners that avoid shellfish origin during premium skincare screening. The same logic affects beauty and personal care packaging decisions due to aligned ingredient stories and pack claims. Suppliers that pair traceability with application testing gain a clearer route into premium accounts.
Which country CAGRs are profiled in the Chitosan-Based Natural Cosmetics Market?
.webp "Top Country Growth Comparison Chitosan Based Natural Cosmetics Market Cagr (2026 2036)")
| Country | CAGR |
|---|---|
| United States | 5.2% |
| China | 6.5% |
| India | 7.8% |
| Germany | 4.4% |
| United Kingdom | 4.8% |
| Japan | 3.7% |
| South Korea | 5.0% |
Source: FMI's proprietary forecasting model and primary research
How do country-level CAGRs compare in the Chitosan-Based Natural Cosmetics Market?
India is projected to expand at 7.8% through 2036 and China is forecast to advance at 6.5%. The United States is anticipated to grow at 5.2% and South Korea is estimated to post 5.0%. The United Kingdom is predicted to record 4.8% and Germany is likely to rise at 4.4%. Japan is forecast to expand at 3.7% due to careful claims review and longer supplier qualification. The variation reflects channel speed, regulatory dossier depth and tolerance for marine or fungal chitosan sourcing. High-growth countries reward launch speed, and steady markets reward proof depth before repeat purchase.
- The United States is projected to grow at 5.2% CAGR through 2036, driven by MoCRA dossier renewal and premium skincare launch governance. The Personal Care Products Council reported USD 495.6 billion in total output for personal care products in 2024. Economic scale raises scrutiny of ingredient files and claim language for chitosan-based skincare inputs. Local adoption still faces pressure from responsible-person recordkeeping and litigation-sensitive natural claims. Ingredient teams also expect domestic support that shortens MoCRA refresh work.
- China's chitosan-based natural cosmetics outlook is anticipated to advance at 6.5% CAGR over the assessment period, supported by branded cosmetics retail and online product comparison. National Bureau of Statistics of China reported cosmetics retail sales of 435.7 billion yuan in 2025. Retail depth creates room for moisturizing and film-forming ingredients that support frequent launch cycles. Local competition also raises price pressure during supplier qualification and sample testing. Sampling speed remains a visible factor during online launch planning.
- Demand for chitosan-based natural cosmetics in India is forecast to rise at 7.8% CAGR over the forecast period, propelled by digital beauty access and natural-origin skincare experimentation. India's Press Information Bureau reported 2.58 crore cumulative ONDC transactions in January 2025. Digital discovery expands brand access for smaller beauty labels that test natural polymers in moisturizers and masks. The constraint is uneven technical support for formulators outside large metro manufacturing clusters. Small-batch trial support therefore has a direct bearing on supplier access.
- Adoption of chitosan-based natural cosmetics in Germany is estimated to expand at 4.4% CAGR through 2036, shaped by EU safety review and ingredient documentation discipline. Industrieverband Körperpflege- und Waschmittel reported beauty care revenue of €16.9 billion in 2025. The value base makes Germany a documentation-first market for chitosan suppliers serving premium skincare accounts. Adoption is restrained by longer technical review and retailer caution around natural-origin claims. Technical teams also expect German-language files that support internal dossier review. Retailer files also need concise support for technical claims. Suppliers with CosIng-aware dossiers are expected to receive stronger consideration in brands requiring EU safety alignment.
- The United Kingdom chitosan-based natural cosmetics sector is projected to record 4.8% CAGR during the assessment period, owing to premium skincare value growth and claim review practice. CTPA placed skincare category value at £3,746 million in 2025. Category depth creates a clear trial route for chitosan in moisturizing and anti-aging skincare formats. Adoption is slowed by retailer evidence expectations and separate UK compliance review after EU divergence. Retail teams also require concise proof for label-review cycles. Brand teams also need samples that support retailer conversations. Suppliers with UK-ready documentation are expected to gain attention in accounts needing fast claim substantiation.
- In Japan, chitosan-based natural cosmetics demand is predicted to advance at 3.7% CAGR through 2036, influenced by skincare share depth and careful claims governance. The Japan Cosmetic Industry Association recorded cosmetic shipments of 1,302.4 billion yen in 2023. Skincare-led shipment structure supports chitosan trials for hydration films and hair-fixing functions in controlled product lines. Account conversion remains measured due to specification review and preference for proven local handling records. Local distributors therefore value sampling support that reduces formulation uncertainty before wider SKU planning inside accounts.
- Chitosan-based natural cosmetics sales in South Korea are forecast to expand at 5.0% CAGR by 2036, reinforced by export-oriented skincare formulation and global brand file pressure. Ministry of Food and Drug Safety data showed Korean cosmetics exports at US$11.4 billion in 2025. Export scale pushes formulators toward ingredients that support repeatable texture and documented safety in overseas submissions. Local teams still need faster evidence packages due to changing safety-evaluation demands in destination countries.
Who are the notable companies in the Chitosan-Based Natural Cosmetics Market?
KitoZyme, Heppe Medical Chitosan, ChitoLytic, Insectta, BASF, Givaudan, Croda, Ashland, Evonik, and Symrise are the notable companies shaping this market.
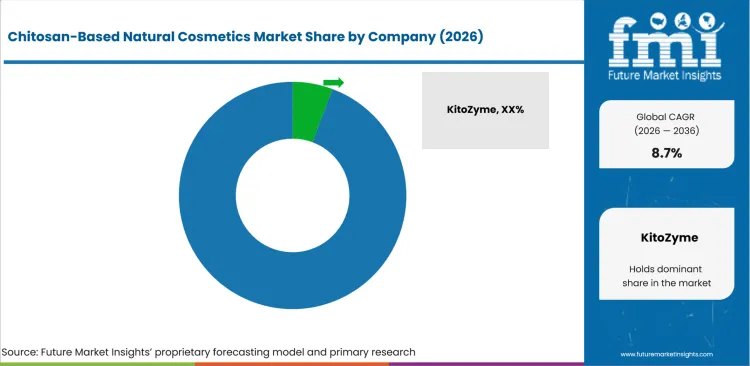
The competitive base is moderately fragmented due to split control over chitosan origin, cosmetic formulation service and global distribution. Chitosan specialists hold material credibility in grade selection and source traceability during early supplier screening. Personal-care ingredient houses hold account access, technical service and brand relationships across audited launches. Regional specialists compete on purity or local supply access in formulation programs needing quicker sampling. Competition centers on documentation depth, application testing and claim-support service for brand-owner qualification work. Wider anti-aging creams and serums activity also raises demand for credible active-ingredient stories in premium skincare.
- Source-specialist competition is centered on chitosan origin and molecular control for audited natural formulations. KitoZyme uses fungal chitosan positioning for non-animal programs, and Insectta promotes cosmetics-grade chitosan for skincare and haircare briefs. These suppliers serve brand owners that want a natural-origin polymer story without relying on shellfish-derived material.
- Specification-led accounts look closely at purity and grade repeatability before approving larger batches. Heppe Medical Chitosan and ChitoLytic compete on controlled chitosan portfolios, documentation depth and custom grade availability. Their practical advantage is clearest in formulation labs that need narrow molecular weight ranges and clear certificates before launch.
- Personal-care ingredient houses compete in accounts that place chitosan inside a wider natural-active program. BASF, Givaudan and Croda help brand owners connect ingredient stories to sensory testing and claim review. Their account access supports formulators that prefer one technical service route across polymers, actives and formulation aids.
- Service-led differentiation is expected to decide repeat account access over the forecast period. Ashland, Evonik and Symrise have broader personal-care relationships that support application testing and channel discussions. Chitosan specialists remain well placed in purchases needing exact material identity, but larger ingredient houses retain access in global brand systems.
Competitive Benchmarking: Chitosan-Based Natural Cosmetics Market
| Company | Chitosan Relevance | Application Support | Documentation Fit | Service Reach |
|---|---|---|---|---|
| KitoZyme | Strong | Strong | Medium | Global |
| Heppe Medical Chitosan | Strong | Medium | Strong | Global |
| ChitoLytic | Strong | Medium | Strong | North America |
| Insectta | Strong | Medium | Medium | Asia Pacific |
| BASF | Medium | Strong | Strong | Global |
| Givaudan | Medium | Strong | Strong | Global |
| Croda | Medium | Strong | Strong | Global |
| Ashland | Medium | Strong | Medium | Global |
| Evonik | Medium | Strong | Strong | Global |
| Symrise | Medium | Strong | Medium | Global |
Source: Future Market Insights competitive analysis, 2026. Ratings reflect relative portfolio relevance and workflow fit for chitosan-based natural cosmetics accounts. Service capability and geographic reach shape the remaining comparison across commercial formulation workflows.
Key Developments in the Chitosan-Based Natural Cosmetics Market
- In September 2025, Greenitio closed a USD 1.5 million seed round to scale its fungal chitosan biopolymer platform for cosmetics and specialty chemicals. The mushroom-derived chitosan is positioned as a non-animal alternative to microplastics and petrochemical ingredients, supporting buyers seeking sustainable, vegan-origin chitosan supply.
- In early 2025, KitoZyme expanded its KiOsmetine fungal chitosan range with KiOsmetine Lumina for skincare and styling formulations. The higher-clarity, improved-solubility grade is built around film-forming, hydration and conditioning performance and is Ecocert/COSMOS-compliant, strengthening options for buyers reviewing non-animal chitosan actives.
Key Players in the Chitosan-Based Natural Cosmetics Market
Chitosan and biopolymer specialists
- KitoZyme
- Heppe Medical Chitosan
- ChitoLytic
- Insectta
Personal-care ingredient and active suppliers
- BASF
- Givaudan
- Croda
- Ashland
- Evonik
- Symrise
Regional chitosan and cosmetic-material suppliers
- Zhejiang Golden Shell Medical Technology
- Tidal Vision
- Chitosan Global
Chitosan-Based Natural Cosmetics Market - Report Scope
| Coverage field | Report scope |
|---|---|
| Market breakdown | Chitosan-Based Natural Cosmetics Market Breakdown By Product Type, Source, Function, End User, and Region |
| Market Definition | Chitosan-based natural cosmetics use chitosan or chitosan derivatives in skincare, haircare and related beauty formulations to support film formation, moisturizing, texture control and claim-ready natural-origin positioning. |
| Regions Covered | North America, Latin America, Western Europe, Eastern Europe, East Asia, South Asia and Pacific, and Middle East and Africa |
| Countries Covered | United States, China, India, Germany, United Kingdom, Japan, South Korea and 25+ countries |
| Key Companies Profiled | KitoZyme, Heppe Medical Chitosan, ChitoLytic, Insectta, BASF, Givaudan, Croda, Ashland, Evonik, Symrise, Zhejiang Golden Shell Medical Technology, Tidal Vision, and Chitosan Global |
| Forecast Period | 2026 to 2036 |
| Approach | Hybrid bottom-up and top-down methodology using chitosan grade availability, skincare formulation use cases, brand-owner claim review, source preference and country-level beauty channel indicators |
Source: Future Market Insights - analysis driven by proprietary forecasting models and primary research
Chitosan-Based Natural Cosmetics Market - Research Methodology
| Method | Approach |
|---|---|
| Primary Research | Interviews covered beauty brand formulation heads, contract manufacturing teams and ingredient distributors active in chitosan or adjacent natural polymers. Regulatory affairs managers were also included to test how source files affect claim review. Discussions focused on chitosan source preference, batch documentation and stability testing. Respondents assessed commercial barriers that affect movement from lab samples to repeated purchase orders for skincare and haircare programs. |
| Desk Research | Desk research used FDA cosmetic listing references and CosIng materials. SCCS opinions, national cosmetics statistics and trade-body reports were used to test country evidence. Official company product pages helped verify cosmetic-grade relevance against source origin and moisturizing use. Product screening excluded agricultural, water-treatment and biomedical chitosan applications that lacked direct relevance to personal-care formulations or brand-owner launch decisions during sizing. |
| Market Sizing and Forecasting | FMI used a hybrid bottom-up and top-down model based on finished natural cosmetics demand and chitosan inclusion rates. The sizing logic also reflected skincare share, premium brand adoption and source-grade availability. Forecast assumptions were adjusted for marine and fungal sourcing preferences identified during interviews. Insect-derived options were assessed separately due to vegan positioning and source-documentation needs within premium skincare buying programs. |
| Data Validation | Forecasts were checked against country beauty channel signals and supplier portfolio reviews. Ingredient documentation requirements were compared against segment share consistency before final sizing. Company portfolios were reviewed to avoid counting chitosan uses in agriculture or water treatment. Medical-device applications were excluded unless the supplier also served cosmetic formulations and personal-care ingredient accounts with documented product relevance during the review stage. |
Source: Future Market Insights (FMI) analysis, based on proprietary forecasting model and primary research
Chitosan-Based Natural Cosmetics Market by Segments
Chitosan-Based Natural Cosmetics Market segmented by Product Type:
- Skincare
- Haircare
- Color Cosmetics
- Body Care
- Oral Care
Chitosan-Based Natural Cosmetics Market segmented by Source:
- Plant-Based
- Marine
- Microbial
- Mineral
- Synthetic
Chitosan-Based Natural Cosmetics Market segmented by Function:
- Anti-Aging
- Moisturizing
- Cleansing
- UV Protection
- Repair
Chitosan-Based Natural Cosmetics Market segmented by End User:
- Premium Brands
- Mass Brands
- Professional/Salon
- Private Label
- DTC
Chitosan-Based Natural Cosmetics Market by Region:
- North America
- United States
- Canada
- Latin America
- Brazil
- Chile
- Mexico
- Rest of Latin America
- Western Europe
- Germany
- United Kingdom
- Italy
- Spain
- France
- Nordic
- BENELUX
- Rest of Western Europe
- Eastern Europe
- Poland
- Hungary
- Balkan and Baltic
- Rest of Eastern Europe
- East Asia
- China
- Japan
- South Korea
- South Asia and Pacific
- India
- ASEAN
- Australia and New Zealand
- Rest of South Asia and Pacific
- Middle East and Africa
- Kingdom of Saudi Arabia
- Other GCC Countries
- Turkiye
- South Africa
- Other African Union
- Rest of Middle East and Africa
Research Sources and Bibliography
- Food and Drug Administration. (2026, April). Registration & Listing of Cosmetic Product Facilities and Products. USA Food and Drug Administration.
- Food and Drug Administration. (2024, December). Guidance for Industry: Registration and Listing of Cosmetic Product Facilities and Products. USA Food and Drug Administration.
- National Bureau of Statistics of China. (2026, January). Total Retail Sales of Consumer Goods in December 2025. National Bureau of Statistics of China.
- Department for Promotion of Industry and Internal Trade. (2025, December). 2025 Year End Review for Department for Promotion of Industry and Internal Trade. Press Information Bureau.
- Industrieverband Körperpflege- und Waschmittel. (2025, December). Renewed Growth for the Beauty and Home Care Industry. IKW.
- Cosmetic, Toiletry and Perfumery Association. (2026, June). GB Market - Cosmetic Industry in Figures. CTPA.
- Japan Cosmetic Industry Association. (2024, October). Cosmetic Shipments. Japan Cosmetic Industry Association.
- Cosmetics Europe. (2025, June). CE Statistics 2024. Cosmetics Europe.
- European Commission. (2025, June). SCCS - DHHB - S83. European Commission.
- Personal Care Products Council. (2026, May). USA Personal Care Products Industry Drives Nearly USD 500 billion in Economic Output, Supports More Than 2.6 million Jobs, New Report Finds. Personal Care Products Council.
- KitoZyme. (2026, June). KitoZyme: Leader in fungal chitosan. KitoZyme.
- Heppe Medical Chitosan. (2026, June). Heppe Medical Chitosan: GMP Chitosan, medical device and pharmaceutical Chitosan derivatives. Heppe Medical Chitosan.
- ChitoLytic. (2026, June). ChitoLytic - Chitosan Supply - Pure Reliable High-Quality. ChitoLytic.
- Insectta. (2026, June). Cosmetics Grade Chitosan. Insectta.
- BASF. (2025, April). BASF launches natural-based innovations for personal care at in-cosmetics Global 2025. BASF.
- Givaudan. (2025, March). Givaudan Active Beauty unveils Evernityl, the pioneering active ingredient for timeless beauty. Givaudan.
- BASF. (2025, October). BASF’s Personal Care business launches Ameriflor Calm. BASF.
- Givaudan. (2026, April). Givaudan Active Beauty introduces PrimalHyal 300. Givaudan.
This bibliography is provided for reader reference and uses primary government sources. It also uses standards-body, official trade body and company sources.
This Report Answers
- What value is the chitosan-based natural cosmetics market estimated to reach in 2026 and 2036?
- What CAGR is forecast for the chitosan-based natural cosmetics market from 2026 to 2036?
- Which product type and source segments shape demand across the parent categories?
- Which formulation pressures and documentation needs support purchase activity for chitosan-based inputs?
- How do country CAGRs differ across the profiled national markets?
- Which companies compete across chitosan sourcing and cosmetic formulation support?
- How does FMI validate forecasts and avoid duplicate external evidence across the article?
- What factors should brand owners address before broader account expansion or sourcing commitment?
- How does cosmetic claims review affect supplier selection and long-term sourcing confidence?
Frequently Asked Questions
Why should executives track the Chitosan-Based Natural Cosmetics Market?
Executives should track the market due to chitosan’s link between natural-origin positioning, functional skincare performance and regulatory documentation.
What business problem does the Chitosan-Based Natural Cosmetics Market address?
The market addresses formulation teams that need film-forming, moisturizing and texture support without weakening natural-origin claims.
What should procurement leaders evaluate before selecting suppliers?
Procurement leaders should evaluate source origin and molecular-weight range. They should also check impurity testing and stability data before reviewing technical service access.
What limits return on investment for brand owners?
Return is limited by weak specification files, unclear allergen communication and poor transfer from lab samples to commercial batches.
How do suppliers build long-term account confidence?
Suppliers build account confidence by providing batch records, traceability files and formulation support that reduces internal review time.
Preview the report firsthand - request a free sample
Get SampleGet the brochure for pricing and purchase details.
Get PDFTable of Content
- Key Takeaways
- Market Size and CAGR
- Top Growth Driver
- Fastest Growing Segment
- Leading Region
- Key Companies
- Emerging Opportunities
- Executive Summary
- Global Market Outlook
- Demand-side Trends
- Supply-side Trends
- Technology Roadmap Analysis
- Analysis and Recommendations
- Analyst Perspective (What is happening? Why now? What should investors know?)
- Key Questions Answered
- How large is the market?
- What is the CAGR?
- What are key trends?
- Which region dominates?
- Who are the leaders?
- Market Overview
- Market Coverage / Taxonomy
- Market Definition / Scope / Limitations
- Research Methodology
- Chapter Orientation
- Analytical Lens and Working Hypotheses
- Market Structure, Signals, and Trend Drivers
- Benchmarking and Cross-market Comparability
- Market Sizing, Forecasting, and Opportunity Mapping
- Research Design and Evidence Framework
- Desk Research Programme (Secondary Evidence)
- Expert Input and Fieldwork (Primary Evidence)
- Tooling, Models, and Reference Databases
- Data Engineering and Model Build
- Quality Assurance and Audit Trail
- Market Background
- Market Dynamics (Drivers, Restraints, Opportunity, Trends)
- Scenario Forecast (Optimistic, Likely, Conservative)
- Impact Analysis
- AI Impact
- Sustainability Impact
- Regulatory Impact
- Technology Impact
- Consumer / Buyer Analysis
- Purchase Drivers
- Adoption Barriers
- Buyer Journey
- Opportunity Map Analysis
- Product Life Cycle Analysis
- Supply Chain Analysis
- Investment Feasibility Matrix
- Value Chain Analysis
- PESTLE and Porter's Analysis
- Regulatory Landscape
- Regional Parent Market Outlook
- Production and Consumption Statistics
- Import and Export Statistics
- Global Market Analysis and Forecast, 2021 to 2036
- Historical Market Size Value (USD Million) & Volume (Unit) Analysis, 2021 to 2025
- Current and Future Market Size Value (USD Million) & Volume (Unit) Projections, 2026 to 2036
- Y-o-Y Growth Trend Analysis
- Absolute $ Opportunity Analysis
- Global Market Pricing Analysis, 2021 to 2036
- Global Market Analysis and Forecast, By Product Type, 2021 to 2036
- Introduction / Key Findings
- Historical Market Size Value (USD Million) & Volume (Unit) Analysis By Product Type, 2021 to 2025
- Current and Future Market Size Value (USD Million) & Volume (Unit) Analysis and Forecast By Product Type, 2026 to 2036
- Skincare
- Haircare
- Color Cosmetics
- Body Care
- Oral Care
- Skincare
- Y-o-Y Growth Trend Analysis By Product Type, 2021 to 2025
- Absolute $ Opportunity Analysis By Product Type, 2026 to 2036
- Global Market Analysis and Forecast, By Source, 2021 to 2036
- Introduction / Key Findings
- Historical Market Size Value (USD Million) & Volume (Unit) Analysis By Source, 2021 to 2025
- Current and Future Market Size Value (USD Million) & Volume (Unit) Analysis and Forecast By Source, 2026 to 2036
- Marine
- Plant-Based
- Microbial
- Mineral
- Synthetic
- Marine
- Y-o-Y Growth Trend Analysis By Source, 2021 to 2025
- Absolute $ Opportunity Analysis By Source, 2026 to 2036
- Global Market Analysis and Forecast, By Function, 2021 to 2036
- Introduction / Key Findings
- Historical Market Size Value (USD Million) & Volume (Unit) Analysis By Function, 2021 to 2025
- Current and Future Market Size Value (USD Million) & Volume (Unit) Analysis and Forecast By Function, 2026 to 2036
- Moisturizing
- Anti-Aging
- Cleansing
- UV Protection
- Repair
- Moisturizing
- Y-o-Y Growth Trend Analysis By Function, 2021 to 2025
- Absolute $ Opportunity Analysis By Function, 2026 to 2036
- Global Market Analysis and Forecast, By End User, 2021 to 2036
- Introduction / Key Findings
- Historical Market Size Value (USD Million) & Volume (Unit) Analysis By End User, 2021 to 2025
- Current and Future Market Size Value (USD Million) & Volume (Unit) Analysis and Forecast By End User, 2026 to 2036
- Premium Brands
- Mass Brands
- Professional-Salon
- Private Label
- DTC
- Premium Brands
- Y-o-Y Growth Trend Analysis By End User, 2021 to 2025
- Absolute $ Opportunity Analysis By End User, 2026 to 2036
- Global Market Analysis and Forecast, By Region, 2021 to 2036
- Introduction
- Historical Market Size Value (USD Million) & Volume (Unit) Analysis By Region, 2021 to 2025
- Current Market Size Value (USD Million) & Volume (Unit) Analysis and Forecast By Region, 2026 to 2036
- North America
- Latin America
- Western Europe
- Eastern Europe
- East Asia
- South Asia and Pacific
- Middle East & Africa
- Market Attractiveness Analysis By Region
- North America Market Analysis and Forecast, By Country, 2021 to 2036
- Historical Market Size Value (USD Million) & Volume (Unit) Trend Analysis By Market Taxonomy, 2021 to 2025
- Market Size Value (USD Million) & Volume (Unit) Forecast By Market Taxonomy, 2026 to 2036
- By Country
- USA
- Canada
- Mexico
- By Product Type
- By Source
- By Function
- By End User
- By Country
- Market Attractiveness Analysis
- By Country
- By Product Type
- By Source
- By Function
- By End User
- Key Takeaways
- Latin America Market Analysis and Forecast, By Country
- Historical Market Size Value (USD Million) & Volume (Unit) Trend Analysis By Market Taxonomy, 2021 to 2025
- Market Size Value (USD Million) & Volume (Unit) Forecast By Market Taxonomy, 2026 to 2036
- By Country
- Brazil
- Chile
- Rest of Latin America
- By Product Type
- By Source
- By Function
- By End User
- By Country
- Market Attractiveness Analysis
- By Country
- By Product Type
- By Source
- By Function
- By End User
- Key Takeaways
- Western Europe Market Analysis and Forecast, By Country
- Historical Market Size Value (USD Million) & Volume (Unit) Trend Analysis By Market Taxonomy, 2021 to 2025
- Market Size Value (USD Million) & Volume (Unit) Forecast By Market Taxonomy, 2026 to 2036
- By Country
- Germany
- UK
- Italy
- Spain
- France
- Nordic
- BENELUX
- Rest of Western Europe
- By Product Type
- By Source
- By Function
- By End User
- By Country
- Market Attractiveness Analysis
- By Country
- By Product Type
- By Source
- By Function
- By End User
- Key Takeaways
- Eastern Europe Market Analysis and Forecast, By Country
- Historical Market Size Value (USD Million) & Volume (Unit) Trend Analysis By Market Taxonomy, 2021 to 2025
- Market Size Value (USD Million) & Volume (Unit) Forecast By Market Taxonomy, 2026 to 2036
- By Country
- Russia
- Poland
- Hungary
- Balkan & Baltic
- Rest of Eastern Europe
- By Product Type
- By Source
- By Function
- By End User
- By Country
- Market Attractiveness Analysis
- By Country
- By Product Type
- By Source
- By Function
- By End User
- Key Takeaways
- East Asia Market Analysis and Forecast, By Country
- Historical Market Size Value (USD Million) & Volume (Unit) Trend Analysis By Market Taxonomy, 2021 to 2025
- Market Size Value (USD Million) & Volume (Unit) Forecast By Market Taxonomy, 2026 to 2036
- By Country
- China
- Japan
- South Korea
- By Product Type
- By Source
- By Function
- By End User
- By Country
- Market Attractiveness Analysis
- By Country
- By Product Type
- By Source
- By Function
- By End User
- Key Takeaways
- South Asia and Pacific Market Analysis and Forecast, By Country
- Historical Market Size Value (USD Million) & Volume (Unit) Trend Analysis By Market Taxonomy, 2021 to 2025
- Market Size Value (USD Million) & Volume (Unit) Forecast By Market Taxonomy, 2026 to 2036
- By Country
- India
- ASEAN
- Australia & New Zealand
- Rest of South Asia and Pacific
- By Product Type
- By Source
- By Function
- By End User
- By Country
- Market Attractiveness Analysis
- By Country
- By Product Type
- By Source
- By Function
- By End User
- Key Takeaways
- Middle East & Africa Market Analysis and Forecast, By Country
- Historical Market Size Value (USD Million) & Volume (Unit) Trend Analysis By Market Taxonomy, 2021 to 2025
- Market Size Value (USD Million) & Volume (Unit) Forecast By Market Taxonomy, 2026 to 2036
- By Country
- Kingdom of Saudi Arabia
- Other GCC Countries
- Türkiye
- South Africa
- Other African Union
- Rest of Middle East & Africa
- By Product Type
- By Source
- By Function
- By End User
- By Country
- Market Attractiveness Analysis
- By Country
- By Product Type
- By Source
- By Function
- By End User
- Key Takeaways
- Key Countries Market Analysis
- USA
- Pricing Analysis
- Market Share Analysis, 2025
- By Product Type
- By Source
- By Function
- By End User
- Canada
- Pricing Analysis
- Market Share Analysis, 2025
- By Product Type
- By Source
- By Function
- By End User
- Mexico
- Pricing Analysis
- Market Share Analysis, 2025
- By Product Type
- By Source
- By Function
- By End User
- Brazil
- Pricing Analysis
- Market Share Analysis, 2025
- By Product Type
- By Source
- By Function
- By End User
- Chile
- Pricing Analysis
- Market Share Analysis, 2025
- By Product Type
- By Source
- By Function
- By End User
- Germany
- Pricing Analysis
- Market Share Analysis, 2025
- By Product Type
- By Source
- By Function
- By End User
- UK
- Pricing Analysis
- Market Share Analysis, 2025
- By Product Type
- By Source
- By Function
- By End User
- Italy
- Pricing Analysis
- Market Share Analysis, 2025
- By Product Type
- By Source
- By Function
- By End User
- Spain
- Pricing Analysis
- Market Share Analysis, 2025
- By Product Type
- By Source
- By Function
- By End User
- France
- Pricing Analysis
- Market Share Analysis, 2025
- By Product Type
- By Source
- By Function
- By End User
- India
- Pricing Analysis
- Market Share Analysis, 2025
- By Product Type
- By Source
- By Function
- By End User
- ASEAN
- Pricing Analysis
- Market Share Analysis, 2025
- By Product Type
- By Source
- By Function
- By End User
- Australia & New Zealand
- Pricing Analysis
- Market Share Analysis, 2025
- By Product Type
- By Source
- By Function
- By End User
- China
- Pricing Analysis
- Market Share Analysis, 2025
- By Product Type
- By Source
- By Function
- By End User
- Japan
- Pricing Analysis
- Market Share Analysis, 2025
- By Product Type
- By Source
- By Function
- By End User
- South Korea
- Pricing Analysis
- Market Share Analysis, 2025
- By Product Type
- By Source
- By Function
- By End User
- Russia
- Pricing Analysis
- Market Share Analysis, 2025
- By Product Type
- By Source
- By Function
- By End User
- Poland
- Pricing Analysis
- Market Share Analysis, 2025
- By Product Type
- By Source
- By Function
- By End User
- Hungary
- Pricing Analysis
- Market Share Analysis, 2025
- By Product Type
- By Source
- By Function
- By End User
- Kingdom of Saudi Arabia
- Pricing Analysis
- Market Share Analysis, 2025
- By Product Type
- By Source
- By Function
- By End User
- Türkiye
- Pricing Analysis
- Market Share Analysis, 2025
- By Product Type
- By Source
- By Function
- By End User
- South Africa
- Pricing Analysis
- Market Share Analysis, 2025
- By Product Type
- By Source
- By Function
- By End User
- USA
- Market Structure Analysis
- Competition Dashboard
- Competition Benchmarking
- Market Share Analysis of Top Players
- By Regional
- By Product Type
- By Source
- By Function
- By End User
- Emerging Startups
- Innovation Benchmarking
- Competition Analysis
- Competition Deep Dive
- KitoZyme
- Overview
- Product Portfolio
- Profitability by Market Segments (Product/Region/Sales Channel)
- Sales Footprint
- Strategy Overview
- Marketing Strategy
- Product Strategy
- Channel Strategy
- Heppe Medical Chitosan
- ChitoLytic
- Insectta
- BASF
- Givaudan
- Croda
- Ashland
- Evonik
- Symrise
- Zhejiang Golden Shell Medical Technology
- Tidal Vision
- Chitosan Global
- KitoZyme
- Case Studies
- Success Stories
- Recent Developments
- Competition Deep Dive
- Assumptions & Acronyms Used


