Cocoa Flavanol Market Size and Share Forecast Outlook 2025 to 2035

The cocoa flavanol market was estimated at USD 456.2 million in 2025 and is forecast to grow to USD 643.5 million by 2035, at a 3.5% CAGR. Powdered flavanol-rich cocoa extracts are preferred for inclusion in supplements, fortified drinks, and confections, while liquid concentrates remain niche.
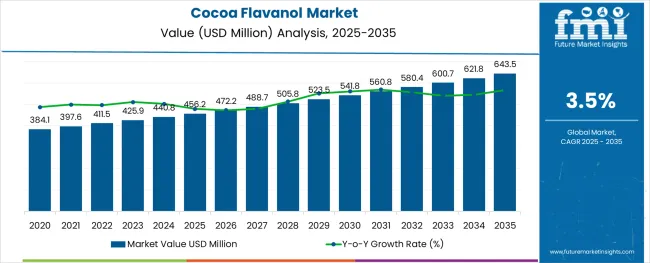
Quick Stats of the Cocoa Flavanol Market

  • Cocoa Flavanol Market Size (2025): USD 456.2 million
  • Cocoa Flavanol Market Value (2035): USD 643.5 million
  • Forecast CAGR of the Cocoa Flavanol Market (2025 to 2035): 3.5%
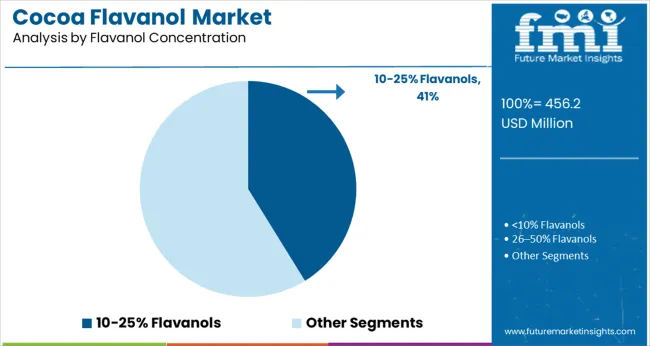
  • Leading Segment in the Cocoa Flavanol Market: 10-25% Flavanols (41%)
  • Key Players of the Cocoa Flavanol Market: Barry Callebaut, Naturex, Nexira, Indena S.p.A., Mars Inc.

Cocoa Flavanol Market Market Value Analysis

Metric Value
Industry Size (2025E) USD 456.2 million
Industry Value (2035F) USD 643.5 million
CAGR (2025 to 2035) 3.5%

It is argued that brands offering standardized flavanol profiles (>30% purity), transparent sourcing, and clear health claims will outperform generic cocoa suppliers. Inconsistent extraction quality and variable regulatory frameworks are being cited as adoption barriers unless certification standards and safety validation are strengthened. Consolidation is expected as leading ingredient firms integrate flavanol-specific capabilities to secure high-value natural antioxidant portfolios.

The cocoa flavanol market holds a niche share within its parent markets. In the cocoa and chocolate market, it accounts for approximately 3-5%, as cocoa flavanols are one of the many bioactive compounds in cocoa. Within the functional foods market, the share is around 2-3%, driven by the increasing use of cocoa flavanols in foods with added health benefits.

In the nutraceuticals market, the share is about 4-6%, as cocoa flavanols are widely used in supplements. In the health and wellness food market, its share is approximately 2-3%, reflecting growing interest in heart-healthy foods. In the natural antioxidants market, the share is around 1-2%, as cocoa flavanols contribute to the antioxidant properties of various products.

Analyzing Cocoa Flavanol Market by Top Investment Segments

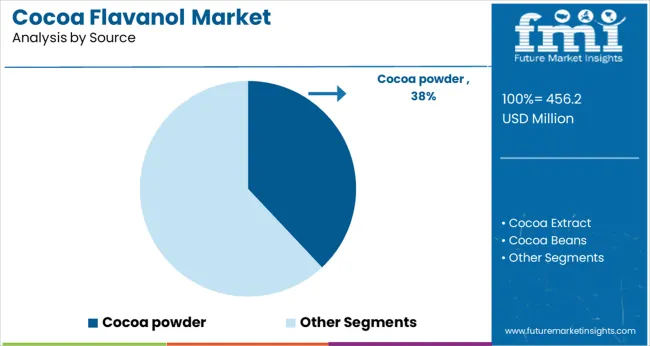
In 2025, the cocoa flavanol market will be led by powder form with 30% share, cocoa powder as the primary source at 38%, 10-25% flavanol concentration at 41%, dietary supplements at 37% in applications, heart health claims at 39%, water extraction technology at 32%, and B2B sales channels at 58%.
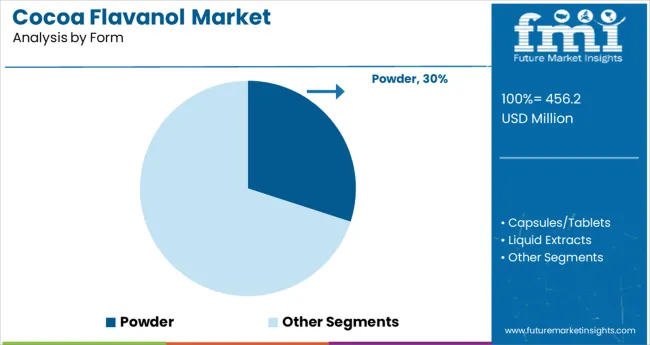
Powder form leads the market with 30% share

Cocoa Flavanol Market Analysis By Form

Powder form is expected to dominate the cocoa flavanol market in 2025, holding a 30% market share. Cocoa flavanol powder is highly versatile and widely used across various applications, including dietary supplements, beverages, and functional foods. Its easy incorporation into food and drink formulations, as well as its long shelf life, makes it a preferred form for both consumers and manufacturers.

Additionally, powdered cocoa flavanol provides a concentrated source of antioxidants, making it ideal for health-focused products. The rise in consumer interest in functional foods and beverages is further driving the demand for cocoa flavanol powder.
  • Versatile and easy to incorporate into various food and beverage products
  • Provides concentrated antioxidants, making it ideal for health-focused formulations
  • Ideal for use in dietary supplements and functional foods

Cocoa powder leads the source segment with 38% share

Cocoa Flavanol Market Analysis By Source

Cocoa powder is expected to capture 38% of the market share in 2025 as the dominant source of cocoa flavanols. Cocoa powder is rich in bioactive compounds, including flavanols, which have been shown to support cardiovascular health, cognitive function, and overall wellness.

As a widely accepted ingredient in both the food and supplement industries, cocoa powder is increasingly being incorporated into health-oriented products such as energy bars, protein powders, and functional beverages. The demand for natural and minimally processed ingredients has further solidified cocoa powder’s position as the leading source of cocoa flavanols.
  • Rich in flavanols, supporting health claims like heart health and cognitive function
  • Widely used in food, beverage, and supplement formulations
  • Natural, minimally processed ingredient favored by health-conscious consumers

10-25% flavanol concentration dominates with 41% share

Cocoa Flavanol Market Analysis By Flavanol Concentration

Flavanol concentrations between 10-25% are projected to capture 41% of the market share in 2025. This concentration range strikes the optimal balance between health benefits and product versatility, making it ideal for various dietary and functional applications.

It is particularly popular for its cardiovascular health benefits, with several studies linking moderate flavanol intake to reduced risk factors for heart disease. Products in this concentration range are commonly used in dietary supplements and functional foods, as they offer sufficient potency while maintaining an acceptable taste and texture profile.
  • Optimal concentration for a broad range of dietary and functional food applications
  • Preferred for cardiovascular health benefits and general wellness
  • Commonly used in supplements and functional foods for everyday consumption

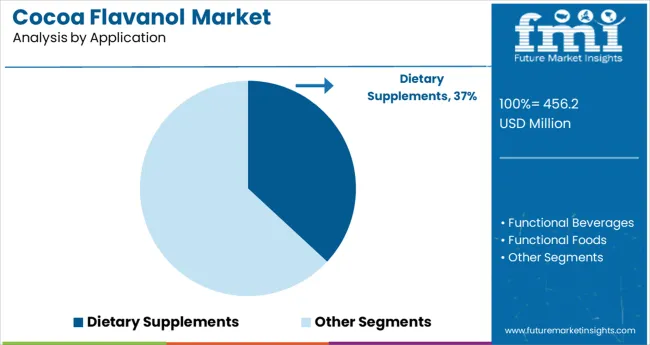
Dietary supplements lead application segment with 37% share

Cocoa Flavanol Market Analysis By Application

Dietary supplements are expected to dominate the application segment with 37% of the market share in 2025. Cocoa flavanols, particularly in powder and capsule form, are increasingly being used to support heart health, cognitive function, and overall wellness.

The growing trend towards preventative healthcare and the increasing demand for plant-based, clean-label supplements will continue to drive the popularity of cocoa flavanols in this segment. As awareness of flavanol’s health benefits continues to rise, more consumers will seek out dietary supplements fortified with cocoa flavanols as part of their daily health regimen.
  • Growing demand for preventative healthcare fuels the popularity of dietary supplements
  • Supports cardiovascular health, cognitive function, and overall wellness
  • Popular for plant-based, clean-label supplements targeting health-conscious consumers

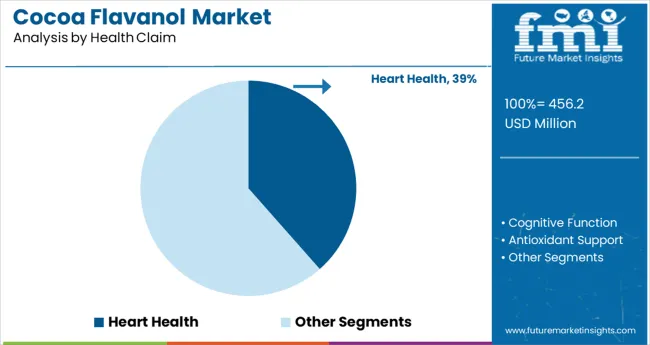
Heart health claims lead with 39% share

Cocoa Flavanol Market Analysis By Health Claim

Heart health claims are expected to capture 39% of the health claim segment in 2025, making it the dominant focus of cocoa flavanol products. The flavanols found in cocoa have been extensively studied for their positive effects on heart health, including improving blood flow, reducing blood pressure, and supporting overall cardiovascular function.

As consumers become more aware of the importance of heart health and the benefits of cocoa flavanols, products with heart health claims will continue to drive the market. This trend will be further supported by clinical research and regulatory approval of cocoa-based health claims.
  • Proven cardiovascular benefits drive demand for heart health claims in cocoa products
  • Flavanols support improved blood flow, reduced blood pressure, and overall heart health
  • Growing consumer awareness boosts market demand for heart-health-focused cocoa products

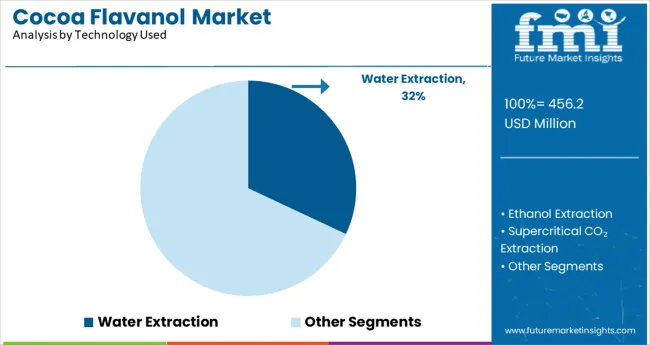
Water extraction technology leads with 32% market share

Cocoa Flavanol Market Analysis By Technology Used

Water extraction is projected to hold 32% of the market share in 2025, making it the leading technology in cocoa flavanol extraction. This method is preferred for its ability to extract high-quality flavanols while maintaining the natural composition and health benefits of cocoa.

Water extraction is a clean, environmentally friendly process that does not require harsh chemicals, aligning with consumer demand for natural and sustainable products. This technology is particularly favored in the production of functional foods and dietary supplements, where purity and ingredient transparency are highly valued.
  • Clean, sustainable extraction method that preserves the natural integrity of cocoa
  • Preferred for high-quality, pure flavanols in food and supplement products
  • Increasingly popular due to growing demand for natural and environmentally friendly production methods

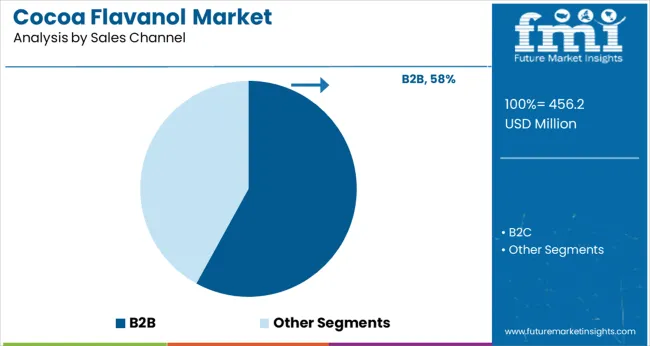
B2B sales channels dominate with 58% market share

Cocoa Flavanol Market Analysis By Sales Channel

B2B sales channels are expected to dominate with 58% of the market share in 2025. As cocoa flavanols are widely used in industrial applications such as food and beverage manufacturing, dietary supplements, and pharmaceutical products, the B2B model is essential for distributing large quantities to manufacturers, ingredient suppliers, and health product companies.

B2B channels ensure a steady supply of cocoa flavanols to meet the growing demand for functional ingredients in consumer products. As the market expands, B2B sales channels will continue to drive growth and facilitate the integration of cocoa flavanols into diverse product lines.
  • Essential distribution model for large-scale buyers in food, beverage, and supplement sectors
  • Facilitates supply chain continuity and bulk purchasing for ingredient suppliers
  • Ensures steady growth of the cocoa flavanol market through industrial-scale production and distribution

Top Countries Advancing, Extracting, and Formulating Cocoa Flavanols

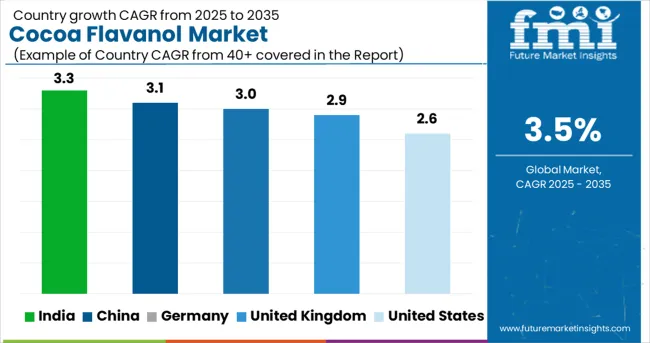
Cocoa Flavanol Market Cagr Analysis By Country

Countries CAGR (2025 to 2035)
United States 2.6%
United Kingdom 2.9%
China 3.1%
India 3.3%
Germany 3%

Global cocoa flavanol market demand is projected to rise at a 3.5% value-based CAGR from 2025 to 2035. Of the five profiled markets out of 40 covered, India leads at 3.3%, followed by China at 3.1%, and the United Kingdom at 2.9%, while the United States posts 2.6%, and Germany records -3%.

These rates translate to a growth premium of -5% for India, -11% for China, and -24% for Germany versus the baseline, while the United States and the United Kingdom show slower growth. Divergence reflects local catalysts: growing demand for health-focused food products in India and China, along with stable but slower growth in the more mature markets of the United States, Germany, and the United Kingdom, driven by established cocoa consumption habits.

Cocoa Flavanol Market Growth Outlook in the United States

Cocoa flavanol sales in the United States are projected to grow at a 2.6% CAGR from 2025 to 2035. The market is expanding through cardiovascular health positioning across functional chocolates and supplement categories. Medical professionals increasingly recommend flavanol capsules as complementary support for circulatory function.

Brands are focusing on low-processed, unsweetened cocoa products with quantified flavanol content to meet wellness claims. Supermarkets and pharmacies are expanding shelf space for flavanol-enhanced products aimed at aging consumers. The inclusion of cocoa flavanols in preventive health bundles and subscription models reflects rising acceptance of these compounds as everyday dietary components.

  • Health insurers have added flavanol-rich supplements to aging wellness kits.
  • Clinical guidelines for metabolic syndrome increasingly reference flavanol benefits.
  • Convenience stores are piloting ready-to-drink cocoa shots containing flavanols.

Future Outlook for Cocoa Flavanol Market in the United Kingdom

In the United Kingdom, cocoa flavanol market growth is expected at a 2.9% CAGR through 2035. British consumers are adopting polyphenol-rich diets, leading to a rise in flavanol-centric product launches within confectionery and nutraceutical spaces. Health-focused retailers are promoting low-sugar cocoa powders labeled with precise flavanol levels.

Elderly consumers and wellness-conscious millennials are driving demand for cardiovascular and cognitive health-supportive products. Chocolatiers are adjusting production methods to retain natural flavanol concentrations, offering an edge in premium-positioned items. Distribution via pharmacy chains and online wellness stores is increasing across major cities.

  • NHS-backed trials have evaluated flavanols in vascular elasticity studies.
  • Food bloggers highlight flavanol levels in recipe recommendations for daily polyphenol intake.
  • Specialist stores now offer flavanol-rich cocoa nibs as single-ingredient superfoods.

Demand Forecast for Cocoa Flavanol Market in China

China’s cocoa flavanol market is forecasted to expand at a CAGR of 3.1% from 2025 to 2035. Urban consumers, especially young professionals, are seeking nutritional benefits in low-sugar dark chocolates and functional beverages. Multinational firms are launching beauty and metabolic health supplements fortified with standardized flavanol extracts.

Flavanol-enhanced snack bars and instant cocoa mixes are being promoted as performance boosters. Cross-border e-commerce imports remain key to premium flavanol product availability, while local firms are partnering with research institutions to validate claims. China’s regulatory structure is increasingly favorable for functional food claims linked to flavanol bioactivity.

  • Nutrition brands now feature flavanol-rich SKUs in fitness livestream sales.
  • Cocoa-extract-based effervescent tablets are gaining traction in metro cities.
  • University-led consumer trials are testing cocoa flavanol effects on cognition.

Cocoa Flavanol Market Trends in India

India’s cocoa flavanol market is estimated to grow at a CAGR of 3.3% between 2025 and 2035. Urban nutrition brands are incorporating flavanols into wellness beverages and immunity powders. Cocoa flavanol products targeting heart health and blood pressure support are being promoted through direct-to-consumer platforms.

Ayurveda-based companies are integrating cocoa flavanols with traditional botanicals in ready-mix sachets and daily-use capsules. Growing consumer interest in clean-label and scientifically validated ingredients is supporting broader adoption. Demand is highest in Tier 1 and Tier 2 cities, where preventive health behavior is most active.

  • Institutional buyers are sourcing flavanol-rich products for cardiac wellness kits.
  • Herbal pharmacies are testing flavanol-tulsi combinations in beverage form.
  • Gym franchises promote cocoa flavanol mixes in post-workout offerings.

Analysis of Cocoa Flavanol Market in Germany

Germany’s cocoa flavanol market is forecasted to grow at a CAGR of 3% during 2025-2035. German consumers prioritize clinical validation, driving interest in flavanol supplements marketed with EFSA-compliant claims. Pharmacies are stocking single-origin cocoa powders with lab-certified flavanol concentrations.

Regional health insurers and senior wellness programs include flavanol products in prevention-focused initiatives. Local manufacturers are refining low-temperature processing to ensure flavanol preservation in chocolate formats. Sales of cognitive and vascular health-focused nutraceuticals containing cocoa flavanols continue to rise in wellness channels across Bavaria, Baden-Württemberg, and North Rhine-Westphalia.
  • Flavanol-rich chocolates are featured in neurologist-led cognitive care protocols.
  • Independent labs offer flavanol testing kits to chocolate manufacturers.
  • Regional fairs highlight bean varieties with superior flavanol yields.

Leading Cocoa Flavanol Market Suppliers

Cocoa Flavanol Market Analysis By Company

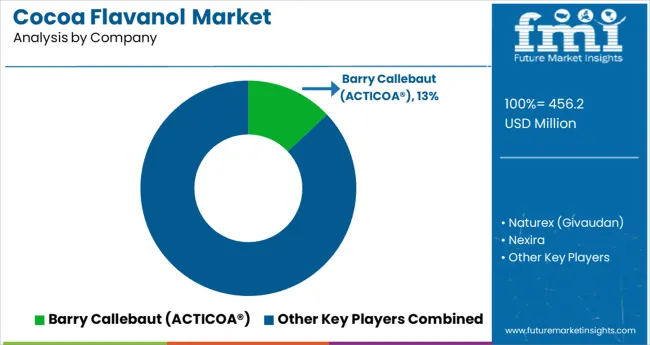
In the cocoa flavanol market, product positioning has revolved around concentration levels, certification strength, and ingredient flexibility. Barry Callebaut is leading by supplying ACTICOA® flavanol-rich cocoa powder to global pharmaceutical and consumer beverage manufacturers, supported by vertically integrated sourcing from West African farms and press-ready processing streams.

Givaudan’sNaturex unit and Nexira have targeted functional beverage and supplement sectors through modular powder systems and private-label blending for European formulators. Indena has delivered clinical-grade extracts for nutraceutical applications in North America. Mars’ CocoaVia® brand has capitalized on consumer-brand pull in USA retail channels, leveraging DTC subscriptions and FDA-approved structure/function claims, while navigating EU novel-food registration and flavanol content labeling.

Recent Industry News

  • In February 2023, the FDA granted enforcement discretion for qualified health claims linking high-flavanol cocoa powder to cardiovascular health. While scientific backing was limited, this move allowed marketers to highlight potential heart benefits in cocoa-derived products.
  • In spring 2023, Meiji Group developed a pink-hued, fruity cocoa flavanol extract. The innovation laid the groundwork for a new flavanol-rich beverage, targeting functional drink categories and expanding cocoa’s role in health-forward product lines.

Key Players in the Cocoa Flavanol Market

  • Barry Callebaut (ACTICOA®)
  • Naturex (Givaudan)
  • Nexira
  • Indena S.p.A.
  • Mars Inc. (CocoaVia®)
  • Others

Report Scope

Attribute Category Details
Industry Size (2025E) USD 456.2 million
Projected Industry Value (2035F) USD 643.5 million
Value-based CAGR (2025-2035) 3.5%
Base Year for Estimation 2024
Historical Period 2020 to 2024
Projections Period 2025 to 2035
Report Parameter Revenue in USD million / Volume in metric tons
By Form Powder, Capsules/Tablets, Liquid Extracts, RTD Drinks, Chocolates/Bars
By Source Cocoa Powder, Cocoa Extract, Cocoa Beans
By Flavanol Concentration <10% Flavanols, 10-25% Flavanols, 26-50% Flavanols, > 50% Flavanols
By Application Dietary Supplements, Functional Beverages, Functional Foods, Pharmaceuticals, Cosmetics & Personal Care
By Health Claim Heart Health, Cognitive Function, Antioxidant Support, Skin Health, Blood Pressure Management
By Technology Used Water Extraction, Ethanol Extraction, Supercritical CO₂ Extraction, Membrane Filtration
By Sales Channel B2B (Ingredient Supply), B2C (Retail Supplements & Products) - Online Retail, Specialty Stores, Pharmacies, Supermarkets
By Region North America, Latin America, Western Europe, Eastern Europe, East Asia, South Asia & Pacific, Central Asia, Balkan and Baltic Countries, Russia & Belarus, Middle East & Africa
Countries Covered United States, Canada, Brazil, Mexico, Germany, France, United Kingdom, Italy, Netherlands, Spain, India, China, Japan, South Korea, Indonesia, Australia, Saudi Arabia, South Africa, United Arab Emirates
Key Players Barry Callebaut (ACTICOA®), Naturex (Givaudan), Nexira, Indena S.p.A., Mars Inc. (CocoaVia ®)
Additional Attributes Dollar by sales, share by form and flavanol content, innovation in flavanol extraction, cross-industry health claims validation, consumer acceptance in cardiovascular wellness, and increased usage in clinical-grade formulations

Cocoa Flavanol Market Analyzed by Key Investment Segments

By Form:

Form segmentation includes powder, capsules/tablets, liquid extracts, RTD drinks, and chocolates/bars.

By Source:

Sources include cocoa powder, cocoa extract, and cocoa beans.

By Flavanol Concentration:

Concentration levels are segmented into <10% flavanols, 10-25% flavanols, 26-50% flavanols, and >50% flavanols.

By Application:

Applications cover dietary supplements, functional beverages, functional foods, pharmaceuticals, and cosmetics & personal care.

By Health Claim:

Health claims include heart health, cognitive function, antioxidant support, skin health, and blood pressure management.

By Technology Used:

Extraction technologies include water extraction, ethanol extraction, supercritical CO₂ extraction, and membrane filtration.

By Sales Channel:

Sales channels are segmented into B2B (ingredient supply) and B2C (retail supplements & products), which includes online retail, specialty stores, pharmacies, and supermarkets.

By Region:

Regional analysis includes North America, Latin America, Eastern Europe, Western Europe, East Asia, South Asia & Pacific, Central Asia, Balkan and Baltic Countries, Russia & Belarus, and the Middle East & Africa.

Table of Content

  1. Executive Summary
    • Global Market Outlook
    • Demand-side Trends
    • Supply-side Trends
    • Technology Roadmap Analysis
    • Analysis and Recommendations
  2. Market Overview
    • Market Coverage / Taxonomy
    • Market Definition / Scope / Limitations
  3. Market Background
    • Market Dynamics
      • Drivers
      • Restraints
      • Opportunity
      • Trends
    • Scenario Forecast
      • Demand in Optimistic Scenario
      • Demand in Likely Scenario
      • Demand in Conservative Scenario
    • Opportunity Map Analysis
    • Product Life Cycle Analysis
    • Supply Chain Analysis
      • Supply Side Participants and their Roles
        • Producers
        • Mid-Level Participants (Traders/ Agents/ Brokers)
        • Wholesalers and Distributors
      • Value Added and Value Created at Node in the Supply Chain
      • List of Raw Material Suppliers
      • List of Existing and Potential Buyer’s
    • Investment Feasibility Matrix
    • Value Chain Analysis
      • Profit Margin Analysis
      • Wholesalers and Distributors
      • Retailers
    • PESTLE and Porter’s Analysis
    • Regulatory Landscape
      • By Key Regions
      • By Key Countries
    • Regional Parent Market Outlook
    • Production and Consumption Statistics
    • Import and Export Statistics
  4. Global Market Analysis 2020 to 2024 and Forecast, 2025 to 2035
    • Historical Market Size Value (USD Million) & Volume (Metric Tons) Analysis, 2020 to 2024
    • Current and Future Market Size Value (USD Million) & Volume (Metric Tons) Projections, 2025 to 2035
      • Y-o-Y Growth Trend Analysis
      • Absolute $ Opportunity Analysis
  5. Global Market Pricing Analysis 2020 to 2024 and Forecast 2025 to 2035
  6. Global Market Analysis 2020 to 2024 and Forecast 2025 to 2035, By From
    • Introduction / Key Findings
    • Historical Market Size Value (USD Million) & Volume (Metric Tons) Analysis By From, 2020 to 2024
    • Current and Future Market Size Value (USD Million) & Volume (Metric Tons) Analysis and Forecast By From, 2025 to 2035
      • Powder
      • Capsules/Tablets
      • Liquid Extracts
      • RTD Drinks
      • Chocolates/Bars
    • Y-o-Y Growth Trend Analysis By From, 2020 to 2024
    • Absolute $ Opportunity Analysis By From, 2025 to 2035
  7. Global Market Analysis 2020 to 2024 and Forecast 2025 to 2035, By Source
    • Introduction / Key Findings
    • Historical Market Size Value (USD Million) & Volume (Metric Tons) Analysis By Source, 2020 to 2024
    • Current and Future Market Size Value (USD Million) & Volume (Metric Tons) Analysis and Forecast By Source, 2025 to 2035
      • Cocoa Powder
      • Cocoa Extract
      • Cocoa Beans
    • Y-o-Y Growth Trend Analysis By Source, 2020 to 2024
    • Absolute $ Opportunity Analysis By Source, 2025 to 2035
  8. Global Market Analysis 2020 to 2024 and Forecast 2025 to 2035, By Flavanol Concentration
    • Introduction / Key Findings
    • Historical Market Size Value (USD Million) & Volume (Metric Tons) Analysis By Flavanol Concentration, 2020 to 2024
    • Current and Future Market Size Value (USD Million) & Volume (Metric Tons) Analysis and Forecast By Flavanol Concentration, 2025 to 2035
      • <10% Flavanols
      • 10-25% Flavanols
      • 26-50% Flavanols
      • >50% Flavanols
    • Y-o-Y Growth Trend Analysis By Flavanol Concentration, 2020 to 2024
    • Absolute $ Opportunity Analysis By Flavanol Concentration, 2025 to 2035
  9. Global Market Analysis 2020 to 2024 and Forecast 2025 to 2035, By Application
    • Introduction / Key Findings
    • Historical Market Size Value (USD Million) & Volume (Metric Tons) Analysis By Application, 2020 to 2024
    • Current and Future Market Size Value (USD Million) & Volume (Metric Tons) Analysis and Forecast By Application, 2025 to 2035
      • Dietary Supplements
      • Functional Beverages
      • Functional Foods
      • Pharmaceuticals
      • Cosmetics & Personal Care
    • Y-o-Y Growth Trend Analysis By Application, 2020 to 2024
    • Absolute $ Opportunity Analysis By Application, 2025 to 2035
  10. Global Market Analysis 2020 to 2024 and Forecast 2025 to 2035, By Health Claim
    • Introduction / Key Findings
    • Historical Market Size Value (USD Million) & Volume (Metric Tons) Analysis By Health Claim, 2020 to 2024
    • Current and Future Market Size Value (USD Million) & Volume (Metric Tons) Analysis and Forecast By Health Claim, 2025 to 2035
      • Heart Health
      • Cognitive Function
      • Antioxidant Support
      • Skin Health
      • Blood Pressure Management
    • Y-o-Y Growth Trend Analysis By Health Claim, 2020 to 2024
    • Absolute $ Opportunity Analysis By Health Claim, 2025 to 2035
  11. Global Market Analysis 2020 to 2024 and Forecast 2025 to 2035, By Technology Used
    • Introduction / Key Findings
    • Historical Market Size Value (USD Million) & Volume (Metric Tons) Analysis By Technology Used, 2020 to 2024
    • Current and Future Market Size Value (USD Million) & Volume (Metric Tons) Analysis and Forecast By Technology Used, 2025 to 2035
      • Water Extraction
      • Ethanol Extraction
      • Supercritical CO₂ Extraction
      • Membrane Filtration
    • Y-o-Y Growth Trend Analysis By Technology Used, 2020 to 2024
    • Absolute $ Opportunity Analysis By Technology Used, 2025 to 2035
  12. Global Market Analysis 2020 to 2024 and Forecast 2025 to 2035, By Sales Channel
    • Introduction / Key Findings
    • Historical Market Size Value (USD Million) & Volume (Metric Tons) Analysis By Sales Channel, 2020 to 2024
    • Current and Future Market Size Value (USD Million) & Volume (Metric Tons) Analysis and Forecast By Sales Channel, 2025 to 2035
      • B2B
      • B2C
        • Online Retail
        • Specialty Stores
        • Pharmacies
        • Supermarkets
    • Y-o-Y Growth Trend Analysis By Sales Channel, 2020 to 2024
    • Absolute $ Opportunity Analysis By Sales Channel, 2025 to 2035
  13. Global Market Analysis 2020 to 2024 and Forecast 2025 to 2035, By Region
    • Introduction
    • Historical Market Size Value (USD Million) & Volume (Metric Tons) Analysis By Region, 2020 to 2024
    • Current Market Size Value (USD Million) & Volume (Metric Tons) Analysis and Forecast By Region, 2025 to 2035
      • North America
      • Latin America
      • Western Europe
      • Eastern Europe
      • East Asia
      • South Asia & Pacific
      • Middle East and Africa
    • Market Attractiveness Analysis By Region
  14. North America Market Analysis 2020 to 2024 and Forecast 2025 to 2035, By Country
    • Historical Market Size Value (USD Million) & Volume (Metric Tons) Trend Analysis By Market Taxonomy, 2020 to 2024
    • Market Size Value (USD Million) & Volume (Metric Tons) Forecast By Market Taxonomy, 2025 to 2035
      • By Country
        • USA
        • Canada
        • Mexico
      • By From
      • By Source
      • By Flavanol Concentration
      • By Application
      • By Health Claim
      • By Technology Used
      • By Sales Channel
    • Market Attractiveness Analysis
      • By Country
      • By From
      • By Source
      • By Flavanol Concentration
      • By Application
      • By Health Claim
      • By Technology Used
      • By Sales Channel
    • Key Takeaways
  15. Latin America Market Analysis 2020 to 2024 and Forecast 2025 to 2035, By Country
    • Historical Market Size Value (USD Million) & Volume (Metric Tons) Trend Analysis By Market Taxonomy, 2020 to 2024
    • Market Size Value (USD Million) & Volume (Metric Tons) Forecast By Market Taxonomy, 2025 to 2035
      • By Country
        • Brazil
        • Argentina
        • Rest of LATAM
      • By From
      • By Source
      • By Flavanol Concentration
      • By Application
      • By Health Claim
      • By Technology Used
      • By Sales Channel
    • Market Attractiveness Analysis
      • By Country
      • By From
      • By Source
      • By Flavanol Concentration
      • By Application
      • By Health Claim
      • By Technology Used
      • By Sales Channel
    • Key Takeaways
  16. Western Europe Market Analysis 2020 to 2024 and Forecast 2025 to 2035, By Country
    • Historical Market Size Value (USD Million) & Volume (Metric Tons) Trend Analysis By Market Taxonomy, 2020 to 2024
    • Market Size Value (USD Million) & Volume (Metric Tons) Forecast By Market Taxonomy, 2025 to 2035
      • By Country
        • Germany
        • Italy
        • France
        • UK
        • Spain
        • BENELUX
        • Nordic
        • Rest of W.Europe
      • By From
      • By Source
      • By Flavanol Concentration
      • By Application
      • By Health Claim
      • By Technology Used
      • By Sales Channel
    • Market Attractiveness Analysis
      • By Country
      • By From
      • By Source
      • By Flavanol Concentration
      • By Application
      • By Health Claim
      • By Technology Used
      • By Sales Channel
    • Key Takeaways
  17. Eastern Europe Market Analysis 2020 to 2024 and Forecast 2025 to 2035, By Country
    • Historical Market Size Value (USD Million) & Volume (Metric Tons) Trend Analysis By Market Taxonomy, 2020 to 2024
    • Market Size Value (USD Million) & Volume (Metric Tons) Forecast By Market Taxonomy, 2025 to 2035
      • By Country
        • Russia
        • Hungary
        • Poland
        • Balkan & Baltics
        • Rest of E. Europe
      • By From
      • By Source
      • By Flavanol Concentration
      • By Application
      • By Health Claim
      • By Technology Used
      • By Sales Channel
    • Market Attractiveness Analysis
      • By Country
      • By From
      • By Source
      • By Flavanol Concentration
      • By Application
      • By Health Claim
      • By Technology Used
      • By Sales Channel
    • Key Takeaways
  18. East Asia Market Analysis 2020 to 2024 and Forecast 2025 to 2035, By Country
    • Historical Market Size Value (USD Million) & Volume (Metric Tons) Trend Analysis By Market Taxonomy, 2020 to 2024
    • Market Size Value (USD Million) & Volume (Metric Tons) Forecast By Market Taxonomy, 2025 to 2035
      • By Country
        • China
        • Japan
        • South Korea
      • By From
      • By Source
      • By Flavanol Concentration
      • By Application
      • By Health Claim
      • By Technology Used
      • By Sales Channel
    • Market Attractiveness Analysis
      • By Country
      • By From
      • By Source
      • By Flavanol Concentration
      • By Application
      • By Health Claim
      • By Technology Used
      • By Sales Channel
    • Key Takeaways
  19. South Asia & Pacific Market Analysis 2020 to 2024 and Forecast 2025 to 2035, By Country
    • Historical Market Size Value (USD Million) & Volume (Metric Tons) Trend Analysis By Market Taxonomy, 2020 to 2024
    • Market Size Value (USD Million) & Volume (Metric Tons) Forecast By Market Taxonomy, 2025 to 2035
      • By Country
        • India
        • Australia & New Zealand
        • ASEAN
        • Rest of SAP
      • By From
      • By Source
      • By Flavanol Concentration
      • By Application
      • By Health Claim
      • By Technology Used
      • By Sales Channel
    • Market Attractiveness Analysis
      • By Country
      • By From
      • By Source
      • By Flavanol Concentration
      • By Application
      • By Health Claim
      • By Technology Used
      • By Sales Channel
    • Key Takeaways
  20. Middle East and Africa Market Analysis 2020 to 2024 and Forecast 2025 to 2035, By Country
    • Historical Market Size Value (USD Million) & Volume (Metric Tons) Trend Analysis By Market Taxonomy, 2020 to 2024
    • Market Size Value (USD Million) & Volume (Metric Tons) Forecast By Market Taxonomy, 2025 to 2035
      • By Country
        • GCC Countries
        • Northern Africa
        • South Africa
        • Turkiye
        • Rest of MEA
      • By From
      • By Source
      • By Flavanol Concentration
      • By Application
      • By Health Claim
      • By Technology Used
      • By Sales Channel
    • Market Attractiveness Analysis
      • By Country
      • By From
      • By Source
      • By Flavanol Concentration
      • By Application
      • By Health Claim
      • By Technology Used
      • By Sales Channel
    • Key Takeaways
  21. Key Countries Market Analysis
    • USA
      • Pricing Analysis
      • Market Share Analysis, 2024
        • By From
        • By Source
        • By Flavanol Concentration
        • By Application
        • By Health Claim
        • By Technology Used
        • By Sales Channel
    • Canada
      • Pricing Analysis
      • Market Share Analysis, 2024
        • By From
        • By Source
        • By Flavanol Concentration
        • By Application
        • By Health Claim
        • By Technology Used
        • By Sales Channel
    • Brazil
      • Pricing Analysis
      • Market Share Analysis, 2024
        • By From
        • By Source
        • By Flavanol Concentration
        • By Application
        • By Health Claim
        • By Technology Used
        • By Sales Channel
    • Mexico
      • Pricing Analysis
      • Market Share Analysis, 2024
        • By From
        • By Source
        • By Flavanol Concentration
        • By Application
        • By Health Claim
        • By Technology Used
        • By Sales Channel
    • Argentina
      • Pricing Analysis
      • Market Share Analysis, 2024
        • By From
        • By Source
        • By Flavanol Concentration
        • By Application
        • By Health Claim
        • By Technology Used
        • By Sales Channel
  22. Market Structure Analysis
    • Competition Dashboard
    • Competition Benchmarking
    • Market Share Analysis of Top Players
      • By Regional
      • By From
      • By Source
      • By Flavanol Concentration
      • By Application
      • By Health Claim
      • By Technology Used
      • By Sales Channel
  23. Competition Analysis
    • Competition Deep Dive
      • Barry Callebaut (ACTICOA®)
        • Overview
        • Product Portfolio
        • Profitability by Market Segments (Product/Age /Sales Channel/Region)
        • Sales Footprint
        • Strategy Overview
          • Marketing Strategy
          • Product Strategy
          • Channel Strategy
      • Naturex (Givaudan)
        • Overview
        • Product Portfolio
        • Profitability by Market Segments (Product/Age /Sales Channel/Region)
        • Sales Footprint
        • Strategy Overview
          • Marketing Strategy
          • Product Strategy
          • Channel Strategy
      • Nexira
        • Overview
        • Product Portfolio
        • Profitability by Market Segments (Product/Age /Sales Channel/Region)
        • Sales Footprint
        • Strategy Overview
          • Marketing Strategy
          • Product Strategy
          • Channel Strategy
      • Indena S.p.A.
        • Overview
        • Product Portfolio
        • Profitability by Market Segments (Product/Age /Sales Channel/Region)
        • Sales Footprint
        • Strategy Overview
          • Marketing Strategy
          • Product Strategy
          • Channel Strategy
      • Mars Inc. (CocoaVia®)
        • Overview
        • Product Portfolio
        • Profitability by Market Segments (Product/Age /Sales Channel/Region)
        • Sales Footprint
        • Strategy Overview
          • Marketing Strategy
          • Product Strategy
          • Channel Strategy
  24. Assumptions & Acronyms Used
  25. Research Methodology

List of Tables

  • Table 1: Global Market Value (USD Million) Forecast by Region, 2020-2035
  • Table 2: Global Market Volume (Metric Tons) Forecast by Region, 2020-2035
  • Table 3: Global Market Value (USD Million) Forecast by From, 2020-2035
  • Table 4: Global Market Volume (Metric Tons) Forecast by From, 2020-2035
  • Table 5: Global Market Value (USD Million) Forecast by Source, 2020-2035
  • Table 6: Global Market Volume (Metric Tons) Forecast by Source, 2020-2035
  • Table 7: Global Market Value (USD Million) Forecast by Flavanol Concentration, 2020-2035
  • Table 8: Global Market Volume (Metric Tons) Forecast by Flavanol Concentration, 2020-2035
  • Table 9: Global Market Value (USD Million) Forecast by Application, 2020-2035
  • Table 10: Global Market Volume (Metric Tons) Forecast by Application, 2020-2035
  • Table 11: Global Market Value (USD Million) Forecast by Health Claim, 2020-2035
  • Table 12: Global Market Volume (Metric Tons) Forecast by Health Claim, 2020-2035
  • Table 13: Global Market Value (USD Million) Forecast by Technology Used, 2020-2035
  • Table 14: Global Market Volume (Metric Tons) Forecast by Technology Used, 2020-2035
  • Table 15: Global Market Value (USD Million) Forecast by Sales Channel, 2020-2035
  • Table 16: Global Market Volume (Metric Tons) Forecast by Sales Channel, 2020-2035
  • Table 17: North America Market Value (USD Million) Forecast by Country, 2020-2035
  • Table 18: North America Market Volume (Metric Tons) Forecast by Country, 2020-2035
  • Table 19: North America Market Value (USD Million) Forecast by From, 2020-2035
  • Table 20: North America Market Volume (Metric Tons) Forecast by From, 2020-2035
  • Table 21: North America Market Value (USD Million) Forecast by Source, 2020-2035
  • Table 22: North America Market Volume (Metric Tons) Forecast by Source, 2020-2035
  • Table 23: North America Market Value (USD Million) Forecast by Flavanol Concentration, 2020-2035
  • Table 24: North America Market Volume (Metric Tons) Forecast by Flavanol Concentration, 2020-2035
  • Table 25: North America Market Value (USD Million) Forecast by Application, 2020-2035
  • Table 26: North America Market Volume (Metric Tons) Forecast by Application, 2020-2035
  • Table 27: North America Market Value (USD Million) Forecast by Health Claim, 2020-2035
  • Table 28: North America Market Volume (Metric Tons) Forecast by Health Claim, 2020-2035
  • Table 29: North America Market Value (USD Million) Forecast by Technology Used, 2020-2035
  • Table 30: North America Market Volume (Metric Tons) Forecast by Technology Used, 2020-2035
  • Table 31: North America Market Value (USD Million) Forecast by Sales Channel, 2020-2035
  • Table 32: North America Market Volume (Metric Tons) Forecast by Sales Channel, 2020-2035
  • Table 33: Latin America Market Value (USD Million) Forecast by Country, 2020-2035
  • Table 34: Latin America Market Volume (Metric Tons) Forecast by Country, 2020-2035
  • Table 35: Latin America Market Value (USD Million) Forecast by From, 2020-2035
  • Table 36: Latin America Market Volume (Metric Tons) Forecast by From, 2020-2035
  • Table 37: Latin America Market Value (USD Million) Forecast by Source, 2020-2035
  • Table 38: Latin America Market Volume (Metric Tons) Forecast by Source, 2020-2035
  • Table 39: Latin America Market Value (USD Million) Forecast by Flavanol Concentration, 2020-2035
  • Table 40: Latin America Market Volume (Metric Tons) Forecast by Flavanol Concentration, 2020-2035
  • Table 41: Latin America Market Value (USD Million) Forecast by Application, 2020-2035
  • Table 42: Latin America Market Volume (Metric Tons) Forecast by Application, 2020-2035
  • Table 43: Latin America Market Value (USD Million) Forecast by Health Claim, 2020-2035
  • Table 44: Latin America Market Volume (Metric Tons) Forecast by Health Claim, 2020-2035
  • Table 45: Latin America Market Value (USD Million) Forecast by Technology Used, 2020-2035
  • Table 46: Latin America Market Volume (Metric Tons) Forecast by Technology Used, 2020-2035
  • Table 47: Latin America Market Value (USD Million) Forecast by Sales Channel, 2020-2035
  • Table 48: Latin America Market Volume (Metric Tons) Forecast by Sales Channel, 2020-2035
  • Table 49: Western Europe Market Value (USD Million) Forecast by Country, 2020-2035
  • Table 50: Western Europe Market Volume (Metric Tons) Forecast by Country, 2020-2035
  • Table 51: Western Europe Market Value (USD Million) Forecast by From, 2020-2035
  • Table 52: Western Europe Market Volume (Metric Tons) Forecast by From, 2020-2035
  • Table 53: Western Europe Market Value (USD Million) Forecast by Source, 2020-2035
  • Table 54: Western Europe Market Volume (Metric Tons) Forecast by Source, 2020-2035
  • Table 55: Western Europe Market Value (USD Million) Forecast by Flavanol Concentration, 2020-2035
  • Table 56: Western Europe Market Volume (Metric Tons) Forecast by Flavanol Concentration, 2020-2035
  • Table 57: Western Europe Market Value (USD Million) Forecast by Application, 2020-2035
  • Table 58: Western Europe Market Volume (Metric Tons) Forecast by Application, 2020-2035
  • Table 59: Western Europe Market Value (USD Million) Forecast by Health Claim, 2020-2035
  • Table 60: Western Europe Market Volume (Metric Tons) Forecast by Health Claim, 2020-2035
  • Table 61: Western Europe Market Value (USD Million) Forecast by Technology Used, 2020-2035
  • Table 62: Western Europe Market Volume (Metric Tons) Forecast by Technology Used, 2020-2035
  • Table 63: Western Europe Market Value (USD Million) Forecast by Sales Channel, 2020-2035
  • Table 64: Western Europe Market Volume (Metric Tons) Forecast by Sales Channel, 2020-2035
  • Table 65: Eastern Europe Market Value (USD Million) Forecast by Country, 2020-2035
  • Table 66: Eastern Europe Market Volume (Metric Tons) Forecast by Country, 2020-2035
  • Table 67: Eastern Europe Market Value (USD Million) Forecast by From, 2020-2035
  • Table 68: Eastern Europe Market Volume (Metric Tons) Forecast by From, 2020-2035
  • Table 69: Eastern Europe Market Value (USD Million) Forecast by Source, 2020-2035
  • Table 70: Eastern Europe Market Volume (Metric Tons) Forecast by Source, 2020-2035
  • Table 71: Eastern Europe Market Value (USD Million) Forecast by Flavanol Concentration, 2020-2035
  • Table 72: Eastern Europe Market Volume (Metric Tons) Forecast by Flavanol Concentration, 2020-2035
  • Table 73: Eastern Europe Market Value (USD Million) Forecast by Application, 2020-2035
  • Table 74: Eastern Europe Market Volume (Metric Tons) Forecast by Application, 2020-2035
  • Table 75: Eastern Europe Market Value (USD Million) Forecast by Health Claim, 2020-2035
  • Table 76: Eastern Europe Market Volume (Metric Tons) Forecast by Health Claim, 2020-2035
  • Table 77: Eastern Europe Market Value (USD Million) Forecast by Technology Used, 2020-2035
  • Table 78: Eastern Europe Market Volume (Metric Tons) Forecast by Technology Used, 2020-2035
  • Table 79: Eastern Europe Market Value (USD Million) Forecast by Sales Channel, 2020-2035
  • Table 80: Eastern Europe Market Volume (Metric Tons) Forecast by Sales Channel, 2020-2035
  • Table 81: East Asia Market Value (USD Million) Forecast by Country, 2020-2035
  • Table 82: East Asia Market Volume (Metric Tons) Forecast by Country, 2020-2035
  • Table 83: East Asia Market Value (USD Million) Forecast by From, 2020-2035
  • Table 84: East Asia Market Volume (Metric Tons) Forecast by From, 2020-2035
  • Table 85: East Asia Market Value (USD Million) Forecast by Source, 2020-2035
  • Table 86: East Asia Market Volume (Metric Tons) Forecast by Source, 2020-2035
  • Table 87: East Asia Market Value (USD Million) Forecast by Flavanol Concentration, 2020-2035
  • Table 88: East Asia Market Volume (Metric Tons) Forecast by Flavanol Concentration, 2020-2035
  • Table 89: East Asia Market Value (USD Million) Forecast by Application, 2020-2035
  • Table 90: East Asia Market Volume (Metric Tons) Forecast by Application, 2020-2035
  • Table 91: East Asia Market Value (USD Million) Forecast by Health Claim, 2020-2035
  • Table 92: East Asia Market Volume (Metric Tons) Forecast by Health Claim, 2020-2035
  • Table 93: East Asia Market Value (USD Million) Forecast by Technology Used, 2020-2035
  • Table 94: East Asia Market Volume (Metric Tons) Forecast by Technology Used, 2020-2035
  • Table 95: East Asia Market Value (USD Million) Forecast by Sales Channel, 2020-2035
  • Table 96: East Asia Market Volume (Metric Tons) Forecast by Sales Channel, 2020-2035
  • Table 97: South Asia & Pacific Market Value (USD Million) Forecast by Country, 2020-2035
  • Table 98: South Asia & Pacific Market Volume (Metric Tons) Forecast by Country, 2020-2035
  • Table 99: South Asia & Pacific Market Value (USD Million) Forecast by From, 2020-2035
  • Table 100: South Asia & Pacific Market Volume (Metric Tons) Forecast by From, 2020-2035
  • Table 101: South Asia & Pacific Market Value (USD Million) Forecast by Source, 2020-2035
  • Table 102: South Asia & Pacific Market Volume (Metric Tons) Forecast by Source, 2020-2035
  • Table 103: South Asia & Pacific Market Value (USD Million) Forecast by Flavanol Concentration, 2020-2035
  • Table 104: South Asia & Pacific Market Volume (Metric Tons) Forecast by Flavanol Concentration, 2020-2035
  • Table 105: South Asia & Pacific Market Value (USD Million) Forecast by Application, 2020-2035
  • Table 106: South Asia & Pacific Market Volume (Metric Tons) Forecast by Application, 2020-2035
  • Table 107: South Asia & Pacific Market Value (USD Million) Forecast by Health Claim, 2020-2035
  • Table 108: South Asia & Pacific Market Volume (Metric Tons) Forecast by Health Claim, 2020-2035
  • Table 109: South Asia & Pacific Market Value (USD Million) Forecast by Technology Used, 2020-2035
  • Table 110: South Asia & Pacific Market Volume (Metric Tons) Forecast by Technology Used, 2020-2035
  • Table 111: South Asia & Pacific Market Value (USD Million) Forecast by Sales Channel, 2020-2035
  • Table 112: South Asia & Pacific Market Volume (Metric Tons) Forecast by Sales Channel, 2020-2035
  • Table 113: Middle East and Africa Market Value (USD Million) Forecast by Country, 2020-2035
  • Table 114: Middle East and Africa Market Volume (Metric Tons) Forecast by Country, 2020-2035
  • Table 115: Middle East and Africa Market Value (USD Million) Forecast by From, 2020-2035
  • Table 116: Middle East and Africa Market Volume (Metric Tons) Forecast by From, 2020-2035
  • Table 117: Middle East and Africa Market Value (USD Million) Forecast by Source, 2020-2035
  • Table 118: Middle East and Africa Market Volume (Metric Tons) Forecast by Source, 2020-2035
  • Table 119: Middle East and Africa Market Value (USD Million) Forecast by Flavanol Concentration, 2020-2035
  • Table 120: Middle East and Africa Market Volume (Metric Tons) Forecast by Flavanol Concentration, 2020-2035
  • Table 121: Middle East and Africa Market Value (USD Million) Forecast by Application, 2020-2035
  • Table 122: Middle East and Africa Market Volume (Metric Tons) Forecast by Application, 2020-2035
  • Table 123: Middle East and Africa Market Value (USD Million) Forecast by Health Claim, 2020-2035
  • Table 124: Middle East and Africa Market Volume (Metric Tons) Forecast by Health Claim, 2020-2035
  • Table 125: Middle East and Africa Market Value (USD Million) Forecast by Technology Used, 2020-2035
  • Table 126: Middle East and Africa Market Volume (Metric Tons) Forecast by Technology Used, 2020-2035
  • Table 127: Middle East and Africa Market Value (USD Million) Forecast by Sales Channel, 2020-2035
  • Table 128: Middle East and Africa Market Volume (Metric Tons) Forecast by Sales Channel, 2020-2035

List of Figures

  • Figure 1: Global Market Volume (Metric Tons) Forecast 2020-2035
  • Figure 2: Global Market Pricing Analysis
  • Figure 3: Global Market Value (USD Million) Forecast 2020-2035
  • Figure 4: Global Market Value Share and BPS Analysis by From, 2025 and 2035
  • Figure 5: Global Market Y-o-Y Growth Comparison by From, 2025-2035
  • Figure 6: Global Market Attractiveness Analysis by From
  • Figure 7: Global Market Value Share and BPS Analysis by Source, 2025 and 2035
  • Figure 8: Global Market Y-o-Y Growth Comparison by Source, 2025-2035
  • Figure 9: Global Market Attractiveness Analysis by Source
  • Figure 10: Global Market Value Share and BPS Analysis by Flavanol Concentration, 2025 and 2035
  • Figure 11: Global Market Y-o-Y Growth Comparison by Flavanol Concentration, 2025-2035
  • Figure 12: Global Market Attractiveness Analysis by Flavanol Concentration
  • Figure 13: Global Market Value Share and BPS Analysis by Application, 2025 and 2035
  • Figure 14: Global Market Y-o-Y Growth Comparison by Application, 2025-2035
  • Figure 15: Global Market Attractiveness Analysis by Application
  • Figure 16: Global Market Value Share and BPS Analysis by Health Claim, 2025 and 2035
  • Figure 17: Global Market Y-o-Y Growth Comparison by Health Claim, 2025-2035
  • Figure 18: Global Market Attractiveness Analysis by Health Claim
  • Figure 19: Global Market Value Share and BPS Analysis by Technology Used, 2025 and 2035
  • Figure 20: Global Market Y-o-Y Growth Comparison by Technology Used, 2025-2035
  • Figure 21: Global Market Attractiveness Analysis by Technology Used
  • Figure 22: Global Market Value Share and BPS Analysis by Sales Channel, 2025 and 2035
  • Figure 23: Global Market Y-o-Y Growth Comparison by Sales Channel, 2025-2035
  • Figure 24: Global Market Attractiveness Analysis by Sales Channel
  • Figure 25: Global Market Value (USD Million) Share and BPS Analysis by Region, 2025 and 2035
  • Figure 26: Global Market Y-o-Y Growth Comparison by Region, 2025-2035
  • Figure 27: Global Market Attractiveness Analysis by Region
  • Figure 28: North America Market Incremental $ Opportunity, 2025-2035
  • Figure 29: Latin America Market Incremental $ Opportunity, 2025-2035
  • Figure 30: Western Europe Market Incremental $ Opportunity, 2025-2035
  • Figure 31: Eastern Europe Market Incremental $ Opportunity, 2025-2035
  • Figure 32: East Asia Market Incremental $ Opportunity, 2025-2035
  • Figure 33: South Asia & Pacific Market Incremental $ Opportunity, 2025-2035
  • Figure 34: Middle East and Africa Market Incremental $ Opportunity, 2025-2035
  • Figure 35: North America Market Value Share and BPS Analysis by Country, 2025 and 2035
  • Figure 36: North America Market Value Share and BPS Analysis by From, 2025 and 2035
  • Figure 37: North America Market Y-o-Y Growth Comparison by From, 2025-2035
  • Figure 38: North America Market Attractiveness Analysis by From
  • Figure 39: North America Market Value Share and BPS Analysis by Source, 2025 and 2035
  • Figure 40: North America Market Y-o-Y Growth Comparison by Source, 2025-2035
  • Figure 41: North America Market Attractiveness Analysis by Source
  • Figure 42: North America Market Value Share and BPS Analysis by Flavanol Concentration, 2025 and 2035
  • Figure 43: North America Market Y-o-Y Growth Comparison by Flavanol Concentration, 2025-2035
  • Figure 44: North America Market Attractiveness Analysis by Flavanol Concentration
  • Figure 45: North America Market Value Share and BPS Analysis by Application, 2025 and 2035
  • Figure 46: North America Market Y-o-Y Growth Comparison by Application, 2025-2035
  • Figure 47: North America Market Attractiveness Analysis by Application
  • Figure 48: North America Market Value Share and BPS Analysis by Health Claim, 2025 and 2035
  • Figure 49: North America Market Y-o-Y Growth Comparison by Health Claim, 2025-2035
  • Figure 50: North America Market Attractiveness Analysis by Health Claim
  • Figure 51: North America Market Value Share and BPS Analysis by Technology Used, 2025 and 2035
  • Figure 52: North America Market Y-o-Y Growth Comparison by Technology Used, 2025-2035
  • Figure 53: North America Market Attractiveness Analysis by Technology Used
  • Figure 54: North America Market Value Share and BPS Analysis by Sales Channel, 2025 and 2035
  • Figure 55: North America Market Y-o-Y Growth Comparison by Sales Channel, 2025-2035
  • Figure 56: North America Market Attractiveness Analysis by Sales Channel
  • Figure 57: Latin America Market Value Share and BPS Analysis by Country, 2025 and 2035
  • Figure 58: Latin America Market Value Share and BPS Analysis by From, 2025 and 2035
  • Figure 59: Latin America Market Y-o-Y Growth Comparison by From, 2025-2035
  • Figure 60: Latin America Market Attractiveness Analysis by From
  • Figure 61: Latin America Market Value Share and BPS Analysis by Source, 2025 and 2035
  • Figure 62: Latin America Market Y-o-Y Growth Comparison by Source, 2025-2035
  • Figure 63: Latin America Market Attractiveness Analysis by Source
  • Figure 64: Latin America Market Value Share and BPS Analysis by Flavanol Concentration, 2025 and 2035
  • Figure 65: Latin America Market Y-o-Y Growth Comparison by Flavanol Concentration, 2025-2035
  • Figure 66: Latin America Market Attractiveness Analysis by Flavanol Concentration
  • Figure 67: Latin America Market Value Share and BPS Analysis by Application, 2025 and 2035
  • Figure 68: Latin America Market Y-o-Y Growth Comparison by Application, 2025-2035
  • Figure 69: Latin America Market Attractiveness Analysis by Application
  • Figure 70: Latin America Market Value Share and BPS Analysis by Health Claim, 2025 and 2035
  • Figure 71: Latin America Market Y-o-Y Growth Comparison by Health Claim, 2025-2035
  • Figure 72: Latin America Market Attractiveness Analysis by Health Claim
  • Figure 73: Latin America Market Value Share and BPS Analysis by Technology Used, 2025 and 2035
  • Figure 74: Latin America Market Y-o-Y Growth Comparison by Technology Used, 2025-2035
  • Figure 75: Latin America Market Attractiveness Analysis by Technology Used
  • Figure 76: Latin America Market Value Share and BPS Analysis by Sales Channel, 2025 and 2035
  • Figure 77: Latin America Market Y-o-Y Growth Comparison by Sales Channel, 2025-2035
  • Figure 78: Latin America Market Attractiveness Analysis by Sales Channel
  • Figure 79: Western Europe Market Value Share and BPS Analysis by Country, 2025 and 2035
  • Figure 80: Western Europe Market Value Share and BPS Analysis by From, 2025 and 2035
  • Figure 81: Western Europe Market Y-o-Y Growth Comparison by From, 2025-2035
  • Figure 82: Western Europe Market Attractiveness Analysis by From
  • Figure 83: Western Europe Market Value Share and BPS Analysis by Source, 2025 and 2035
  • Figure 84: Western Europe Market Y-o-Y Growth Comparison by Source, 2025-2035
  • Figure 85: Western Europe Market Attractiveness Analysis by Source
  • Figure 86: Western Europe Market Value Share and BPS Analysis by Flavanol Concentration, 2025 and 2035
  • Figure 87: Western Europe Market Y-o-Y Growth Comparison by Flavanol Concentration, 2025-2035
  • Figure 88: Western Europe Market Attractiveness Analysis by Flavanol Concentration
  • Figure 89: Western Europe Market Value Share and BPS Analysis by Application, 2025 and 2035
  • Figure 90: Western Europe Market Y-o-Y Growth Comparison by Application, 2025-2035
  • Figure 91: Western Europe Market Attractiveness Analysis by Application
  • Figure 92: Western Europe Market Value Share and BPS Analysis by Health Claim, 2025 and 2035
  • Figure 93: Western Europe Market Y-o-Y Growth Comparison by Health Claim, 2025-2035
  • Figure 94: Western Europe Market Attractiveness Analysis by Health Claim
  • Figure 95: Western Europe Market Value Share and BPS Analysis by Technology Used, 2025 and 2035
  • Figure 96: Western Europe Market Y-o-Y Growth Comparison by Technology Used, 2025-2035
  • Figure 97: Western Europe Market Attractiveness Analysis by Technology Used
  • Figure 98: Western Europe Market Value Share and BPS Analysis by Sales Channel, 2025 and 2035
  • Figure 99: Western Europe Market Y-o-Y Growth Comparison by Sales Channel, 2025-2035
  • Figure 100: Western Europe Market Attractiveness Analysis by Sales Channel
  • Figure 101: Eastern Europe Market Value Share and BPS Analysis by Country, 2025 and 2035
  • Figure 102: Eastern Europe Market Value Share and BPS Analysis by From, 2025 and 2035
  • Figure 103: Eastern Europe Market Y-o-Y Growth Comparison by From, 2025-2035
  • Figure 104: Eastern Europe Market Attractiveness Analysis by From
  • Figure 105: Eastern Europe Market Value Share and BPS Analysis by Source, 2025 and 2035
  • Figure 106: Eastern Europe Market Y-o-Y Growth Comparison by Source, 2025-2035
  • Figure 107: Eastern Europe Market Attractiveness Analysis by Source
  • Figure 108: Eastern Europe Market Value Share and BPS Analysis by Flavanol Concentration, 2025 and 2035
  • Figure 109: Eastern Europe Market Y-o-Y Growth Comparison by Flavanol Concentration, 2025-2035
  • Figure 110: Eastern Europe Market Attractiveness Analysis by Flavanol Concentration
  • Figure 111: Eastern Europe Market Value Share and BPS Analysis by Application, 2025 and 2035
  • Figure 112: Eastern Europe Market Y-o-Y Growth Comparison by Application, 2025-2035
  • Figure 113: Eastern Europe Market Attractiveness Analysis by Application
  • Figure 114: Eastern Europe Market Value Share and BPS Analysis by Health Claim, 2025 and 2035
  • Figure 115: Eastern Europe Market Y-o-Y Growth Comparison by Health Claim, 2025-2035
  • Figure 116: Eastern Europe Market Attractiveness Analysis by Health Claim
  • Figure 117: Eastern Europe Market Value Share and BPS Analysis by Technology Used, 2025 and 2035
  • Figure 118: Eastern Europe Market Y-o-Y Growth Comparison by Technology Used, 2025-2035
  • Figure 119: Eastern Europe Market Attractiveness Analysis by Technology Used
  • Figure 120: Eastern Europe Market Value Share and BPS Analysis by Sales Channel, 2025 and 2035
  • Figure 121: Eastern Europe Market Y-o-Y Growth Comparison by Sales Channel, 2025-2035
  • Figure 122: Eastern Europe Market Attractiveness Analysis by Sales Channel
  • Figure 123: East Asia Market Value Share and BPS Analysis by Country, 2025 and 2035
  • Figure 124: East Asia Market Value Share and BPS Analysis by From, 2025 and 2035
  • Figure 125: East Asia Market Y-o-Y Growth Comparison by From, 2025-2035
  • Figure 126: East Asia Market Attractiveness Analysis by From
  • Figure 127: East Asia Market Value Share and BPS Analysis by Source, 2025 and 2035
  • Figure 128: East Asia Market Y-o-Y Growth Comparison by Source, 2025-2035
  • Figure 129: East Asia Market Attractiveness Analysis by Source
  • Figure 130: East Asia Market Value Share and BPS Analysis by Flavanol Concentration, 2025 and 2035
  • Figure 131: East Asia Market Y-o-Y Growth Comparison by Flavanol Concentration, 2025-2035
  • Figure 132: East Asia Market Attractiveness Analysis by Flavanol Concentration
  • Figure 133: East Asia Market Value Share and BPS Analysis by Application, 2025 and 2035
  • Figure 134: East Asia Market Y-o-Y Growth Comparison by Application, 2025-2035
  • Figure 135: East Asia Market Attractiveness Analysis by Application
  • Figure 136: East Asia Market Value Share and BPS Analysis by Health Claim, 2025 and 2035
  • Figure 137: East Asia Market Y-o-Y Growth Comparison by Health Claim, 2025-2035
  • Figure 138: East Asia Market Attractiveness Analysis by Health Claim
  • Figure 139: East Asia Market Value Share and BPS Analysis by Technology Used, 2025 and 2035
  • Figure 140: East Asia Market Y-o-Y Growth Comparison by Technology Used, 2025-2035
  • Figure 141: East Asia Market Attractiveness Analysis by Technology Used
  • Figure 142: East Asia Market Value Share and BPS Analysis by Sales Channel, 2025 and 2035
  • Figure 143: East Asia Market Y-o-Y Growth Comparison by Sales Channel, 2025-2035
  • Figure 144: East Asia Market Attractiveness Analysis by Sales Channel
  • Figure 145: South Asia & Pacific Market Value Share and BPS Analysis by Country, 2025 and 2035
  • Figure 146: South Asia & Pacific Market Value Share and BPS Analysis by From, 2025 and 2035
  • Figure 147: South Asia & Pacific Market Y-o-Y Growth Comparison by From, 2025-2035
  • Figure 148: South Asia & Pacific Market Attractiveness Analysis by From
  • Figure 149: South Asia & Pacific Market Value Share and BPS Analysis by Source, 2025 and 2035
  • Figure 150: South Asia & Pacific Market Y-o-Y Growth Comparison by Source, 2025-2035
  • Figure 151: South Asia & Pacific Market Attractiveness Analysis by Source
  • Figure 152: South Asia & Pacific Market Value Share and BPS Analysis by Flavanol Concentration, 2025 and 2035
  • Figure 153: South Asia & Pacific Market Y-o-Y Growth Comparison by Flavanol Concentration, 2025-2035
  • Figure 154: South Asia & Pacific Market Attractiveness Analysis by Flavanol Concentration
  • Figure 155: South Asia & Pacific Market Value Share and BPS Analysis by Application, 2025 and 2035
  • Figure 156: South Asia & Pacific Market Y-o-Y Growth Comparison by Application, 2025-2035
  • Figure 157: South Asia & Pacific Market Attractiveness Analysis by Application
  • Figure 158: South Asia & Pacific Market Value Share and BPS Analysis by Health Claim, 2025 and 2035
  • Figure 159: South Asia & Pacific Market Y-o-Y Growth Comparison by Health Claim, 2025-2035
  • Figure 160: South Asia & Pacific Market Attractiveness Analysis by Health Claim
  • Figure 161: South Asia & Pacific Market Value Share and BPS Analysis by Technology Used, 2025 and 2035
  • Figure 162: South Asia & Pacific Market Y-o-Y Growth Comparison by Technology Used, 2025-2035
  • Figure 163: South Asia & Pacific Market Attractiveness Analysis by Technology Used
  • Figure 164: South Asia & Pacific Market Value Share and BPS Analysis by Sales Channel, 2025 and 2035
  • Figure 165: South Asia & Pacific Market Y-o-Y Growth Comparison by Sales Channel, 2025-2035
  • Figure 166: South Asia & Pacific Market Attractiveness Analysis by Sales Channel
  • Figure 167: Middle East and Africa Market Value Share and BPS Analysis by Country, 2025 and 2035
  • Figure 168: Middle East and Africa Market Value Share and BPS Analysis by From, 2025 and 2035
  • Figure 169: Middle East and Africa Market Y-o-Y Growth Comparison by From, 2025-2035
  • Figure 170: Middle East and Africa Market Attractiveness Analysis by From
  • Figure 171: Middle East and Africa Market Value Share and BPS Analysis by Source, 2025 and 2035
  • Figure 172: Middle East and Africa Market Y-o-Y Growth Comparison by Source, 2025-2035
  • Figure 173: Middle East and Africa Market Attractiveness Analysis by Source
  • Figure 174: Middle East and Africa Market Value Share and BPS Analysis by Flavanol Concentration, 2025 and 2035
  • Figure 175: Middle East and Africa Market Y-o-Y Growth Comparison by Flavanol Concentration, 2025-2035
  • Figure 176: Middle East and Africa Market Attractiveness Analysis by Flavanol Concentration
  • Figure 177: Middle East and Africa Market Value Share and BPS Analysis by Application, 2025 and 2035
  • Figure 178: Middle East and Africa Market Y-o-Y Growth Comparison by Application, 2025-2035
  • Figure 179: Middle East and Africa Market Attractiveness Analysis by Application
  • Figure 180: Middle East and Africa Market Value Share and BPS Analysis by Health Claim, 2025 and 2035
  • Figure 181: Middle East and Africa Market Y-o-Y Growth Comparison by Health Claim, 2025-2035
  • Figure 182: Middle East and Africa Market Attractiveness Analysis by Health Claim
  • Figure 183: Middle East and Africa Market Value Share and BPS Analysis by Technology Used, 2025 and 2035
  • Figure 184: Middle East and Africa Market Y-o-Y Growth Comparison by Technology Used, 2025-2035
  • Figure 185: Middle East and Africa Market Attractiveness Analysis by Technology Used
  • Figure 186: Middle East and Africa Market Value Share and BPS Analysis by Sales Channel, 2025 and 2035
  • Figure 187: Middle East and Africa Market Y-o-Y Growth Comparison by Sales Channel, 2025-2035
  • Figure 188: Middle East and Africa Market Attractiveness Analysis by Sales Channel
  • Figure 189: Global Market - Tier Structure Analysis
  • Figure 190: Global Market - Company Share Analysis

Frequently Asked Questions

What is the projected market size for the cocoa flavanol market in 2025?

The industry is estimated to be USD 456.2 million in 2025.

What is the forecasted market value and CAGR for the cocoa flavanol market from 2025 to 2035?

The industry is projected to reach USD 643.5 million by 2035, with a CAGR of 3.5% from 2025 to 2035.

Which segment holds the largest share in the cocoa flavanol market?

The source segment, specifically cocoa powder, holds the largest share at 38% in 2025.

Which country has the highest projected growth rate for the cocoa flavanol market?

India has the highest projected CAGR at 3.3% from 2025 to 2035.

Who is the leading player in the cocoa flavanol market?

The leading player in the industry is Barry Callebaut (ACTICOA®), with a 13% industry share.

Explore Similar Insights

Future Market Insights

Cocoa Flavanol Market