Alkalized Cocoa Powder Market Size and Share Forecast Outlook 2025 to 2035

The alkalized cocoa powder market is estimated to be valued at USD 1.1 billion in 2025. It is projected to reach USD 2.0 billion by 2035, registering a compound annual growth rate (CAGR) of 6.2% over the forecast period. An absolute dollar opportunity of USD 0.90 billion is expected to be generated during this time.

Quick Stats for Alkalized Cocoa Powder Market

  • Alkalized Cocoa Powder Market Value (2025): USD 1.1 billion
  • Alkalized Cocoa Powder Market Forecast Value (2035): USD 2.0 billion
  • Alkalized Cocoa Powder Market Forecast CAGR (2025 to 2035): 6.2%
  • Leading Segment in Alkalized Cocoa Powder Market in 2025: Medium Brown Type (65% market share)
  • Key Growth Regions in Alkalized Cocoa Powder Market: North America, Europe, Asia Pacific
  • Top Key Players in Alkalized Cocoa Powder Market: Moner Cocoa S.A., Barry Callebaut AG (Bensdorp), CCBOL Group S.R.L., GCB Cocoa Singapore (Carlyle Cocoa Company), Ephoka Europe S.L., Faravari Danehaye Roghani Cocoa Tabriz Co., JB Foods Limited (JB Cocoa Sdn. Bhd.), Indcre SA, Ciranda Inc., and Olam International

Alkalized Cocoa Powder Market

Metric Value
Estimated Size (2025E) USD 1.1 billion
Projected Value (2035F) USD 2.0 billion
CAGR (2025 to 2035) 6.2%

This suggests a 1.82x growth between 2025 and 2035, driven by the rising demand for improved taste, color, and solubility in cocoa-based applications. The alkalized cocoa powder market is expected to benefit from innovations in processing techniques and product customization aligned with evolving food industry standards.

By 2030, the alkalized cocoa powder market is likely to reach approximately USD 1.38 billion, adding USD 0.38 billion in incremental value during. The remaining USD 0.62 billion is expected to be contributed between 2030 and 2035, indicating a moderately back-loaded expansion pattern. Growth momentum is likely to be reinforced by application diversification and regional penetration.

Investments are being made by major players in the alkalized cocoa powder market to enhance competitive strength through optimized alkalization processes, improved product consistency, and ethical sourcing practices. Production capacity is being expanded in key geographies, while R&D initiatives are aligned with consumer preferences for low-fat and low-acid cocoa ingredients. Industry presence is being reinforced through strategic collaborations and product portfolio diversification.

The alkalized cocoa powder market operates under two main parent markets: the cocoa powder market and the global confectionery ingredients market. It is estimated that the alkalized cocoa powder market accounts for nearly 32% of the worldwide cocoa powder market, as both alkalized and natural variants contribute to broader applications.

Within the confectionery ingredients segment, the alkalized cocoa powder market contributes about 12%, largely due to its usage in baking, chocolate fillings, frostings, and instant mixes. These percentages emphasize its strategic relevance across ingredient ecosystems and value chains that span industrial baking, foodservice, and packaged food processing.

The alkalized cocoa powder market is being shaped by rising demand for premium chocolate alternatives, functional beverages, and improved sensory profiles in baking. Innovations in low-fat, high-flavor variants are being introduced to meet clean-label and health-conscious consumer expectations.

Processing enhancements are being implemented to reduce environmental impact. Alkalized cocoa’s expanding use in cosmetics and plant-based protein shakes is also being explored. This multi-industry alignment is supporting the long-term prospects of the alkalized cocoa powder market across global food and personal care domains.
Analyzing Alkalized Cocoa Powder Market by Top Investment Segments

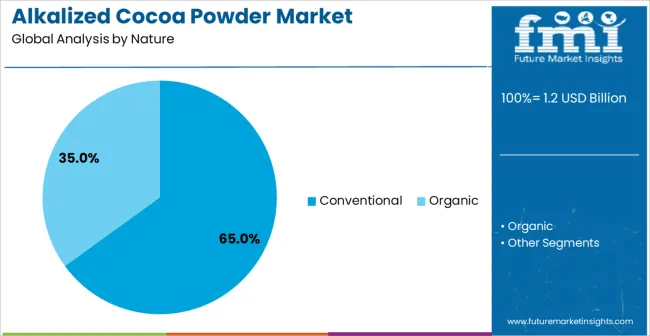
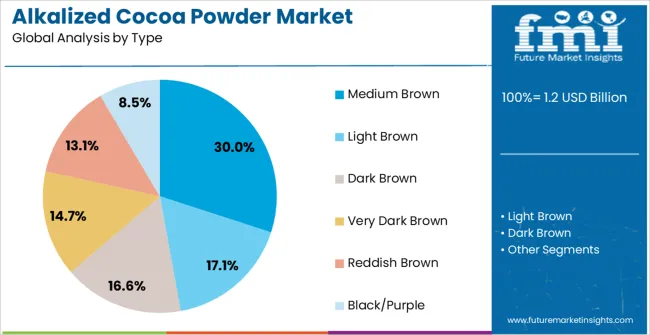
The market is segmented by nature, type, distribution channel, end-use, packaging, and region. By nature, the market is categorized into organic and conventional. Based on type, the market is divided into light brown, medium brown, dark brown, very dark brown, reddish brown, and black/purple. In terms of distribution channel, the market is characterized into direct/b2b, indirect/b2c, hypermarkets/supermarkets, specialty stores, convenience stores, and e-retail.

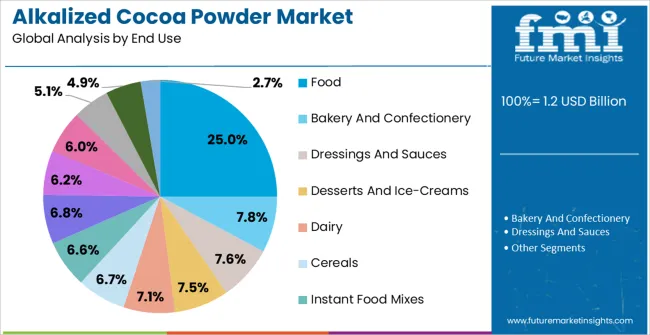
By end use, the market is classified into food, bakery and confectionery, dressings and sauces, desserts and ice-creams, dairy, cereals, instant food mixes, beverages (alcoholic, non-alcoholic), dietary supplements, pharmaceuticals, personal care and cosmetics, pet food, HoReCa/foodservice, household/retail.

By packaging, the market is divided into retail, paper bags, pouches, jars, and bulk. Regionally, the market is characterized into North America, Latin America, Europe, East Asia, South Asia & Oceania, the Middle East, & Africa.

By Type, Medium Brown Accounts for 65% of the Market Share

Alkalized Cocoa Powder Market By Type

The medium brown segment holds a commanding 65% share within the type category of the Alkalized Cocoa Powder Market. This dominance is attributed to its ideal balance of flavor, color, and pH, making it highly suitable for a wide range of food and beverage applications. Medium brown alkalized cocoa provides rich, full-bodied cocoa taste and darker visual appeal without overpowering bitterness, making it the most commercially viable choice for manufacturers.

This variant is being widely used in baking mixes, biscuits, ice creams, instant drinks, and chocolate-flavored dairy items. Its solubility and stability across processing temperatures are being favored in large-scale food production. While light and dark brown variants serve niche formulations, medium brown is being positioned as the industry standard for mass-market cocoa-based products. As manufacturers focus on product consistency and flavor delivery, the medium brown segment is expected to maintain its leadership through 2035, supported by formulation flexibility and consumer familiarity.

By Distribution Channel, Indirect B2C Accounts for 60% of the Market Share

Alkalized Cocoa Powder Market By Distribution Channel

The indirect B2C segment accounts for 60% of total distribution in the alkalized cocoa powder market and is the most lucrative channel by revenue. This segment includes supermarkets, hypermarkets, convenience stores, and online platforms, where alkalized cocoa powder is being marketed under premium, standard, and private-label brands for retail consumers. Its accessibility through multiple touchpoints has expanded consumer reach across developed and developing regions.

Shelf-stable packaging and long expiration dates have allowed the product to thrive in retail formats, while e-commerce is being leveraged to reach niche health-conscious buyers and home bakers. Promotional efforts by brands, bundled offerings, and festive packaging are also driving consumer adoption. The increasing preference for home baking and DIY chocolate beverages, especially post-pandemic, has strengthened this channel. With continued retail innovation and pricing strategies, indirect B2C is expected to remain the dominant mode of distribution, reinforcing household penetration and repeat purchase behavior.

Why is the Alkalized Cocoa Powder Market Growing?

Alkalized cocoa powder’s smooth flavor profile, reduced acidity, and enhanced dispersibility make it a preferred ingredient for food and beverage manufacturers aiming to deliver consistent taste and texture in chocolate-based products.

Rising demand for premium chocolate confectionery, flavored dairy products, and indulgent bakery goods is driving adoption, while innovations in alkalization processes are improving color intensity, solubility, and application versatility. Increasing consumer interest in cocoa-rich products, coupled with expanding use in ready-to-drink beverages, dessert mixes, and nutritional supplements, is further supporting market growth.

As clean-label and sustainably sourced cocoa gain traction, and manufacturers prioritize flavor consistency and product differentiation, the market outlook remains favorable. With strong potential in confectionery, bakery, beverages, and functional food applications, alkalized cocoa powder is set for steady global expansion.

What are the Drivers, Restraints, and Key Trends of the Alkalized Cocoa Powder Market?

In 2024, global production of alkalized cocoa powder increased by 9.6% year-on-year, with Europe accounting for nearly 40% of the total output. Key applications include bakery goods, instant cocoa drinks, confectionery fillings, and flavored dairy products. Product development has been focused on optimizing pH stability, solubility, and color intensity across different alkalization grades.

Shelf-stable formulations are now being promoted through extended-use categories such as protein powders and ready-to-drink beverages. Standardized pH ranges and color profiles have improved batch consistency, enabling broader industrial adoption. Direct consumer access through B2C platforms has also expanded, especially across Asia Pacific and North America.

Consumer Preference, Product Functionality, and Stability Drive Market Growth

Market growth is being driven by increasing consumer demand for rich chocolate flavor, smoother mouthfeel, and visual appeal in processed foods. Alkalized cocoa’s ability to deliver uniform color and taste consistency across large-scale production has positioned it as the preferred choice for food and beverage manufacturers.

Shelf stability of 18-24 months under proper storage conditions supports supply chain resilience and reduces waste. The clean-label movement has boosted demand for minimally processed and naturally derived colorants, aligning with alkalized cocoa’s profile. Adoption in vegan, plant-based, and functional food categories is accelerating as cocoa formulations are reformulated to meet modern dietary trends.

Sourcing Costs, Flavor Variation, and Processing Complexity Restrain Growth

Expansion is constrained by volatile cocoa bean prices and region-specific procurement challenges. Inconsistencies in bean fermentation and roasting introduce flavor variability, requiring stricter quality controls. Complex alkali treatment processes and equipment limitations restrict flexibility in switching between grades.

Regulatory restrictions on certain alkalizing agents across regions have narrowed formulation options. These constraints add to processing time and cost structures, particularly for exporters and large-scale food producers. Supply chain disruptions and certification requirements also extend lead times during high-volume procurement cycles.

Alkalized Cocoa Powder Market Analysis by Top Countries

Alkalized Cocoa Powder Market Country Wise Analysis

Country CAGR (2025 to 2035)
United States 5.5%
France 4.9%
United Kingdom 4.7%
Germany 4.6%
Japan 4.5%

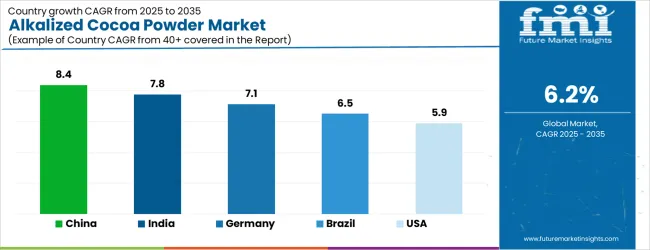
The alkalized cocoa powder market is experiencing differentiated growth across key economies from 2025 to 2035. The USA leads with a CAGR of 5.5%, supported by demand in packaged snacks and premium cocoa beverages. France and the UK follow with 4.9% and 4.7% respectively, driven by chocolate-based product innovation and clean-label adoption.

Germany posts a steady 4.6% CAGR, supported by sustainable sourcing and organic confectionery trends. Japan shows a modest 4.5% CAGR, reflecting strong interest in functional cocoa products and refined formulations. These five countries represent the dominant markets influencing global consumption patterns and product diversification.

The report covers an in-depth analysis of 40+ countries; five top-performing OECD countries are highlighted below.

Production-Driven Growth in the United States Alkalized Cocoa Powder Market

The market for alkalized cocoa powder in the USA is expected to grow at a 5.5% CAGR from 2025 to 2035, which is the highest among developed countries. Consumption is driven by strong demand from baking, instant cocoa mixes, and confectionery brands prioritizing flavor consistency and shelf-stability.

Urban centers such as Chicago, New York, and Los Angeles lead product demand, while domestic processing and imports ensure a stable supply. Powdered alkalized cocoa is preferred for its ease of blending in both industrial and home-use applications. As innovation continues in plant-based desserts and functional beverages, the USA remains the most lucrative national market in this category.

  • USD 356 million projected revenue in 2025
  • 65% of USA product volumes used in indirect B2C applications
  • 1,200+ domestic brands offer alkalized cocoa-infused food products

Application Expansion in the French Alkalized Cocoa Powder Market

The revenue from alkalized cocoa powder in France is slated to rise at a 4.9% CAGR through 2035, supported by demand in gourmet pastries, premium chocolates, and health-oriented food products. Paris and Lyon serve as innovation centers for bakery and dessert formulations using dark and medium-brown alkalized cocoa.

French chocolatiers and organic food producers are increasingly using certified cocoa ingredients to meet consumer expectations for sustainability and taste depth. Clean-label initiatives and EU-aligned cocoa sourcing policies are promoting transparency and premiumization. Local food processors are focusing on small-batch, high-quality formulations with emphasis on traceable sourcing and standardized alkalization processes.

  • EUR 144 million in retail and industrial sales projected for 2025
  • Over 52% of cocoa powder is sourced from West Africa and Latin America
  • 490+ certified chocolatiers adopted alkalized variants in 2024

Clean-Label Adoption in the United Kingdom Alkalized Cocoa Powder Market

The alkalized cocoa powder market in the UK is anticipated to grow at a 4.7% CAGR between 2025 and 2035, fueled by premium chocolate beverages, baked goods, and fortified nutrition snacks. London, Birmingham, and Manchester are primary consumption hubs. Consumer shift toward vegan and allergen-free products is accelerating the use of low-fat, alkalized cocoa in cereals, granola bars, and functional beverages.

Brexit-related shifts have increased domestic processing of imported cocoa ingredients to reduce dependence on complex EU sourcing. The rising popularity of direct-to-consumer (D2C) formats is also enabling higher-margin cocoa product offerings.

  • GBP 96 million market value projected in 2025
  • 60% of retail cocoa applications in low-sugar and plant-based products
  • Over 800 bakery and health snack brands use alkalized cocoa

Functional Ingredient Demand in the German Alkalized Cocoa Powder Market

The sales of alkalized cocoa powder in Germany are forecasted to expand at a 4.6% CAGR between 2025 and 2035, driven by demand from industrial bakeries, nutraceutical producers, and organic food manufacturers. Berlin, Hamburg, and Munich are key markets for both traditional and clean-label cocoa applications.

German manufacturers are incorporating alkalized cocoa powder into protein shakes, dark chocolate spreads, and plant-based frozen desserts. EU-compliant sourcing and transparency standards are boosting consumer confidence. Partnerships between local processors and cocoa cooperatives in West Africa are enhancing supply chain efficiency and sustainability. German R&D labs are focusing on refining flavor intensity without increasing alkali concentration.

  • EUR 170 million projected value for 2025
  • 68% of cocoa volumes go into baked goods and chocolate spreads
  • 400+ companies prioritize certified-sustainable cocoa inputs

Refined Cocoa Applications in the Japanese Alkalized Cocoa Powder Market

The demand for alkalized cocoa powder in Japan is estimated to strengthen at a 4.5% CAGR from 2025 to 2035. Tokyo, Osaka, and Nagoya lead usage in ready-to-drink cocoa beverages, nutritional supplements, and luxury chocolate products. Japan’s advanced food tech sector is utilizing alkalized cocoa for its solubility and flavor uniformity, especially in premium drinkable desserts and wellness snacks.

While imports dominate the supply chain, purification and safety protocols ensure high-quality output. Precision formulation in functional food products and beauty-related edibles is gaining momentum. Cocoa powder is also featured in limited-edition launches aligned with seasonal flavors and wellness trends.

  • JPY 21.4 billion expected market size in 2025
  • 72% of demand stems from functional and indulgent beverage applications
  • 630+ brands use alkalized cocoa in formulated health and snack items

Competitive Landscape of Alkalized Cocoa Powder Market

Alkalized Cocoa Powder Market Analysis By Company

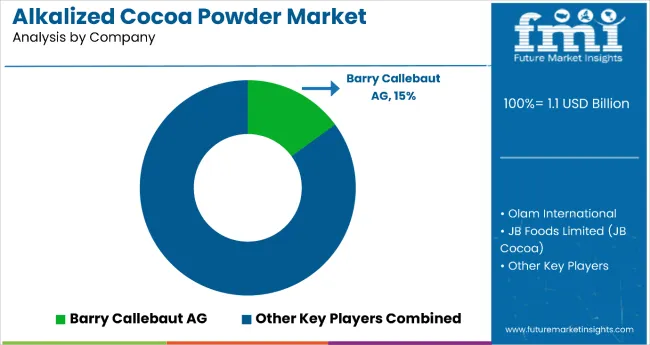
The alkalized cocoa powder market has been moderately consolidated, with global agrifood majors and regional processors shaping the competitive dynamics. Global players such as Barry Callebaut, Cargill Inc., Olam International, and ADM have been positioned as dominant forces due to their vertically integrated operations, proprietary processing technologies, and longstanding contracts with both multinational food corporations and private-label brands.

Their market leadership has been supported by sustained investment in production efficiency, flavor innovation, and tailored alkalization techniques suited for beverages, confectionery, and bakery applications. Strategic emphasis has been placed on expanding into premium, organic, and fair-trade cocoa segments to meet evolving consumer expectations in North America, Europe, and emerging Asian economies.

Meanwhile, regional players such as Jindal Cocoa, Dutch Cocoa BV, and Touton SA have been competing by offering customizable formulations, dark and lightly alkalized variants, and flexible minimum order quantities. These firms have capitalized on rising demand among artisanal chocolate makers, mid-sized bakery chains, and regional foodservice distributors.

Despite their adaptability, entry barriers have remained high for smaller competitors due to the capital-intensive nature of cocoa alkalization facilities, the need for strict quality standardization, and complex international food safety compliance. Competitive edge among these firms has increasingly been determined by consistent cocoa bean sourcing, access to certified sustainable supply chains, and the ability to develop specialty powders with uniform particle size and color tone.

Overall, the market has been influenced by operational scalability, brand partnerships, and responsiveness to clean-label and low-pH formulation demands. The global landscape continues to evolve toward hybrid competition, where both scale and specialization are being pursued simultaneously.

Scope of Report

Item Value
Quantitative Units USD 1.1 Billion
Nature Conventional, Organic
Type Light Brown, Medium Brown, Dark Brown, Very Dark Brown, Reddish Brown, Black/Purple
End-Use Food, Bakery and Confectionery, Dressings and Sauces, Desserts and Ice-creams, Dairy, Cereals, Instant Food Mixes, Beverages (Alcoholic, Non-Alcoholic), Dietary Supplements, Pharmaceuticals, Personal Care and Cosmetics, Pet Food, HoReCa/Foodservice, Household/Retail
Distribution Channel Direct/B2B, Indirect/B2C, Hypermarkets/Supermarkets, Specialty Stores, Convenience Stores, e-Retail
Packaging Retail, Paper Bags, Pouches, Jars, Bulk
Regions Covered North America, Latin America, Europe, East Asia, South Asia & Oceania, Middle East & Africa
Country Covered United States, Canada, United Kingdom, Germany, France, China, Japan, South Korea, Brazil, Australia and 40+ countries
Key Companies Profiled Moner Cocoa S.A., Barry Callebaut AG (Bensdorp), CCBOL Group S.R.L., GCB Cocoa Singapore (Carlyle Cocoa Company), Ephoka Europe S.L., Faravari Danehaye Roghani Cocoa Tabriz Co., JB Foods Limited (JB Cocoa Sdn. Bhd.), Indcre SA, Ciranda Inc., and Olam International
Additional Attributes Dollar sales by application and purity grade, regional demand trends, competitive landscape, consumer preferences for natural versus synthetic alternatives, integration with sustainable sourcing practices, innovations in extraction technology and quality standardization for diverse industrial applications

Key Segments

By Nature:

  • Organic
  • Conventional

By Type:

  • Light Brown
  • Medium Brown
  • Dark Brown
  • Very Dark Brown
  • Reddish Brown
  • Black/Purple

By End Use:

  • Food
  • Bakery and Confectionery
  • Dressings and Sauces
  • Desserts and Ice-creams
  • Dairy
  • Cereals
  • Instant Food Mixes
  • HoReCa/ Foodservice/Household/Retail
  • Beverages
    • Alcoholic
    • Non-Alcoholic
  • Dietary Supplements
  • Personal Care and Cosmetics

By Distribution Channel:

  • Direct/B2B
  • Indirect/B2C
  • Hypermarkets/Supermarkets
  • Specialty Stores
  • Convenience Stores
  • e-Retail

By Packaging:

  • Retail
  • Paper Bags
  • Pouches
  • Jars
  • Bulk

By Region:

  • North America
  • Latin America
  • Western Europe
  • Eastern Europe
  • East Asia
  • South Asia & Pacific
  • Middle East and Africa

Table of Content

  1. Executive Summary
    • Global Market Outlook
    • Demand-side Trends
    • Supply-side Trends
    • Technology Roadmap Analysis
    • Analysis and Recommendations
  2. Market Overview
    • Market Coverage / Taxonomy
    • Market Definition / Scope / Limitations
  3. Market Background
    • Market Dynamics
      • Drivers
      • Restraints
      • Opportunity
      • Trends
    • Scenario Forecast
      • Demand in Optimistic Scenario
      • Demand in Likely Scenario
      • Demand in Conservative Scenario
    • Opportunity Map Analysis
    • Product Life Cycle Analysis
    • Supply Chain Analysis
      • Supply Side Participants and their Roles
        • Producers
        • Mid-Level Participants (Traders/ Agents/ Brokers)
        • Wholesalers and Distributors
      • Value Added and Value Created at Node in the Supply Chain
      • List of Raw Material Suppliers
      • List of Existing and Potential Buyer’s
    • Investment Feasibility Matrix
    • Value Chain Analysis
      • Profit Margin Analysis
      • Wholesalers and Distributors
      • Retailers
    • PESTLE and Porter’s Analysis
    • Regulatory Landscape
      • By Key Regions
      • By Key Countries
    • Regional Parent Market Outlook
    • Production and Consumption Statistics
    • Import and Export Statistics
  4. Global Market Analysis 2020 to 2024 and Forecast, 2025 to 2035
    • Historical Market Size Value (USD Billion) & Volume (Metric Tons) Analysis, 2020 to 2024
    • Current and Future Market Size Value (USD Billion) & Volume (Metric Tons) Projections, 2025 to 2035
      • Y-o-Y Growth Trend Analysis
      • Absolute $ Opportunity Analysis
  5. Global Market Pricing Analysis 2020 to 2024 and Forecast 2025 to 2035
  6. Global Market Analysis 2020 to 2024 and Forecast 2025 to 2035, By Nature
    • Introduction / Key Findings
    • Historical Market Size Value (USD Billion) & Volume (Metric Tons) Analysis By Nature, 2020 to 2024
    • Current and Future Market Size Value (USD Billion) & Volume (Metric Tons) Analysis and Forecast By Nature, 2025 to 2035
      • Organic
      • Conventional
    • Y-o-Y Growth Trend Analysis By Nature, 2020 to 2024
    • Absolute $ Opportunity Analysis By Nature, 2025 to 2035
  7. Global Market Analysis 2020 to 2024 and Forecast 2025 to 2035, By Type
    • Introduction / Key Findings
    • Historical Market Size Value (USD Billion) & Volume (Metric Tons) Analysis By Type, 2020 to 2024
    • Current and Future Market Size Value (USD Billion) & Volume (Metric Tons) Analysis and Forecast By Type, 2025 to 2035
      • Light Brown
      • Medium Brown
      • Dark Brown
      • Very Dark Brown
      • Reddish Brown
      • Black/Purple
    • Y-o-Y Growth Trend Analysis By Type, 2020 to 2024
    • Absolute $ Opportunity Analysis By Type, 2025 to 2035
  8. Global Market Analysis 2020 to 2024 and Forecast 2025 to 2035, By End Use
    • Introduction / Key Findings
    • Historical Market Size Value (USD Billion) & Volume (Metric Tons) Analysis By End Use, 2020 to 2024
    • Current and Future Market Size Value (USD Billion) & Volume (Metric Tons) Analysis and Forecast By End Use, 2025 to 2035
      • Food
      • Bakery and Confectionery
      • Dressings and Sauces
      • Desserts and Ice-creams
      • Dairy
      • Cereals
      • Instant Food Mixes
      • HoReCa/ Foodservice/Household/Retail
      • Beverages
        • Alcoholic
        • Non-Alcoholic
      • Dietary Supplements
      • Personal Care and Cosmetics
    • Y-o-Y Growth Trend Analysis By End Use, 2020 to 2024
    • Absolute $ Opportunity Analysis By End Use, 2025 to 2035
  9. Global Market Analysis 2020 to 2024 and Forecast 2025 to 2035, By Distribution Channel
    • Introduction / Key Findings
    • Historical Market Size Value (USD Billion) & Volume (Metric Tons) Analysis By Distribution Channel, 2020 to 2024
    • Current and Future Market Size Value (USD Billion) & Volume (Metric Tons) Analysis and Forecast By Distribution Channel, 2025 to 2035
      • Direct/B2B
      • Indirect/B2C
      • Hypermarkets/Supermarkets
      • Specialty Stores
      • Convenience Stores
      • e-Retail
    • Y-o-Y Growth Trend Analysis By Distribution Channel, 2020 to 2024
    • Absolute $ Opportunity Analysis By Distribution Channel, 2025 to 2035
  10. Global Market Analysis 2020 to 2024 and Forecast 2025 to 2035, By Packaging
    • Introduction / Key Findings
    • Historical Market Size Value (USD Billion) & Volume (Metric Tons) Analysis By Packaging, 2020 to 2024
    • Current and Future Market Size Value (USD Billion) & Volume (Metric Tons) Analysis and Forecast By Packaging, 2025 to 2035
      • Retail
      • Paper Bags
      • Pouches
      • Jars
      • Bulk
    • Y-o-Y Growth Trend Analysis By Packaging, 2020 to 2024
    • Absolute $ Opportunity Analysis By Packaging, 2025 to 2035
  11. Global Market Analysis 2020 to 2024 and Forecast 2025 to 2035, By Region
    • Introduction
    • Historical Market Size Value (USD Billion) & Volume (Metric Tons) Analysis By Region, 2020 to 2024
    • Current Market Size Value (USD Billion) & Volume (Metric Tons) Analysis and Forecast By Region, 2025 to 2035
      • North America
      • Latin America
      • Western Europe
      • Eastern Europe
      • East Asia
      • South Asia & Pacific
      • Middle East and Africa
    • Market Attractiveness Analysis By Region
  12. North America Market Analysis 2020 to 2024 and Forecast 2025 to 2035, By Country
    • Historical Market Size Value (USD Billion) & Volume (Metric Tons) Trend Analysis By Market Taxonomy, 2020 to 2024
    • Market Size Value (USD Billion) & Volume (Metric Tons) Forecast By Market Taxonomy, 2025 to 2035
      • By Country
        • USA
        • Canada
        • Mexico
      • By Nature
      • By Type
      • By End Use
      • By Distribution Channel
      • By Packaging
    • Market Attractiveness Analysis
      • By Country
      • By Nature
      • By Type
      • By End Use
      • By Distribution Channel
      • By Packaging
    • Key Takeaways
  13. Latin America Market Analysis 2020 to 2024 and Forecast 2025 to 2035, By Country
    • Historical Market Size Value (USD Billion) & Volume (Metric Tons) Trend Analysis By Market Taxonomy, 2020 to 2024
    • Market Size Value (USD Billion) & Volume (Metric Tons) Forecast By Market Taxonomy, 2025 to 2035
      • By Country
        • Brazil
        • Argentina
        • Rest of LATAM
      • By Nature
      • By Type
      • By End Use
      • By Distribution Channel
      • By Packaging
    • Market Attractiveness Analysis
      • By Country
      • By Nature
      • By Type
      • By End Use
      • By Distribution Channel
      • By Packaging
    • Key Takeaways
  14. Western Europe Market Analysis 2020 to 2024 and Forecast 2025 to 2035, By Country
    • Historical Market Size Value (USD Billion) & Volume (Metric Tons) Trend Analysis By Market Taxonomy, 2020 to 2024
    • Market Size Value (USD Billion) & Volume (Metric Tons) Forecast By Market Taxonomy, 2025 to 2035
      • By Country
        • Germany
        • Italy
        • France
        • UK
        • Spain
        • BENELUX
        • Nordic
        • Rest of W.Europe
      • By Nature
      • By Type
      • By End Use
      • By Distribution Channel
      • By Packaging
    • Market Attractiveness Analysis
      • By Country
      • By Nature
      • By Type
      • By End Use
      • By Distribution Channel
      • By Packaging
    • Key Takeaways
  15. Eastern Europe Market Analysis 2020 to 2024 and Forecast 2025 to 2035, By Country
    • Historical Market Size Value (USD Billion) & Volume (Metric Tons) Trend Analysis By Market Taxonomy, 2020 to 2024
    • Market Size Value (USD Billion) & Volume (Metric Tons) Forecast By Market Taxonomy, 2025 to 2035
      • By Country
        • Russia
        • Hungary
        • Poland
        • Balkan & Baltics
        • Rest of E. Europe
      • By Nature
      • By Type
      • By End Use
      • By Distribution Channel
      • By Packaging
    • Market Attractiveness Analysis
      • By Country
      • By Nature
      • By Type
      • By End Use
      • By Distribution Channel
      • By Packaging
    • Key Takeaways
  16. East Asia Market Analysis 2020 to 2024 and Forecast 2025 to 2035, By Country
    • Historical Market Size Value (USD Billion) & Volume (Metric Tons) Trend Analysis By Market Taxonomy, 2020 to 2024
    • Market Size Value (USD Billion) & Volume (Metric Tons) Forecast By Market Taxonomy, 2025 to 2035
      • By Country
        • China
        • Japan
        • South Korea
      • By Nature
      • By Type
      • By End Use
      • By Distribution Channel
      • By Packaging
    • Market Attractiveness Analysis
      • By Country
      • By Nature
      • By Type
      • By End Use
      • By Distribution Channel
      • By Packaging
    • Key Takeaways
  17. South Asia & Pacific Market Analysis 2020 to 2024 and Forecast 2025 to 2035, By Country
    • Historical Market Size Value (USD Billion) & Volume (Metric Tons) Trend Analysis By Market Taxonomy, 2020 to 2024
    • Market Size Value (USD Billion) & Volume (Metric Tons) Forecast By Market Taxonomy, 2025 to 2035
      • By Country
        • India
        • Australia & New Zealand
        • ASEAN
        • Rest of SAP
      • By Nature
      • By Type
      • By End Use
      • By Distribution Channel
      • By Packaging
    • Market Attractiveness Analysis
      • By Country
      • By Nature
      • By Type
      • By End Use
      • By Distribution Channel
      • By Packaging
    • Key Takeaways
  18. Middle East and Africa Market Analysis 2020 to 2024 and Forecast 2025 to 2035, By Country
    • Historical Market Size Value (USD Billion) & Volume (Metric Tons) Trend Analysis By Market Taxonomy, 2020 to 2024
    • Market Size Value (USD Billion) & Volume (Metric Tons) Forecast By Market Taxonomy, 2025 to 2035
      • By Country
        • GCC Countries
        • Northern Africa
        • South Africa
        • Turkiye
        • Rest of MEA
      • By Nature
      • By Type
      • By End Use
      • By Distribution Channel
      • By Packaging
    • Market Attractiveness Analysis
      • By Country
      • By Nature
      • By Type
      • By End Use
      • By Distribution Channel
      • By Packaging
    • Key Takeaways
  19. Key Countries Market Analysis
    • USA
      • Pricing Analysis
      • Market Share Analysis, 2024
        • By Nature
        • By Type
        • By End Use
        • By Distribution Channel
        • By Packaging
    • Canada
      • Pricing Analysis
      • Market Share Analysis, 2024
        • By Nature
        • By Type
        • By End Use
        • By Distribution Channel
        • By Packaging
    • Brazil
      • Pricing Analysis
      • Market Share Analysis, 2024
        • By Nature
        • By Type
        • By End Use
        • By Distribution Channel
        • By Packaging
    • Mexico
      • Pricing Analysis
      • Market Share Analysis, 2024
        • By Nature
        • By Type
        • By End Use
        • By Distribution Channel
        • By Packaging
    • Argentina
      • Pricing Analysis
      • Market Share Analysis, 2024
        • By Nature
        • By Type
        • By End Use
        • By Distribution Channel
        • By Packaging
  20. Market Structure Analysis
    • Competition Dashboard
    • Competition Benchmarking
    • Market Share Analysis of Top Players
      • By Regional
      • By Nature
      • By Type
      • By End Use
      • By Distribution Channel
      • By Packaging
  21. Competition Analysis
    • Competition Deep Dive
      • Moner Cocoa, S.A.
        • Overview
        • Product Portfolio
        • Profitability by Market Segments (Product/Age /Sales Channel/Region)
        • Sales Footprint
        • Strategy Overview
          • Marketing Strategy
          • Product Strategy
          • Channel Strategy
      • Barry Callebaut AG (Bensdorp)
        • Overview
        • Product Portfolio
        • Profitability by Market Segments (Product/Age /Sales Channel/Region)
        • Sales Footprint
        • Strategy Overview
          • Marketing Strategy
          • Product Strategy
          • Channel Strategy
      • CCBOL Group S.R.L.
        • Overview
        • Product Portfolio
        • Profitability by Market Segments (Product/Age /Sales Channel/Region)
        • Sales Footprint
        • Strategy Overview
          • Marketing Strategy
          • Product Strategy
          • Channel Strategy
      • GCB Cocoa Singapore (Carlyle Cocoa Company)
        • Overview
        • Product Portfolio
        • Profitability by Market Segments (Product/Age /Sales Channel/Region)
        • Sales Footprint
        • Strategy Overview
          • Marketing Strategy
          • Product Strategy
          • Channel Strategy
      • Ephoka Europe S.L.
        • Overview
        • Product Portfolio
        • Profitability by Market Segments (Product/Age /Sales Channel/Region)
        • Sales Footprint
        • Strategy Overview
          • Marketing Strategy
          • Product Strategy
          • Channel Strategy
      • Faravari Danehaye Roghani Cocoa Tabriz Co.
        • Overview
        • Product Portfolio
        • Profitability by Market Segments (Product/Age /Sales Channel/Region)
        • Sales Footprint
        • Strategy Overview
          • Marketing Strategy
          • Product Strategy
          • Channel Strategy
      • JB Foods Limited (JB Cocoa Sdn. Bhd.)
        • Overview
        • Product Portfolio
        • Profitability by Market Segments (Product/Age /Sales Channel/Region)
        • Sales Footprint
        • Strategy Overview
          • Marketing Strategy
          • Product Strategy
          • Channel Strategy
      • Indcre SA
        • Overview
        • Product Portfolio
        • Profitability by Market Segments (Product/Age /Sales Channel/Region)
        • Sales Footprint
        • Strategy Overview
          • Marketing Strategy
          • Product Strategy
          • Channel Strategy
      • Ciranda, Inc.
        • Overview
        • Product Portfolio
        • Profitability by Market Segments (Product/Age /Sales Channel/Region)
        • Sales Footprint
        • Strategy Overview
          • Marketing Strategy
          • Product Strategy
          • Channel Strategy
      • Olam International
        • Overview
        • Product Portfolio
        • Profitability by Market Segments (Product/Age /Sales Channel/Region)
        • Sales Footprint
        • Strategy Overview
          • Marketing Strategy
          • Product Strategy
          • Channel Strategy
  22. Assumptions & Acronyms Used
  23. Research Methodology

List of Tables

  • Table 1: Global Market Value (USD Billion) Forecast by Region, 2020-2035
  • Table 2: Global Market Volume (Metric Tons) Forecast by Region, 2020-2035
  • Table 3: Global Market Value (USD Billion) Forecast by Nature, 2020-2035
  • Table 4: Global Market Volume (Metric Tons) Forecast by Nature, 2020-2035
  • Table 5: Global Market Value (USD Billion) Forecast by Type, 2020-2035
  • Table 6: Global Market Volume (Metric Tons) Forecast by Type, 2020-2035
  • Table 7: Global Market Value (USD Billion) Forecast by End Use, 2020-2035
  • Table 8: Global Market Volume (Metric Tons) Forecast by End Use, 2020-2035
  • Table 9: Global Market Value (USD Billion) Forecast by Distribution Channel, 2020-2035
  • Table 10: Global Market Volume (Metric Tons) Forecast by Distribution Channel, 2020-2035
  • Table 11: Global Market Value (USD Billion) Forecast by Packaging, 2020-2035
  • Table 12: Global Market Volume (Metric Tons) Forecast by Packaging, 2020-2035
  • Table 13: North America Market Value (USD Billion) Forecast by Country, 2020-2035
  • Table 14: North America Market Volume (Metric Tons) Forecast by Country, 2020-2035
  • Table 15: North America Market Value (USD Billion) Forecast by Nature, 2020-2035
  • Table 16: North America Market Volume (Metric Tons) Forecast by Nature, 2020-2035
  • Table 17: North America Market Value (USD Billion) Forecast by Type, 2020-2035
  • Table 18: North America Market Volume (Metric Tons) Forecast by Type, 2020-2035
  • Table 19: North America Market Value (USD Billion) Forecast by End Use, 2020-2035
  • Table 20: North America Market Volume (Metric Tons) Forecast by End Use, 2020-2035
  • Table 21: North America Market Value (USD Billion) Forecast by Distribution Channel, 2020-2035
  • Table 22: North America Market Volume (Metric Tons) Forecast by Distribution Channel, 2020-2035
  • Table 23: North America Market Value (USD Billion) Forecast by Packaging, 2020-2035
  • Table 24: North America Market Volume (Metric Tons) Forecast by Packaging, 2020-2035
  • Table 25: Latin America Market Value (USD Billion) Forecast by Country, 2020-2035
  • Table 26: Latin America Market Volume (Metric Tons) Forecast by Country, 2020-2035
  • Table 27: Latin America Market Value (USD Billion) Forecast by Nature, 2020-2035
  • Table 28: Latin America Market Volume (Metric Tons) Forecast by Nature, 2020-2035
  • Table 29: Latin America Market Value (USD Billion) Forecast by Type, 2020-2035
  • Table 30: Latin America Market Volume (Metric Tons) Forecast by Type, 2020-2035
  • Table 31: Latin America Market Value (USD Billion) Forecast by End Use, 2020-2035
  • Table 32: Latin America Market Volume (Metric Tons) Forecast by End Use, 2020-2035
  • Table 33: Latin America Market Value (USD Billion) Forecast by Distribution Channel, 2020-2035
  • Table 34: Latin America Market Volume (Metric Tons) Forecast by Distribution Channel, 2020-2035
  • Table 35: Latin America Market Value (USD Billion) Forecast by Packaging, 2020-2035
  • Table 36: Latin America Market Volume (Metric Tons) Forecast by Packaging, 2020-2035
  • Table 37: Western Europe Market Value (USD Billion) Forecast by Country, 2020-2035
  • Table 38: Western Europe Market Volume (Metric Tons) Forecast by Country, 2020-2035
  • Table 39: Western Europe Market Value (USD Billion) Forecast by Nature, 2020-2035
  • Table 40: Western Europe Market Volume (Metric Tons) Forecast by Nature, 2020-2035
  • Table 41: Western Europe Market Value (USD Billion) Forecast by Type, 2020-2035
  • Table 42: Western Europe Market Volume (Metric Tons) Forecast by Type, 2020-2035
  • Table 43: Western Europe Market Value (USD Billion) Forecast by End Use, 2020-2035
  • Table 44: Western Europe Market Volume (Metric Tons) Forecast by End Use, 2020-2035
  • Table 45: Western Europe Market Value (USD Billion) Forecast by Distribution Channel, 2020-2035
  • Table 46: Western Europe Market Volume (Metric Tons) Forecast by Distribution Channel, 2020-2035
  • Table 47: Western Europe Market Value (USD Billion) Forecast by Packaging, 2020-2035
  • Table 48: Western Europe Market Volume (Metric Tons) Forecast by Packaging, 2020-2035
  • Table 49: Eastern Europe Market Value (USD Billion) Forecast by Country, 2020-2035
  • Table 50: Eastern Europe Market Volume (Metric Tons) Forecast by Country, 2020-2035
  • Table 51: Eastern Europe Market Value (USD Billion) Forecast by Nature, 2020-2035
  • Table 52: Eastern Europe Market Volume (Metric Tons) Forecast by Nature, 2020-2035
  • Table 53: Eastern Europe Market Value (USD Billion) Forecast by Type, 2020-2035
  • Table 54: Eastern Europe Market Volume (Metric Tons) Forecast by Type, 2020-2035
  • Table 55: Eastern Europe Market Value (USD Billion) Forecast by End Use, 2020-2035
  • Table 56: Eastern Europe Market Volume (Metric Tons) Forecast by End Use, 2020-2035
  • Table 57: Eastern Europe Market Value (USD Billion) Forecast by Distribution Channel, 2020-2035
  • Table 58: Eastern Europe Market Volume (Metric Tons) Forecast by Distribution Channel, 2020-2035
  • Table 59: Eastern Europe Market Value (USD Billion) Forecast by Packaging, 2020-2035
  • Table 60: Eastern Europe Market Volume (Metric Tons) Forecast by Packaging, 2020-2035
  • Table 61: East Asia Market Value (USD Billion) Forecast by Country, 2020-2035
  • Table 62: East Asia Market Volume (Metric Tons) Forecast by Country, 2020-2035
  • Table 63: East Asia Market Value (USD Billion) Forecast by Nature, 2020-2035
  • Table 64: East Asia Market Volume (Metric Tons) Forecast by Nature, 2020-2035
  • Table 65: East Asia Market Value (USD Billion) Forecast by Type, 2020-2035
  • Table 66: East Asia Market Volume (Metric Tons) Forecast by Type, 2020-2035
  • Table 67: East Asia Market Value (USD Billion) Forecast by End Use, 2020-2035
  • Table 68: East Asia Market Volume (Metric Tons) Forecast by End Use, 2020-2035
  • Table 69: East Asia Market Value (USD Billion) Forecast by Distribution Channel, 2020-2035
  • Table 70: East Asia Market Volume (Metric Tons) Forecast by Distribution Channel, 2020-2035
  • Table 71: East Asia Market Value (USD Billion) Forecast by Packaging, 2020-2035
  • Table 72: East Asia Market Volume (Metric Tons) Forecast by Packaging, 2020-2035
  • Table 73: South Asia & Pacific Market Value (USD Billion) Forecast by Country, 2020-2035
  • Table 74: South Asia & Pacific Market Volume (Metric Tons) Forecast by Country, 2020-2035
  • Table 75: South Asia & Pacific Market Value (USD Billion) Forecast by Nature, 2020-2035
  • Table 76: South Asia & Pacific Market Volume (Metric Tons) Forecast by Nature, 2020-2035
  • Table 77: South Asia & Pacific Market Value (USD Billion) Forecast by Type, 2020-2035
  • Table 78: South Asia & Pacific Market Volume (Metric Tons) Forecast by Type, 2020-2035
  • Table 79: South Asia & Pacific Market Value (USD Billion) Forecast by End Use, 2020-2035
  • Table 80: South Asia & Pacific Market Volume (Metric Tons) Forecast by End Use, 2020-2035
  • Table 81: South Asia & Pacific Market Value (USD Billion) Forecast by Distribution Channel, 2020-2035
  • Table 82: South Asia & Pacific Market Volume (Metric Tons) Forecast by Distribution Channel, 2020-2035
  • Table 83: South Asia & Pacific Market Value (USD Billion) Forecast by Packaging, 2020-2035
  • Table 84: South Asia & Pacific Market Volume (Metric Tons) Forecast by Packaging, 2020-2035
  • Table 85: Middle East and Africa Market Value (USD Billion) Forecast by Country, 2020-2035
  • Table 86: Middle East and Africa Market Volume (Metric Tons) Forecast by Country, 2020-2035
  • Table 87: Middle East and Africa Market Value (USD Billion) Forecast by Nature, 2020-2035
  • Table 88: Middle East and Africa Market Volume (Metric Tons) Forecast by Nature, 2020-2035
  • Table 89: Middle East and Africa Market Value (USD Billion) Forecast by Type, 2020-2035
  • Table 90: Middle East and Africa Market Volume (Metric Tons) Forecast by Type, 2020-2035
  • Table 91: Middle East and Africa Market Value (USD Billion) Forecast by End Use, 2020-2035
  • Table 92: Middle East and Africa Market Volume (Metric Tons) Forecast by End Use, 2020-2035
  • Table 93: Middle East and Africa Market Value (USD Billion) Forecast by Distribution Channel, 2020-2035
  • Table 94: Middle East and Africa Market Volume (Metric Tons) Forecast by Distribution Channel, 2020-2035
  • Table 95: Middle East and Africa Market Value (USD Billion) Forecast by Packaging, 2020-2035
  • Table 96: Middle East and Africa Market Volume (Metric Tons) Forecast by Packaging, 2020-2035

List of Figures

  • Figure 1: Global Market Volume (Metric Tons) Forecast 2020-2035
  • Figure 2: Global Market Pricing Analysis
  • Figure 3: Global Market Value (USD Billion) Forecast 2020-2035
  • Figure 4: Global Market Value Share and BPS Analysis by Nature, 2025 and 2035
  • Figure 5: Global Market Y-o-Y Growth Comparison by Nature, 2025-2035
  • Figure 6: Global Market Attractiveness Analysis by Nature
  • Figure 7: Global Market Value Share and BPS Analysis by Type, 2025 and 2035
  • Figure 8: Global Market Y-o-Y Growth Comparison by Type, 2025-2035
  • Figure 9: Global Market Attractiveness Analysis by Type
  • Figure 10: Global Market Value Share and BPS Analysis by End Use, 2025 and 2035
  • Figure 11: Global Market Y-o-Y Growth Comparison by End Use, 2025-2035
  • Figure 12: Global Market Attractiveness Analysis by End Use
  • Figure 13: Global Market Value Share and BPS Analysis by Distribution Channel, 2025 and 2035
  • Figure 14: Global Market Y-o-Y Growth Comparison by Distribution Channel, 2025-2035
  • Figure 15: Global Market Attractiveness Analysis by Distribution Channel
  • Figure 16: Global Market Value Share and BPS Analysis by Packaging, 2025 and 2035
  • Figure 17: Global Market Y-o-Y Growth Comparison by Packaging, 2025-2035
  • Figure 18: Global Market Attractiveness Analysis by Packaging
  • Figure 19: Global Market Value (USD Billion) Share and BPS Analysis by Region, 2025 and 2035
  • Figure 20: Global Market Y-o-Y Growth Comparison by Region, 2025-2035
  • Figure 21: Global Market Attractiveness Analysis by Region
  • Figure 22: North America Market Incremental $ Opportunity, 2025-2035
  • Figure 23: Latin America Market Incremental $ Opportunity, 2025-2035
  • Figure 24: Western Europe Market Incremental $ Opportunity, 2025-2035
  • Figure 25: Eastern Europe Market Incremental $ Opportunity, 2025-2035
  • Figure 26: East Asia Market Incremental $ Opportunity, 2025-2035
  • Figure 27: South Asia & Pacific Market Incremental $ Opportunity, 2025-2035
  • Figure 28: Middle East and Africa Market Incremental $ Opportunity, 2025-2035
  • Figure 29: North America Market Value Share and BPS Analysis by Country, 2025 and 2035
  • Figure 30: North America Market Value Share and BPS Analysis by Nature, 2025 and 2035
  • Figure 31: North America Market Y-o-Y Growth Comparison by Nature, 2025-2035
  • Figure 32: North America Market Attractiveness Analysis by Nature
  • Figure 33: North America Market Value Share and BPS Analysis by Type, 2025 and 2035
  • Figure 34: North America Market Y-o-Y Growth Comparison by Type, 2025-2035
  • Figure 35: North America Market Attractiveness Analysis by Type
  • Figure 36: North America Market Value Share and BPS Analysis by End Use, 2025 and 2035
  • Figure 37: North America Market Y-o-Y Growth Comparison by End Use, 2025-2035
  • Figure 38: North America Market Attractiveness Analysis by End Use
  • Figure 39: North America Market Value Share and BPS Analysis by Distribution Channel, 2025 and 2035
  • Figure 40: North America Market Y-o-Y Growth Comparison by Distribution Channel, 2025-2035
  • Figure 41: North America Market Attractiveness Analysis by Distribution Channel
  • Figure 42: North America Market Value Share and BPS Analysis by Packaging, 2025 and 2035
  • Figure 43: North America Market Y-o-Y Growth Comparison by Packaging, 2025-2035
  • Figure 44: North America Market Attractiveness Analysis by Packaging
  • Figure 45: Latin America Market Value Share and BPS Analysis by Country, 2025 and 2035
  • Figure 46: Latin America Market Value Share and BPS Analysis by Nature, 2025 and 2035
  • Figure 47: Latin America Market Y-o-Y Growth Comparison by Nature, 2025-2035
  • Figure 48: Latin America Market Attractiveness Analysis by Nature
  • Figure 49: Latin America Market Value Share and BPS Analysis by Type, 2025 and 2035
  • Figure 50: Latin America Market Y-o-Y Growth Comparison by Type, 2025-2035
  • Figure 51: Latin America Market Attractiveness Analysis by Type
  • Figure 52: Latin America Market Value Share and BPS Analysis by End Use, 2025 and 2035
  • Figure 53: Latin America Market Y-o-Y Growth Comparison by End Use, 2025-2035
  • Figure 54: Latin America Market Attractiveness Analysis by End Use
  • Figure 55: Latin America Market Value Share and BPS Analysis by Distribution Channel, 2025 and 2035
  • Figure 56: Latin America Market Y-o-Y Growth Comparison by Distribution Channel, 2025-2035
  • Figure 57: Latin America Market Attractiveness Analysis by Distribution Channel
  • Figure 58: Latin America Market Value Share and BPS Analysis by Packaging, 2025 and 2035
  • Figure 59: Latin America Market Y-o-Y Growth Comparison by Packaging, 2025-2035
  • Figure 60: Latin America Market Attractiveness Analysis by Packaging
  • Figure 61: Western Europe Market Value Share and BPS Analysis by Country, 2025 and 2035
  • Figure 62: Western Europe Market Value Share and BPS Analysis by Nature, 2025 and 2035
  • Figure 63: Western Europe Market Y-o-Y Growth Comparison by Nature, 2025-2035
  • Figure 64: Western Europe Market Attractiveness Analysis by Nature
  • Figure 65: Western Europe Market Value Share and BPS Analysis by Type, 2025 and 2035
  • Figure 66: Western Europe Market Y-o-Y Growth Comparison by Type, 2025-2035
  • Figure 67: Western Europe Market Attractiveness Analysis by Type
  • Figure 68: Western Europe Market Value Share and BPS Analysis by End Use, 2025 and 2035
  • Figure 69: Western Europe Market Y-o-Y Growth Comparison by End Use, 2025-2035
  • Figure 70: Western Europe Market Attractiveness Analysis by End Use
  • Figure 71: Western Europe Market Value Share and BPS Analysis by Distribution Channel, 2025 and 2035
  • Figure 72: Western Europe Market Y-o-Y Growth Comparison by Distribution Channel, 2025-2035
  • Figure 73: Western Europe Market Attractiveness Analysis by Distribution Channel
  • Figure 74: Western Europe Market Value Share and BPS Analysis by Packaging, 2025 and 2035
  • Figure 75: Western Europe Market Y-o-Y Growth Comparison by Packaging, 2025-2035
  • Figure 76: Western Europe Market Attractiveness Analysis by Packaging
  • Figure 77: Eastern Europe Market Value Share and BPS Analysis by Country, 2025 and 2035
  • Figure 78: Eastern Europe Market Value Share and BPS Analysis by Nature, 2025 and 2035
  • Figure 79: Eastern Europe Market Y-o-Y Growth Comparison by Nature, 2025-2035
  • Figure 80: Eastern Europe Market Attractiveness Analysis by Nature
  • Figure 81: Eastern Europe Market Value Share and BPS Analysis by Type, 2025 and 2035
  • Figure 82: Eastern Europe Market Y-o-Y Growth Comparison by Type, 2025-2035
  • Figure 83: Eastern Europe Market Attractiveness Analysis by Type
  • Figure 84: Eastern Europe Market Value Share and BPS Analysis by End Use, 2025 and 2035
  • Figure 85: Eastern Europe Market Y-o-Y Growth Comparison by End Use, 2025-2035
  • Figure 86: Eastern Europe Market Attractiveness Analysis by End Use
  • Figure 87: Eastern Europe Market Value Share and BPS Analysis by Distribution Channel, 2025 and 2035
  • Figure 88: Eastern Europe Market Y-o-Y Growth Comparison by Distribution Channel, 2025-2035
  • Figure 89: Eastern Europe Market Attractiveness Analysis by Distribution Channel
  • Figure 90: Eastern Europe Market Value Share and BPS Analysis by Packaging, 2025 and 2035
  • Figure 91: Eastern Europe Market Y-o-Y Growth Comparison by Packaging, 2025-2035
  • Figure 92: Eastern Europe Market Attractiveness Analysis by Packaging
  • Figure 93: East Asia Market Value Share and BPS Analysis by Country, 2025 and 2035
  • Figure 94: East Asia Market Value Share and BPS Analysis by Nature, 2025 and 2035
  • Figure 95: East Asia Market Y-o-Y Growth Comparison by Nature, 2025-2035
  • Figure 96: East Asia Market Attractiveness Analysis by Nature
  • Figure 97: East Asia Market Value Share and BPS Analysis by Type, 2025 and 2035
  • Figure 98: East Asia Market Y-o-Y Growth Comparison by Type, 2025-2035
  • Figure 99: East Asia Market Attractiveness Analysis by Type
  • Figure 100: East Asia Market Value Share and BPS Analysis by End Use, 2025 and 2035
  • Figure 101: East Asia Market Y-o-Y Growth Comparison by End Use, 2025-2035
  • Figure 102: East Asia Market Attractiveness Analysis by End Use
  • Figure 103: East Asia Market Value Share and BPS Analysis by Distribution Channel, 2025 and 2035
  • Figure 104: East Asia Market Y-o-Y Growth Comparison by Distribution Channel, 2025-2035
  • Figure 105: East Asia Market Attractiveness Analysis by Distribution Channel
  • Figure 106: East Asia Market Value Share and BPS Analysis by Packaging, 2025 and 2035
  • Figure 107: East Asia Market Y-o-Y Growth Comparison by Packaging, 2025-2035
  • Figure 108: East Asia Market Attractiveness Analysis by Packaging
  • Figure 109: South Asia & Pacific Market Value Share and BPS Analysis by Country, 2025 and 2035
  • Figure 110: South Asia & Pacific Market Value Share and BPS Analysis by Nature, 2025 and 2035
  • Figure 111: South Asia & Pacific Market Y-o-Y Growth Comparison by Nature, 2025-2035
  • Figure 112: South Asia & Pacific Market Attractiveness Analysis by Nature
  • Figure 113: South Asia & Pacific Market Value Share and BPS Analysis by Type, 2025 and 2035
  • Figure 114: South Asia & Pacific Market Y-o-Y Growth Comparison by Type, 2025-2035
  • Figure 115: South Asia & Pacific Market Attractiveness Analysis by Type
  • Figure 116: South Asia & Pacific Market Value Share and BPS Analysis by End Use, 2025 and 2035
  • Figure 117: South Asia & Pacific Market Y-o-Y Growth Comparison by End Use, 2025-2035
  • Figure 118: South Asia & Pacific Market Attractiveness Analysis by End Use
  • Figure 119: South Asia & Pacific Market Value Share and BPS Analysis by Distribution Channel, 2025 and 2035
  • Figure 120: South Asia & Pacific Market Y-o-Y Growth Comparison by Distribution Channel, 2025-2035
  • Figure 121: South Asia & Pacific Market Attractiveness Analysis by Distribution Channel
  • Figure 122: South Asia & Pacific Market Value Share and BPS Analysis by Packaging, 2025 and 2035
  • Figure 123: South Asia & Pacific Market Y-o-Y Growth Comparison by Packaging, 2025-2035
  • Figure 124: South Asia & Pacific Market Attractiveness Analysis by Packaging
  • Figure 125: Middle East and Africa Market Value Share and BPS Analysis by Country, 2025 and 2035
  • Figure 126: Middle East and Africa Market Value Share and BPS Analysis by Nature, 2025 and 2035
  • Figure 127: Middle East and Africa Market Y-o-Y Growth Comparison by Nature, 2025-2035
  • Figure 128: Middle East and Africa Market Attractiveness Analysis by Nature
  • Figure 129: Middle East and Africa Market Value Share and BPS Analysis by Type, 2025 and 2035
  • Figure 130: Middle East and Africa Market Y-o-Y Growth Comparison by Type, 2025-2035
  • Figure 131: Middle East and Africa Market Attractiveness Analysis by Type
  • Figure 132: Middle East and Africa Market Value Share and BPS Analysis by End Use, 2025 and 2035
  • Figure 133: Middle East and Africa Market Y-o-Y Growth Comparison by End Use, 2025-2035
  • Figure 134: Middle East and Africa Market Attractiveness Analysis by End Use
  • Figure 135: Middle East and Africa Market Value Share and BPS Analysis by Distribution Channel, 2025 and 2035
  • Figure 136: Middle East and Africa Market Y-o-Y Growth Comparison by Distribution Channel, 2025-2035
  • Figure 137: Middle East and Africa Market Attractiveness Analysis by Distribution Channel
  • Figure 138: Middle East and Africa Market Value Share and BPS Analysis by Packaging, 2025 and 2035
  • Figure 139: Middle East and Africa Market Y-o-Y Growth Comparison by Packaging, 2025-2035
  • Figure 140: Middle East and Africa Market Attractiveness Analysis by Packaging
  • Figure 141: Global Market - Tier Structure Analysis
  • Figure 142: Global Market - Company Share Analysis

Frequently Asked Questions

How big is the alkalized cocoa powder market in 2025?

The global alkalized cocoa powder market is estimated to be valued at USD 1.1 billion in 2025.

What will be the size of alkalized cocoa powder market in 2035?

The market size for the alkalized cocoa powder market is projected to reach USD 2.0 billion by 2035.

How much will be the alkalized cocoa powder market growth between 2025 and 2035?

The alkalized cocoa powder market is expected to grow at a 6.2% CAGR between 2025 and 2035.

Which type segment is projected to lead in the alkalized cocoa powder market in 2025?

The medium brown type segment is projected to lead in the alkalized cocoa powder market with 65% market share in 2025.

Which distribution channel is expected to contribute significant share in the alkalized cocoa powder market in 2025?

In terms of distribution channel, the indirect B2C segment is expected to command 60% share in the alkalized cocoa powder market in 2025.

Explore Similar Insights

Future Market Insights

Alkalized Cocoa Powder Market