Reports

- Global Locations -

Headquarters

Future Market Insights, Inc.

Christiana Corporate, 200
Continental Drive, Suite 401,
Newark, Delaware - 19713,
United States

T: +1-845-579-5705

Americas

Future Market Insights, Inc.

616 Corporate Way, Suite 2-9018,
Valley Cottage, NY 10989, United States

T: +1-347-918-3531

MEA

Future Market Insights

1602-6 Jumeirah Bay X2 Tower, Plot No: JLT-PH2-X2A,
Jumeirah Lakes Towers, Dubai,
United Arab Emirates

Europe

Future Market Insights

3rd Floor, 207 Regent Street,
W1B 3HH London
United Kingdom

T: + 44 (0) 20 8123 9659
D: +44 (0) 20 3287 4268

Asia Pacific

Future Market Insights

IndiaLand Global Tech Park, Unit UG-1, Behind Grand HighStreet, Phase 1, Hinjawadi, MH, Pune – 411057, India

Cocoa Based Polyphenols Market Outlook (2022 to 2032)

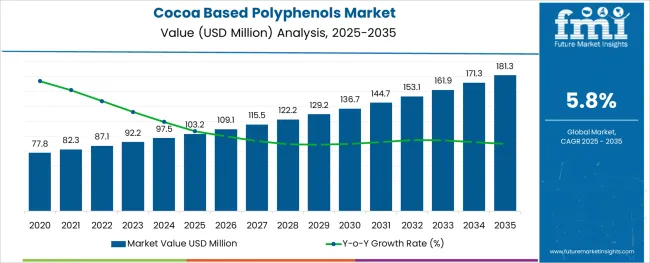
The global cocoa-based polyphenols market is estimated to be worth around US$ 87.1 Million by the year 2022, accelerating with a CAGR of 5.8% by 2022 to 2032. The cocoa-based polyphenols market size is estimated to reach a valuation of about US$ 153.2 Million by 2032 end.

Numerous health advantages relating to the prevention of cardiac illnesses, cancer, diabetes, and many more provided by polyphenol items have rendered cocoa-based polyphenols a lucrative commodity for business.

Attributes Value
Cocoa-Based Polyphenols Market Share (2022) US$ 87.1 Million
Cocoa-Based Polyphenols Market Projected Size (2032) US$ 153.2 Million
Cocoa-Based Polyphenols Market Growth (CAGR 2022 to 2032) 5.8%

It is projected that the nutritious food sector would see the most demand for cocoa-based polyphenols all across the economies. Improving public knowledge of the advantages of organic polyphenols for health is anticipated to support the cocoa-based polyphenols market growth and expansion in the coming days.

Polyphenols have a significant prebiotic impact; they raise the proportion of healthy intestinal bacteria, which is critical for maintaining general well-being, controlling obesity, and preventing infections. To attract customers, these drinks usually make a big deal about the immune-boosting abilities of components like cocoa-based polyphenols. Such factors have increased sales of cocoa-based polyphenol meals and drinks that help to popularize the product in the food & beverages market.

Due to its high polyphenol content, recent advancements in the market have demonstrated the advantages of cocoa in nutritional products. Growing emphasis on marketing the product across local markets has given a ride to new emerging trends in the cocoa-based polyphenols market by the local players.

Consuming beverages with cocoa-based polyphenols improve insulin sensitivity and lowers blood pressure in consumers. This, in turn, has fuelled the recent increase in sales of cocoa-based polyphenols that can be used in dietary supplements and culinary products.

Don't pay for what you don't need

Customize your report by selecting specific countries or regions and save 30%!

Historical Comparison of the Cocoa Based Polyphenols Market Values during 2017 to 2021

Over the last few decades, according to the global market study report on cocoa-based polyphenol products, the market continued at a very slow pace until 2019. Unawareness about the benefits of the product and unfamiliarity with its uses had limited the cocoa-based polyphenol market growth only within traditional cocoa production regions.

However, the demand for cocoa-based polyphenols increased during the pandemic as people's immunity and general well-being came under increasing scrutiny. The global cocoa-based polyphenols market share is poised to experience an upward trajectory in the coming days, thanks to ongoing Research and Development helping companies win over customers.

What is the Future of Global Cocoa Based Polyphenols Market? 

The cocoa-based polyphenols market future trends are anticipated to be driven by growing people's busy lives and growing awareness of the health advantages of these nutrient-rich foods. Recent revelations by the medical community researchers about the anti-cancer properties of the product are anticipated to boost the global cocoa-based polyphenols market in the medical sector as well.

Through the use of this product, geriatric neurodegenerative diseases can also be avoided. So the growing proportion of the aged population in all major economies has ushered in a very favorable ground for the growth of cocoa-based polyphenols market key trends and opportunities in recent years.

Nikhil Kaitwade
Nikhil Kaitwade

Principal Consultant

Talk to Analyst

Find your sweet spots for generating winning opportunities in this market.

What are the Existing Challenges for the Cocoa Based Polyphenols Market future Trends?

The retail costs of functional food items are typically 30% higher than those of traditional food goods. This has restrained the sales of cocoa-based polyphenols in a lot of regions of the world. Moreover, the price of cocoa-based polyphenols, like all other products, varies depending on the availability of the raw materials used, making the market highly subject to local suppliers.

The functional food items have been positively controlled by a number of governmental authorities in various areas, creating potential hindrances to their manufacturing and distribution. Progressive regulatory systems for the approval and marketing of cocoa-based polyphenols products exist in several countries. At the same time, many other economies are currently drafting similar laws that could pose a challenge to cocoa-based polyphenols market growth to some degree.

Comparative View of Adjacent Cocoa Based Polyphenols Market

Cocoa-Based Polyphenols Market:

Attributes Cocoa-Based Polyphenols Market
CAGR (2022 to 2032) 5.8%
Market Value (2022) US$ 87.1 Million
Growth Factor Rising awareness among general people about the health benefits of the product.
Future Opportunities Adoption of polyphenols by food & beverages industries to boost the market in coming days.
Market Trends The emergence of new market players for the marketing of organic polyphenols against the traditional ones.

Tea-Based Polyphenols Market:

Attributes Tea-Based Polyphenols Market
CAGR (2022 to 2032) 8%
Market Value (2022) US$ 400 Million
Growth Factor Rapidly growing trend of functional foods for their health benefits and appeal.
Future Opportunities The growing popularity of tea among the young generation against cocoa-based drinks drives the market.
Market Trends The expansion of tea-producing sources around the world has dropped the price of raw materials significantly.

Cocoa Nibs Market:

Attributes Cocoa Nibs Market
CAGR (2022 to 2032) 7.6%
Market Value (2022) US$ 1.36 Billion
Growth Factor Increasing consumption of chocolate and associated foods & beverages.
Future Opportunities Acceptance of cocoa-based food items in non-traditional cocoa growing areas to create huge opportunities.
Market Trends The proliferation of online businesses has achieved worldwide sales of cocoa products and is driving the market.

A dramatic change in the consumer orientation towards a Westernized diet strong in animal protein, processed carbohydrates, and other foods has been noticed, departing from a conventional, more diverse, and regular diet rich in natural products.

Functional beverage producers are developing application-specific drinks as a result of advances in product uptake and technology. The cocoa-based polyphenols market share has undergone a revolutionary change as a result of the introduction of several new chemicals to mask the taste of certain omega-3 fatty acids and amino acids.

European consumer interest in healthy food items is increasing day by day, which the cocoa based polyphenols market players might capitalize on. This is also anticipated to increase demand for cocoa-based polyphenols by boosting the market for functional foods in Europe. While the effectiveness and safety of nutrition are gaining attention in various Central and South American nations, this has also prompted cocoa-based polyphenols producers to supply nutritional supplements, functional food items, and drinks in the regional countries.

Get the data you need at a Fraction of the cost

Personalize your report by choosing insights you need
and save 40%!

Category-wise Insights for Cocoa Based Polyphenols Market

Which is the Highest Selling Product Type in the Global Cocoa Based Polyphenols Market?

With 32.7% of the overall revenue share in 2022, the functional beverages category topped all the cocoa-based polyphenols market segments. Throughout the projected period, the cocoa-based polyphenols market's key trends and opportunities are anticipated to rise due to the expansion of this sector.

Such increment in the functional beverages category may be attributed to the noticeable increase in beverage businesses that specialize in cardiovascular protection. Given that they provide customers with total nutrition and well-being, functional beverages are a key component driving the cocoa-based polyphenols market opportunities.

Since functional foods often have higher costs and better profit margins than traditional foods, many cocoa-based polyphenols producers find them to be appealing. Prospects in the functional foods industry are anticipated to arise for rising nations in the Asia Pacific, Central, and South America, and Japan as a consequence of booming local markets and expanding export opportunities.

The other segment of dietary supplements is becoming more and more well-liked among customers looking for all-natural treatments for different medical conditions. As per the cocoa-based polyphenols market statistics report figures out, this segment would be a rapidly growing segment in the upcoming days. Natural supplements are the recommended method for treating a range of digestive disorders that could emerge as a better-performing application segment of the global cocoa-based polyphenols markets over the forecasted years.

Regional Analysis of the Cocoa Based Polyphenols Market

How Cocoa-Based Polyphenols Market Share is performing in Asia Pacific Region?

As per the new market research report on cocoa-based polyphenols, the Asia Pacific region is emerging to be the leading market in 2021, with more than 35% revenue share. This rise in sales of cocoa-based polyphenols is attributable to the increased demand for plant-based food items in Asia Pacific countries as people become more aware of their health advantages.

This is a crucial aspect that is anticipated to open the door for cocoa-based polyphenols market opportunities throughout the Asia Pacific in terms of value sales, particularly in India, China, Australia, and Indonesia, over the anticipated years. Thus, it is projected that over time, the aforementioned variables will provide a wealth of potential for the expansion of the cocoa-based polyphenols market size derived from cocoa throughout Central and South America.

What is the Performance of the Cocoa-Based Polyphenols Market in the North America Region?

The sales of cocoa-based polyphenols in North America are anticipated to be fuelled by the rising trend of customers who are choosing nutritional supplements and food items rich in Vitamin and anti-oxidant elements.

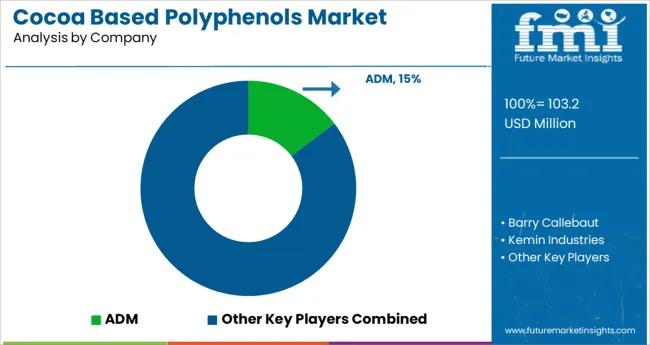
It is predicted that the North American cocoa-based polyphenols market may expand throughout the projected timeframe due to the existence of big firms like ADM and Sabinsa Company that are actively investigating their potential in packaged food goods and beverages.
Competitive Landscape for the Cocoa Based Polyphenols Market

The fragmented character of the global cocoa-based polyphenols market means that it heavily depends on several major market participants in competition among themselves. To fulfill the increased demand, the cocoa-based polyphenols market key players are constantly improving and expanding their production facilities and procedures.

To establish their position in the market, cocoa-based polyphenols industries have engaged in a variety of strategic efforts, including product diversification, manufacturing capacity growth, and divestiture of sources.

Major Developments

  • The collection of Non-GMO Project Verified plant extracts from Layn Natural Ingredients was introduced in the year 2021. The product line focuses on polyphenol-rich plant extract, including cocoa plants, with significant functional advantages in sports diets, and the nutritional supplements market.
  • The NutraT range of antioxidants was introduced by Frutarom in the year 2016. These products were created to be suited for fully prepared to-dissolve powder formulae that mix with water and other beverages.

How is the Start-up Ecosystem in the Global Cocoa Based Polyphenols Market?

Due to expanding middle class and booming economy, the global market is becoming a source of substantial spending for consumers. Due to its highly fragmented and disorganized industry, the market is providing enormous development prospects to both local and foreign cocoa-based polyphenols enterprises.

As evident from the new market research report on cocoa-based polyphenols by FMI, several start-ups have emerged with a target of capitalizing on the growing preference for organic and natural food ingredients among urban people. Most of the new cocoa-based polyphenols market players entering the sector are heavily relying on online channels for marketing and distribution of their products.

Global Cocoa Based Polyphenols Market Key Players

  • ADM
  • Barry Callebaut
  • Kemin Industries
  • Mars, Incorporated
  • Naturex S.A
  • Nutra Ingredients Limited
  • Polyphenols AS
  • Ajinomoto Natural Specialities
  • Sabinsa, BERKEM
  • Diana Food

Cocoa Based Polyphenols Market by Segmentation

By Application:

  • Functional Foods
  • Functional Beverages
  • Dietary Supplements
  • Others

By Region:

  • North America
  • Latin America
  • Europe
  • East Asia
  • South Asia
  • Oceania
  • Middle East and Africa

Frequently Asked Questions

At What Rate will the Cocoa Based Polyphenols Market Grow?

The cocoa-based polyphenols market is expected to grow at 5.8% CAGR from 2022 to 2032.

What is the Net Worth of the Global Cocoa Based Polyphenols Market?

The cocoa-based polyphenols market is estimated to be around US$ 87.1 Million in 2022.

What is the Projected Value of the Cocoa Based Polyphenols Market?

The cocoa-based polyphenols market is to reach a valuation of US$ 153.2 Million by 2032.

Which is the Best Application of the Cocoa Based Polyphenols Market?

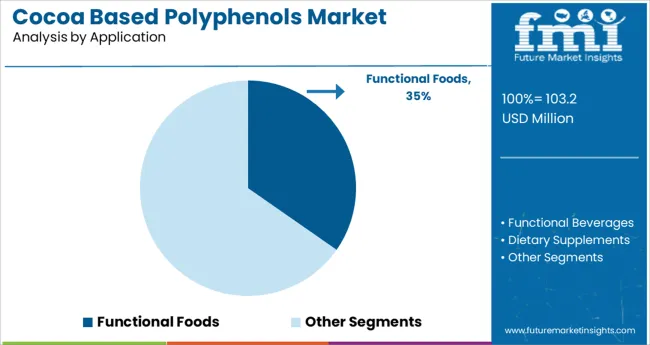
Functional food contributes to almost 35% of the market share.

Which is the Best Region for the Cocoa Based Polyphenols Market?

Asia Pacific region is the dominant cocoa-based polyphenols market.

Table of Content

1. Executive Summary | Cocoa-Based Polyphenols Market

    1.1. Global Market Outlook

    1.2. Demand-side Trends

    1.3. Supply-side Trends

    1.4. Technology Roadmap Analysis

    1.5. Analysis and Recommendations

2. Market Overview

    2.1. Market Coverage / Taxonomy

    2.2. Market Definition / Scope / Limitations

3. Market Background

    3.1. Market Dynamics

        3.1.1. Drivers

        3.1.2. Restraints

        3.1.3. Opportunity

        3.1.4. Trends

    3.2. Scenario Forecast

        3.2.1. Demand in Optimistic Scenario

        3.2.2. Demand in Likely Scenario

        3.2.3. Demand in Conservative Scenario

    3.3. Opportunity Map Analysis

    3.4. Product Life Cycle Analysis

    3.5. Supply Chain Analysis

        3.5.1. Supply Side Participants and Their Roles

            3.5.1.1. Producers

            3.5.1.2. Mid-Level Participants (Traders/ Agents/ Brokers)

            3.5.1.3. Wholesalers and Distributors

        3.5.2. Value Added and Value Created at Node in the Supply Chain

        3.5.3. List of Raw Material Suppliers

        3.5.4. List of Existing and Potential Buyers

    3.6. Investment Feasibility Matrix

    3.7. Value Chain Analysis

        3.7.1. Profit Margin Analysis

        3.7.2. Wholesalers and Distributors

        3.7.3. Retailers

    3.8. PESTLE and Porter’s Analysis

    3.9. Regulatory Landscape

        3.9.1. By Key Regions

        3.9.2. By Key Countries

    3.10. Regional Parent Market Outlook

    3.11. Production and Consumption Statistics

    3.12. Import and Export Statistics

4. Global Market Analysis 2017 to 2021 and Forecast, 2022 to 2032

    4.1. Historical Market Size Value (US$ Billion) & Volume (Tons) Analysis, 2017 to 2021

    4.2. Current and Future Market Size Value (US$ Billion) & Volume (Tons) Projections, 2022 to 2032

        4.2.1. Y-o-Y Growth Trend Analysis

        4.2.2. Absolute Opportunity Analysis

5. Global Market Analysis 2017 to 2021 and Forecast 2022 to 2032, By Application

    5.1. Introduction / Key Findings

    5.2. Historical Market Size Value (US$ Billion) & Volume (Tons) Analysis By Application, 2017 to 2021

    5.3. Current and Future Market Size Value (US$ Billion) & Volume (Tons) Analysis and Forecast By Application, 2022 to 2032

        5.3.1. Functional Foods

        5.3.2. Functional Beverages

        5.3.3. Dietary Supplements

        5.3.4. Other Applications

    5.4. Y-o-Y Growth Trend Analysis By Application, 2017 to 2021

    5.5. Absolute Opportunity Analysis By Application, 2022 to 2032

6. Global Market Analysis 2017 to 2021 and Forecast 2022 to 2032, By Region

    6.1. Introduction

    6.2. Historical Market Size Value (US$ Billion) & Volume (Tons) Analysis By Region, 2017 to 2021

    6.3. Current Market Size Value (US$ Billion) & Volume (Tons) Analysis and Forecast By Region, 2022 to 2032

        6.3.1. North America

        6.3.2. Latin America

        6.3.3. Europe

        6.3.4. Asia Pacific

        6.3.5. Middle East and Africa

    6.4. Market Attractiveness Analysis By Region

7. North America Market Analysis 2017 to 2021 and Forecast 2022 to 2032, By Country

    7.1. Historical Market Size Value (US$ Billion) & Volume (Tons) Trend Analysis By Market Taxonomy, 2017 to 2021

    7.2. Market Size Value (US$ Billion) & Volume (Tons) Forecast By Market Taxonomy, 2022 to 2032

        7.2.1. By Country

            7.2.1.1. United States of America

            7.2.1.2. Canada

        7.2.2. By Application

    7.3. Market Attractiveness Analysis

        7.3.1. By Country

        7.3.2. By Application

    7.4. Key Takeaways

8. Latin America Market Analysis 2017 to 2021 and Forecast 2022 to 2032, By Country

    8.1. Historical Market Size Value (US$ Billion) & Volume (Tons) Trend Analysis By Market Taxonomy, 2017 to 2021

    8.2. Market Size Value (US$ Billion) & Volume (Tons) Forecast By Market Taxonomy, 2022 to 2032

        8.2.1. By Country

            8.2.1.1. Brazil

            8.2.1.2. Mexico

            8.2.1.3. Rest of Latin America

        8.2.2. By Application

    8.3. Market Attractiveness Analysis

        8.3.1. By Country

        8.3.2. By Application

    8.4. Key Takeaways

9. Europe Market Analysis 2017 to 2021 and Forecast 2022 to 2032, By Country

    9.1. Historical Market Size Value (US$ Billion) & Volume (Tons) Trend Analysis By Market Taxonomy, 2017 to 2021

    9.2. Market Size Value (US$ Billion) & Volume (Tons) Forecast By Market Taxonomy, 2022 to 2032

        9.2.1. By Country

            9.2.1.1. Germany

            9.2.1.2. United Kingdom

            9.2.1.3. France

            9.2.1.4. Spain

            9.2.1.5. Italy

            9.2.1.6. Russia

            9.2.1.7. Rest of Europe

        9.2.2. By Application

    9.3. Market Attractiveness Analysis

        9.3.1. By Country

        9.3.2. By Application

    9.4. Key Takeaways

10. Asia Pacific Market Analysis 2017 to 2021 and Forecast 2022 to 2032, By Country

    10.1. Historical Market Size Value (US$ Billion) & Volume (Tons) Trend Analysis By Market Taxonomy, 2017 to 2021

    10.2. Market Size Value (US$ Billion) & Volume (Tons) Forecast By Market Taxonomy, 2022 to 2032

        10.2.1. By Country

            10.2.1.1. China

            10.2.1.2. Japan

            10.2.1.3. India

            10.2.1.4. South Korea

            10.2.1.5. Australia

            10.2.1.6. Rest of Asia-Pacific

        10.2.2. By Application

    10.3. Market Attractiveness Analysis

        10.3.1. By Country

        10.3.2. By Application

    10.4. Key Takeaways

11. MEA Market Analysis 2017 to 2021 and Forecast 2022 to 2032, By Country

    11.1. Historical Market Size Value (US$ Billion) & Volume (Tons) Trend Analysis By Market Taxonomy, 2017 to 2021

    11.2. Market Size Value (US$ Billion) & Volume (Tons) Forecast By Market Taxonomy, 2022 to 2032

        11.2.1. By Country

            11.2.1.1. South Africa

            11.2.1.2. Saudi Arabia

            11.2.1.3. UAE

            11.2.1.4. Israel

            11.2.1.5. Rest of Middle East and Africa

        11.2.2. By Application

    11.3. Market Attractiveness Analysis

        11.3.1. By Country

        11.3.2. By Application

    11.4. Key Takeaways

12. Key Countries Market Analysis

    12.1. Value (US$ Billion) & Volume (Tons)ed States

        12.1.1. Pricing Analysis

        12.1.2. Market Share Analysis, 2021

            12.1.2.1. By Application

    12.2. Canada

        12.2.1. Pricing Analysis

        12.2.2. Market Share Analysis, 2021

            12.2.2.1. By Application

    12.3. Brazil

        12.3.1. Pricing Analysis

        12.3.2. Market Share Analysis, 2021

            12.3.2.1. By Application

    12.4. Mexico

        12.4.1. Pricing Analysis

        12.4.2. Market Share Analysis, 2021

            12.4.2.1. By Application

    12.5. Germany

        12.5.1. Pricing Analysis

        12.5.2. Market Share Analysis, 2021

            12.5.2.1. By Application

    12.6. United Kingdom

        12.6.1. Pricing Analysis

        12.6.2. Market Share Analysis, 2021

            12.6.2.1. By Application

    12.7. France

        12.7.1. Pricing Analysis

        12.7.2. Market Share Analysis, 2021

            12.7.2.1. By Application

    12.8. Spain

        12.8.1. Pricing Analysis

        12.8.2. Market Share Analysis, 2021

            12.8.2.1. By Application

    12.9. Italy

        12.9.1. Pricing Analysis

        12.9.2. Market Share Analysis, 2021

            12.9.2.1. By Application

    12.10. Russia

        12.10.1. Pricing Analysis

        12.10.2. Market Share Analysis, 2021

            12.10.2.1. By Application

    12.11. China

        12.11.1. Pricing Analysis

        12.11.2. Market Share Analysis, 2021

            12.11.2.1. By Application

    12.12. Japan

        12.12.1. Pricing Analysis

        12.12.2. Market Share Analysis, 2021

            12.12.2.1. By Application

    12.13. India

        12.13.1. Pricing Analysis

        12.13.2. Market Share Analysis, 2021

            12.13.2.1. By Application

    12.14. South Korea

        12.14.1. Pricing Analysis

        12.14.2. Market Share Analysis, 2021

            12.14.2.1. By Application

    12.15. Australia

        12.15.1. Pricing Analysis

        12.15.2. Market Share Analysis, 2021

            12.15.2.1. By Application

    12.16. South Africa

        12.16.1. Pricing Analysis

        12.16.2. Market Share Analysis, 2021

            12.16.2.1. By Application

    12.17. Saudi Arabia

        12.17.1. Pricing Analysis

        12.17.2. Market Share Analysis, 2021

            12.17.2.1. By Application

    12.18. UAE

        12.18.1. Pricing Analysis

        12.18.2. Market Share Analysis, 2021

            12.18.2.1. By Application

    12.19. Israel

        12.19.1. Pricing Analysis

        12.19.2. Market Share Analysis, 2021

            12.19.2.1. By Application

13. Market Structure Analysis

    13.1. Competition Dashboard

    13.2. Competition Benchmarking

    13.3. Market Share Analysis of Top Players

        13.3.1. By Regional

        13.3.2. By Application

14. Competition Analysis

    14.1. Competition Deep Dive

        14.1.1. ADM

            14.1.1.1. Overview

            14.1.1.2. Product Portfolio

            14.1.1.3. Profitability by Market Segments

            14.1.1.4. Sales Footprint

            14.1.1.5. Strategy Overview

                14.1.1.5.1. Marketing Strategy

                14.1.1.5.2. Product Strategy

                14.1.1.5.3. Channel Strategy

        14.1.2. Barry Callebaut

            14.1.2.1. Overview

            14.1.2.2. Product Portfolio

            14.1.2.3. Profitability by Market Segments

            14.1.2.4. Sales Footprint

            14.1.2.5. Strategy Overview

                14.1.2.5.1. Marketing Strategy

                14.1.2.5.2. Product Strategy

                14.1.2.5.3. Channel Strategy

        14.1.3. Kemin Industries

            14.1.3.1. Overview

            14.1.3.2. Product Portfolio

            14.1.3.3. Profitability by Market Segments

            14.1.3.4. Sales Footprint

            14.1.3.5. Strategy Overview

                14.1.3.5.1. Marketing Strategy

                14.1.3.5.2. Product Strategy

                14.1.3.5.3. Channel Strategy

        14.1.4. Mars, Incorporated

            14.1.4.1. Overview

            14.1.4.2. Product Portfolio

            14.1.4.3. Profitability by Market Segments

            14.1.4.4. Sales Footprint

            14.1.4.5. Strategy Overview

                14.1.4.5.1. Marketing Strategy

                14.1.4.5.2. Product Strategy

                14.1.4.5.3. Channel Strategy

        14.1.5. Naturex S.A

            14.1.5.1. Overview

            14.1.5.2. Product Portfolio

            14.1.5.3. Profitability by Market Segments

            14.1.5.4. Sales Footprint

            14.1.5.5. Strategy Overview

                14.1.5.5.1. Marketing Strategy

                14.1.5.5.2. Product Strategy

                14.1.5.5.3. Channel Strategy

        14.1.6. Nutra Ingredients Limited

            14.1.6.1. Overview

            14.1.6.2. Product Portfolio

            14.1.6.3. Profitability by Market Segments

            14.1.6.4. Sales Footprint

            14.1.6.5. Strategy Overview

                14.1.6.5.1. Marketing Strategy

                14.1.6.5.2. Product Strategy

                14.1.6.5.3. Channel Strategy

        14.1.7. Polyphenols AS

            14.1.7.1. Overview

            14.1.7.2. Product Portfolio

            14.1.7.3. Profitability by Market Segments

            14.1.7.4. Sales Footprint

            14.1.7.5. Strategy Overview

                14.1.7.5.1. Marketing Strategy

                14.1.7.5.2. Product Strategy

                14.1.7.5.3. Channel Strategy

        14.1.8. Ajinomoto NaturalSpecialities

            14.1.8.1. Overview

            14.1.8.2. Product Portfolio

            14.1.8.3. Profitability by Market Segments

            14.1.8.4. Sales Footprint

            14.1.8.5. Strategy Overview

                14.1.8.5.1. Marketing Strategy

                14.1.8.5.2. Product Strategy

                14.1.8.5.3. Channel Strategy

        14.1.9. Sabinsa

            14.1.9.1. Overview

            14.1.9.2. Product Portfolio

            14.1.9.3. Profitability by Market Segments

            14.1.9.4. Sales Footprint

            14.1.9.5. Strategy Overview

                14.1.9.5.1. Marketing Strategy

                14.1.9.5.2. Product Strategy

                14.1.9.5.3. Channel Strategy

        14.1.10. BERKEM

            14.1.10.1. Overview

            14.1.10.2. Product Portfolio

            14.1.10.3. Profitability by Market Segments

            14.1.10.4. Sales Footprint

            14.1.10.5. Strategy Overview

                14.1.10.5.1. Marketing Strategy

                14.1.10.5.2. Product Strategy

                14.1.10.5.3. Channel Strategy

        14.1.11. Diana Food

            14.1.11.1. Overview

            14.1.11.2. Product Portfolio

            14.1.11.3. Profitability by Market Segments

            14.1.11.4. Sales Footprint

            14.1.11.5. Strategy Overview

                14.1.11.5.1. Marketing Strategy

                14.1.11.5.2. Product Strategy

                14.1.11.5.3. Channel Strategy

15. Assumptions & Acronyms Used

16. Research Methodology

List of Tables

Table 1: Global Market Value (US$ Billion) Forecast by Region, 2017 to 2032

Table 2: Global Market Volume (Tons) Forecast by Region, 2017 to 2032

Table 3: Global Market Value (US$ Billion) Forecast by Application, 2017 to 2032

Table 4: Global Market Volume (Tons) Forecast by Application, 2017 to 2032

Table 5: North America Market Value (US$ Billion) Forecast by Country, 2017 to 2032

Table 6: North America Market Volume (Tons) Forecast by Country, 2017 to 2032

Table 7: North America Market Value (US$ Billion) Forecast by Application, 2017 to 2032

Table 8: North America Market Volume (Tons) Forecast by Application, 2017 to 2032

Table 9: Latin America Market Value (US$ Billion) Forecast by Country, 2017 to 2032

Table 10: Latin America Market Volume (Tons) Forecast by Country, 2017 to 2032

Table 11: Latin America Market Value (US$ Billion) Forecast by Application, 2017 to 2032

Table 12: Latin America Market Volume (Tons) Forecast by Application, 2017 to 2032

Table 13: Europe Market Value (US$ Billion) Forecast by Country, 2017 to 2032

Table 14: Europe Market Volume (Tons) Forecast by Country, 2017 to 2032

Table 15: Europe Market Value (US$ Billion) Forecast by Application, 2017 to 2032

Table 16: Europe Market Volume (Tons) Forecast by Application, 2017 to 2032

Table 17: Asia Pacific Market Value (US$ Billion) Forecast by Country, 2017 to 2032

Table 18: Asia Pacific Market Volume (Tons) Forecast by Country, 2017 to 2032

Table 19: Asia Pacific Market Value (US$ Billion) Forecast by Application, 2017 to 2032

Table 20: Asia Pacific Market Volume (Tons) Forecast by Application, 2017 to 2032

Table 21: Middle East and Africa Market Value (US$ Billion) Forecast by Country, 2017 to 2032

Table 22: Middle East and Africa Market Volume (Tons) Forecast by Country, 2017 to 2032

Table 23: Middle East and Africa Market Value (US$ Billion) Forecast by Application, 2017 to 2032

Table 24: Middle East and Africa Market Volume (Tons) Forecast by Application, 2017 to 2032

List of Charts

Figure 1: Global Market Value (US$ Billion) by Application, 2022 to 2032

Figure 2: Global Market Value (US$ Billion) by Region, 2022 to 2032

Figure 3: Global Market Value (US$ Billion) Analysis by Region, 2017 to 2032

Figure 4: Global Market Volume (Tons) Analysis by Region, 2017 to 2032

Figure 5: Global Market Value Share (%) and BPS Analysis by Region, 2022 to 2032

Figure 6: Global Market Y-o-Y Growth (%) Projections by Region, 2022 to 2032

Figure 7: Global Market Value (US$ Billion) Analysis by Application, 2017 to 2032

Figure 8: Global Market Volume (Tons) Analysis by Application, 2017 to 2032

Figure 9: Global Market Value Share (%) and BPS Analysis by Application, 2022 to 2032

Figure 10: Global Market Y-o-Y Growth (%) Projections by Application, 2022 to 2032

Figure 11: Global Market Attractiveness by Application, 2022 to 2032

Figure 12: Global Market Attractiveness by Region, 2022 to 2032

Figure 13: North America Market Value (US$ Billion) by Application, 2022 to 2032

Figure 14: North America Market Value (US$ Billion) by Country, 2022 to 2032

Figure 15: North America Market Value (US$ Billion) Analysis by Country, 2017 to 2032

Figure 16: North America Market Volume (Tons) Analysis by Country, 2017 to 2032

Figure 17: North America Market Value Share (%) and BPS Analysis by Country, 2022 to 2032

Figure 18: North America Market Y-o-Y Growth (%) Projections by Country, 2022 to 2032

Figure 19: North America Market Value (US$ Billion) Analysis by Application, 2017 to 2032

Figure 20: North America Market Volume (Tons) Analysis by Application, 2017 to 2032

Figure 21: North America Market Value Share (%) and BPS Analysis by Application, 2022 to 2032

Figure 22: North America Market Y-o-Y Growth (%) Projections by Application, 2022 to 2032

Figure 23: North America Market Attractiveness by Application, 2022 to 2032

Figure 24: North America Market Attractiveness by Country, 2022 to 2032

Figure 25: Latin America Market Value (US$ Billion) by Application, 2022 to 2032

Figure 26: Latin America Market Value (US$ Billion) by Country, 2022 to 2032

Figure 27: Latin America Market Value (US$ Billion) Analysis by Country, 2017 to 2032

Figure 28: Latin America Market Volume (Tons) Analysis by Country, 2017 to 2032

Figure 29: Latin America Market Value Share (%) and BPS Analysis by Country, 2022 to 2032

Figure 30: Latin America Market Y-o-Y Growth (%) Projections by Country, 2022 to 2032

Figure 31: Latin America Market Value (US$ Billion) Analysis by Application, 2017 to 2032

Figure 32: Latin America Market Volume (Tons) Analysis by Application, 2017 to 2032

Figure 33: Latin America Market Value Share (%) and BPS Analysis by Application, 2022 to 2032

Figure 34: Latin America Market Y-o-Y Growth (%) Projections by Application, 2022 to 2032

Figure 35: Latin America Market Attractiveness by Application, 2022 to 2032

Figure 36: Latin America Market Attractiveness by Country, 2022 to 2032

Figure 37: Europe Market Value (US$ Billion) by Application, 2022 to 2032

Figure 38: Europe Market Value (US$ Billion) by Country, 2022 to 2032

Figure 39: Europe Market Value (US$ Billion) Analysis by Country, 2017 to 2032

Figure 40: Europe Market Volume (Tons) Analysis by Country, 2017 to 2032

Figure 41: Europe Market Value Share (%) and BPS Analysis by Country, 2022 to 2032

Figure 42: Europe Market Y-o-Y Growth (%) Projections by Country, 2022 to 2032

Figure 43: Europe Market Value (US$ Billion) Analysis by Application, 2017 to 2032

Figure 44: Europe Market Volume (Tons) Analysis by Application, 2017 to 2032

Figure 45: Europe Market Value Share (%) and BPS Analysis by Application, 2022 to 2032

Figure 46: Europe Market Y-o-Y Growth (%) Projections by Application, 2022 to 2032

Figure 47: Europe Market Attractiveness by Application, 2022 to 2032

Figure 48: Europe Market Attractiveness by Country, 2022 to 2032

Figure 49: Asia Pacific Market Value (US$ Billion) by Application, 2022 to 2032

Figure 50: Asia Pacific Market Value (US$ Billion) by Country, 2022 to 2032

Figure 51: Asia Pacific Market Value (US$ Billion) Analysis by Country, 2017 to 2032

Figure 52: Asia Pacific Market Volume (Tons) Analysis by Country, 2017 to 2032

Figure 53: Asia Pacific Market Value Share (%) and BPS Analysis by Country, 2022 to 2032

Figure 54: Asia Pacific Market Y-o-Y Growth (%) Projections by Country, 2022 to 2032

Figure 55: Asia Pacific Market Value (US$ Billion) Analysis by Application, 2017 to 2032

Figure 56: Asia Pacific Market Volume (Tons) Analysis by Application, 2017 to 2032

Figure 57: Asia Pacific Market Value Share (%) and BPS Analysis by Application, 2022 to 2032

Figure 58: Asia Pacific Market Y-o-Y Growth (%) Projections by Application, 2022 to 2032

Figure 59: Asia Pacific Market Attractiveness by Application, 2022 to 2032

Figure 60: Asia Pacific Market Attractiveness by Country, 2022 to 2032

Figure 61: Middle East and Africa Market Value (US$ Billion) by Application, 2022 to 2032

Figure 62: Middle East and Africa Market Value (US$ Billion) by Country, 2022 to 2032

Figure 63: Middle East and Africa Market Value (US$ Billion) Analysis by Country, 2017 to 2032

Figure 64: Middle East and Africa Market Volume (Tons) Analysis by Country, 2017 to 2032

Figure 65: Middle East and Africa Market Value Share (%) and BPS Analysis by Country, 2022 to 2032

Figure 66: Middle East and Africa Market Y-o-Y Growth (%) Projections by Country, 2022 to 2032

Figure 67: Middle East and Africa Market Value (US$ Billion) Analysis by Application, 2017 to 2032

Figure 68: Middle East and Africa Market Volume (Tons) Analysis by Application, 2017 to 2032

Figure 69: Middle East and Africa Market Value Share (%) and BPS Analysis by Application, 2022 to 2032

Figure 70: Middle East and Africa Market Y-o-Y Growth (%) Projections by Application, 2022 to 2032

Figure 71: Middle East and Africa Market Attractiveness by Application, 2022 to 2032

Figure 72: Middle East and Africa Market Attractiveness by Country, 2022 to 2032

Recommendations

Food and Beverage

Cocoa Powder Market

Published : March 2024

Food and Beverage

Cocoa Butter Market

Published : July 2023

Food and Beverage

Cocoa Liquor Market

Published : June 2023

Food and Beverage

Cocoa Market

Published : February 2023

Explore Chemicals & Materials Insights

View Reports

Cocoa Based Polyphenols Market