Coconut Water Market Size and Share Forecast Outlook 2025 to 2035

The global coconut water market is projected to rise from USD 7.1 billion in 2025 to USD 14.5 billion by 2035, growing at a CAGR of 7.2%. The acceleration is led by a confluence of factors, including expanding functional beverage portfolios, urbanization of hydration habits, and precision-driven retail execution.
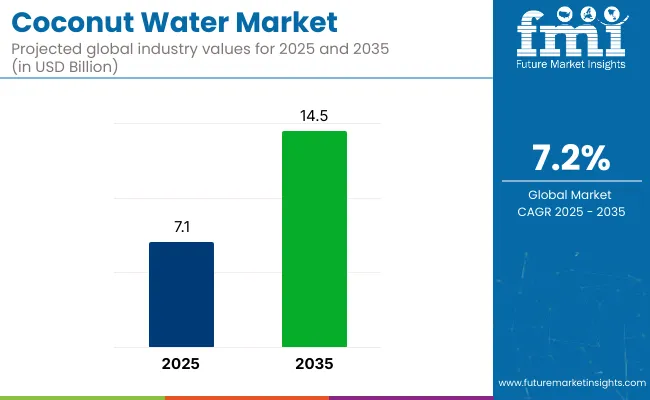
Quick Stats for Coconut Water Market

  • Largest by Nature: Conventional coconut water - 92.6% of global revenue
  • Largest by Flavour: Original/unflavoured - 73% share
  • Largest by Application: Retail-pack hydration (RTD) - 64% share
  • Largest by Sales Channel: Direct contracts (gyms, airlines, food-service) - 37.6% share
  • Largest Market: United States - 18% share

Coconut Water Market

Metric Value
Market Size in 2025 USD 7.1 billion
Projected Market Size in 2035 USD 14.5 billion
CAGR (2025 to 2035) 7.2%

Brick-and-mortar and e-commerce channels are witnessing balanced demand, whereas urban grocery formats are reporting up to 38% higher footfall in the functional hydration aisle. DTC brands have shortened repeat-purchase cycles by 12%, aided by subscription models.

Coconut water represents approximately 22-25% of the total coconut-derived product market. Within the plant-based beverage category, it accounts for around 15% of global consumption. It contributes nearly 18% to the natural hydration beverage segment and makes up 7-9% of input volume in the stabilizers and beverage emulsions space. In the broader functional beverage landscape, coconut water holds an estimated 12-14% share, reflecting its growing role in clean-label and wellness-driven formulations.

In Asia-Pacific, regional bottlers and value-added processors have enhanced inventory turnover by digitizing sourcing, warehousing, and logistics. Markets like Thailand and Indonesia are witnessing faster inventory churn due to higher consumer frequency and tourism-led consumption. Investor confidence is evident in the IFBH IPO in Hong Kong in early 2025, which was oversubscribed 2,682 times, highlighting backend supply chain strength and rising retail pull.

Startups are adopting blockchain-integrated supply chain systems to enhance transparency in coconut water production. These platforms allow real-time tracking of raw coconut sourcing, including geotagged farm origin, harvest timestamps, and processing compliance checkpoints.

By embedding QR-coded traceability into retail packaging, brands are offering verifiable proof of freshness, organic compliance, and low-temperature logistics integrity. This digitized traceability is proving critical in markets where quality differentiation, export certification, and environmental assurance are becoming standard buyer expectations.

Product innovation is expanding beyond single-ingredient hydration. Coconut water is now being infused with adaptogens, probiotics, and plant protein. Sports and fitness-oriented startups are driving the trend toward multi-functional coconut water drinks with specified mineral profiles for recovery, gut health, and electrolyte replenishment.

Price sensitivity has remained moderate, with organic coconut water averaging USD 3,000 per MT, and conventional grades around USD 2,000 per MT, stable across key regions. This pricing consistency, paired with advancements in flavor science, shelf stability, and digital distribution, is creating a resilient growth path for coconut water worldwide.

Analyzing Coconut Water Market by Top Investment Segments

The coconut water market is segmented by Nature into Conventional, Organic; by Flavour into Original/Unflavoured, Flavoured; by Application into Food, Beverages, Personal Care & Cosmetics, Nutraceutical, Animal Feed, and Retail; By Sales Channel into Direct Sales and Indirect Sales; by Region into North America, Latin America, Europe, East Asia, South Asia, Oceania, Middle East & Africa.

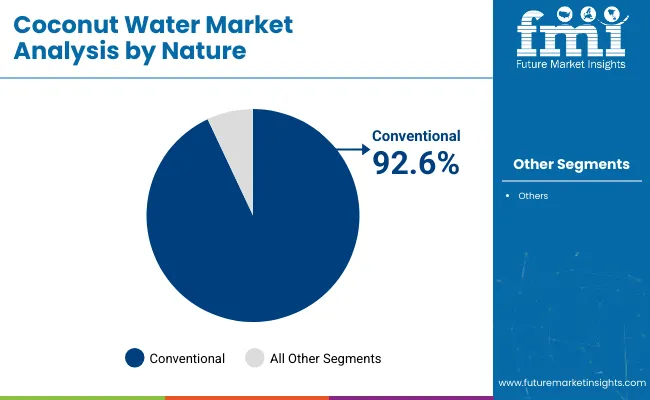
Conventional Coconut Water Holds 92.6% Market Share but Organic Growing at Faster Pace

Conventional dominates, commanding 92.6% of share in 2025, while organic accounts for 7.4% share. Organic coconut water is expanding faster than conventional but still holds a modest footprint. Over the 2025 to 2035 forecast window, organic segment is projected to grow at an 8.6% CAGR, outpacing the 7.0% CAGR expected for conventional lines yet its share will remain modest in absolute terms.
  • Average FOB price for organic stays roughly 50% higher than conventional, underscoring sticky premium elasticity.
  • Urban shoppers devote 35% more per-capita spend to organic hydration than the global norm, preserving niche pricing power.
  • USA supermarket shelf facings for organic lines expanded 22% year-on-year through Q2 2025, signalling mainstream infiltration.

Coconut Water Market Analysis By Nature

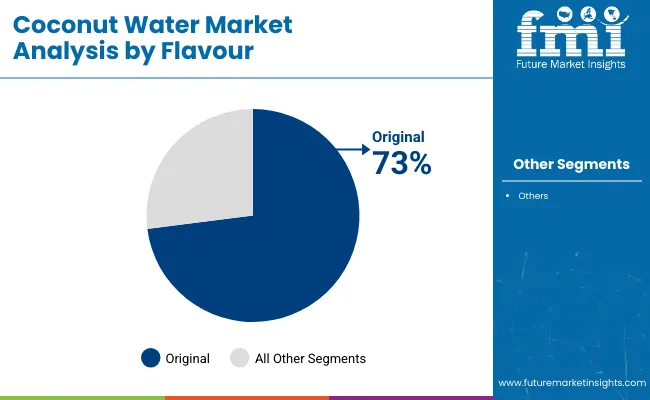
Original Leads the Flavour Segmentation by Taste Preference

Original, unflavoured coconut water controls 73% of global share in 2025, while flavoured variants occupy the remaining 27%. Across the 2025 to 2035 forecast window original segment is projected to grow at a 7.7% CAGR, versus 7.3% CAGR for flavoured lines, further widening the gap.
  • Flavoured SKUs convert trial faster but suffer lower repeat-purchase rates, causing households that buy both to channel 62% of their spend back to original within a year.
  • Flavoured packs secure a 9% higher price per litre yet receive 2.5 × fewer shelf facings than original, limiting turnover.
  • Portfolio anchoring on original ensures baseline velocity, while flavoured launches function as seasonal or promotional lift rather than core volume drivers.

Coconut Water Market Analysis By Flavor

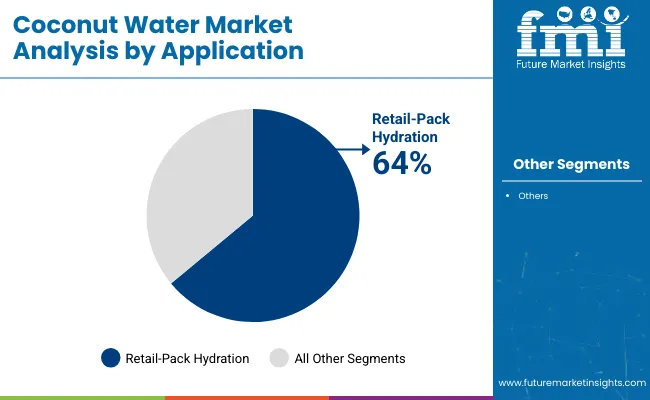
Retail-Pack Hydration Leads the Application Segmentation

Retail-pack hydration products command 64% of global coconut-water revenue in 2025, far ahead of food-processing powders at 9.3%. Alcoholic mixes benefit from premiumisation, driving the fastest growth but remain a small base.
  • Tea and coffee infusions stay niche at just over 1% of market share despite café experimentation.
  • Food processors leverage dehydrated coconut crystals in cereals for added potassium and flavour, while yoghurt and bakery manufacturers use liquid coconut water for low-GI sweetness.

Coconut Water Market Analysis By Application

Indirect Sales Channels Account for Higher Share

Sales routes split between direct and indirect. Direct contracts including gyms, airlines, and foodservice account for 37.6% of 2025 share. Orders trend toward 330-ml and 1-litre Tetra packs with average contract terms of nine months.
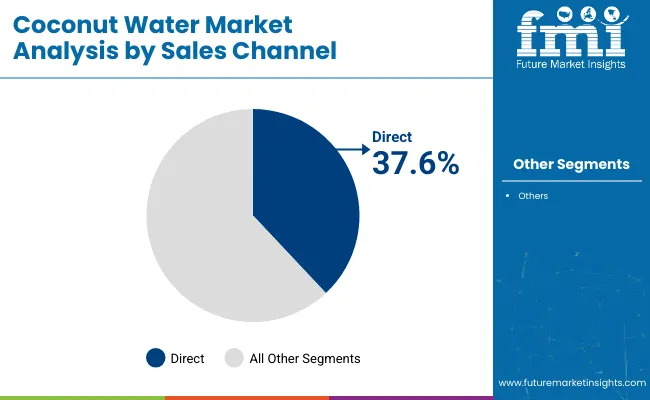
  • Indirect routes take 62.4%, led by modern trade at 21.4%.
  • Grocery and convenience channels both hover near 12%.
  • Discount chains reach 11.1%, offering larger pack sizes.
  • Online retailers make up 6.0% but grow fastest at 18 to 20% CAGR.

Coconut Water Market Analysis By Sales Channel

Coconut Water Market Dynamics and Trends

Inventory Compression & Shelf Efficiency

Retailers are compressing coconut water inventory cycles to optimize SKU productivity. Retailers now expect coconut water SKUs to turn faster than traditional RTD juices by 1.7×, especially in refrigerated formats. Modern trade players are allocating more cold shelf space to multipack coconut water due to rising basket sizes and repeat rates.

Meanwhile, discounters focus on value packs, reporting fewer markdowns YOY due to better demand planning. Brands with shorter expiry windows (e.g., HPP-treated) are using dynamic markdown pricing tied to smart shelf tags, improving sell-throughs. This tighter inventory and shelf management loop is pushing producers toward leaner batch cycles, reducing warehouse buffer stocks freeing up working capital and tightening the supply-demand sync.

Electrolyte-Performance Positioning Gains Clinical Backing

Scientific research is increasingly validating coconut water’s electrolyte performance. Augmented coconut water matched to a sports drink’s carbs and sodium sustained hydration and 20 km cycling performance just as effectively as the commercial sports drink as per research by National Library of Medicine.

Based on these insights, sports nutrition startups are now launching SKUs with clinically dosed 400mg potassium per 250ml, aligned with WHO hydration guidelines. These formulations command a price premium in gyms and e-commerce wellness channels. Endorsements from endurance athletes and micro-influencers have driven organic search spikes of coconut-based recovery drinks.

Functional coconut water blends containing L-theanine, magnesium, or adaptogens are gaining traction among high-performance users, contributing to +19% YOY growth in the performance hydration subsegment. The rise of evidence-backed claims is shifting coconut water from a “natural” product into a semi-functional category with direct crossover into the sports, recovery, and nootropic beverage verticals.

Margin Squeeze from Export-Led Price Shocks

Coconut water producers are facing export-driven margin pressure due to volatile raw coconut pricing and freight shifts. Between late 2023 and mid-2025, average bulk coconut prices in major exporting nations rose by 11-13%, driven by tightening yield cycles and fertilizer shortages.

Exporters in Vietnam and the Philippines now rely more on direct contracts with USA and EU distributors to lock price ceilings. Some SMEs are downshifting from glass bottles to Tetra Pak cartons to control packaging costs, reducing unit costs by 12-15%, but losing shelf aesthetics.
Coconut Water Market Analysis by Top Countries

Country Wise Analysis Of Coconut Water Market

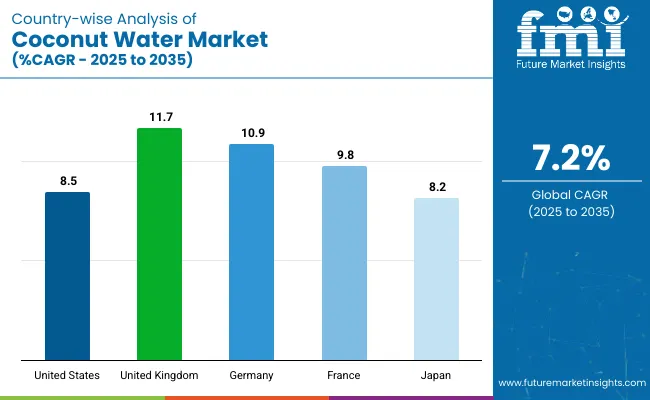
Countries CAGR (2025 to 2035)
United States 8.5%
United Kingdom 11.7%
Germany 10.9%
France 9.8%
Japan 8.2%

United States - Channel Diversification and Functional Premiumization

Coconut-water sales in the United States are projected to climb from roughly USD 1.3 billion in 2025 to about USD 2.9 billion by 2035, expanding at an 8.5% CAGR as sugar-reduction mandates, gym-centric demand, and provenance-driven clean-label claims gain traction.

Roughly one-fifth of volume is transacted online, and subscription bundles have shortened the average reorder interval. Cold-shelf facings for QR-coded packs at mass retailers such as Target and Kroger continue to increase after scan-and-learn content pushed basket sizes three percentage points above store norms. Direct-to-consumer labels now capture thirty-two percent of premium-tier spend after tiered membership pricing pulled repeat-purchase cycles twelve percent lower.

  • Online adoption: 20% of volume; subscriptions cut reorder intervals by a week
  • Retail execution: QR-coded facings so customer can scan-and-learn
  • D2C premium: Captures nearly one-third of top-tier spend and shortens repeat cycles
  • Organic traction: Shelf facings are increasing across supermarkets and hypermarkets
  • Packaging shift: Tetra Pak multipacks trim unit costs and unlock club-store space

United Kingdom - Digital Retail and Label-Driven Uptake (CAGR: 11.7%)

Coconut-water sales in the United Kingdom are set to rise from approximately USD 0.36 billion in 2025 to around USD 1.09 billion by 2035, driven by post-Sugar Tax substitutions, expanded private-label listings under £1 per litre, and a surge in online grocery penetration.

About 16% of total sales now happen online, and QR-enabled packs have been adopted by major supermarket chains to deliver provenance stories directly at shelf edge. Wellness bars and boutique gyms in London and Manchester are accounting for an increasing share of on-premise consumption, while reusable subscription bundles have begun shortening reorder intervals. Organic AB-certified variants account for over half of shelf turnover in premium aisles, and dynamic markdown pricing tied to smart tags is reducing waste.

  • E-commerce share: ~16% of volume; QR packs offer scan-and-shop provenance
  • Private-label growth: Sub-£1 listings expanded across three major retailers
  • On-trade lift: Wellness bars and gyms drive high-margin grab-and-go sales
  • Organic premium: AB-certified SKUs exceed 50% shelf turnover in premium zones
  • Waste reduction: Smart-tag markdowns cut unsold stock by over 20%

Germany - Bio-Certification and Discount-Channel Dynamics (CAGR: 10.9%)

German coconut-water revenues are forecast to climb from roughly USD 0.28 billion in 2025 to about USD 0.80 billion by 2035, propelled by bio-certification loyalty, widespread QR-traceability adoption, and deep discount-channel penetration. Over 60% of modern-trade retailers now dedicate cold-shelf facings to certified organic SKUs, reducing return rates by 9%.

Private-label bio variants are undercutting mainstream brands on price while maintaining traceability claims. Convenience-store multipacks are boosting impulse buys, and subscription-driven D2C labels are emerging in urban micro-markets to capture high-frequency gym goers.

  • Bio-cert facings: >60% of cold-shelf space; returns down 9%
  • Discount channel: Private-label bio undercuts national brands
  • Impulse buy: Convenience multipacks fuel on-the-go penetration
  • D2C niche: Urban subscription labels target fitness micro-segments
  • QR traceability: Scan-to-learn adoption across 85% of top grocers

France - Clean-Label Preference and Local Sourcing (CAGR: 9.8%)

French coconut-water sales are projected to grow from about USD 0.21 billion in 2025 to USD 0.55 billion by 2035, underpinned by clean-label demand, AB-certified diary and local bottling initiatives, and rising food-service partnerships. Over 50% of sales are now organic-certified, commanding a revenue premium in both retail and on-trade.

Regional packers in Marseille and Lyon have introduced low-emission logistics, cutting transport-related carbon output by around 12%. Premium cafés are blending coconut water into speciality coffee and wellness shots, and recyclable packaging mandates are driving rapid shelf rotation of compliant SKUs.

  • Organic share: >50% certified; shelf turnover premium across formats
  • Local bottling: Emissions down ~12% through regional supply chains
  • Café innovation: Coconut water blends in speciality coffee & wellness shots
  • Recyclable packs: New mandates accelerate shelf rotation
  • Food-service growth: Partnerships with upscale restaurateurs expand on-trade

Japan - Ageing Demographics and Functional Hydration (CAGR: 8.2%)

In Japan, coconut-water revenues are expected to increase from roughly USD 0.32 billion in 2025 to about USD 0.71 billion by 2035, buoyed by low-sugar hydration trends among older consumers, premium functional blends, and rapid-delivery e-commerce models. Online sales account for nearly 12% of share with ultra-fast grocery services offering sub-24-hour delivery for QR-traceable SKUs.

Health-focused convenience stores stock electrolyte-fortified Coconut Water Plus variants alongside traditional unflavoured packs. Localized concentrate rehydration plants are being trialled to mitigate import-related freight swings, and gym and wellness-bar partnerships are cementing coconut water’s place in recovery protocols.

  • Online share: ~12%; sub-24-hour delivery trials for traceable SKUs
  • Functional SKUs: Electrolyte-fortified variants in health-focused c-stores
  • Import hedge: Regional rehydration trials reduce freight exposure
  • Senior segment: Low-sugar positioning resonates with ageing demographics
  • Wellness tie-ins: Gym and wellness-bar partnerships drive repeat usage

Competition Outlook

Coconut water brands in 2025 are retooling their go-to-market playbooks with sharper regional positioning, diversified pack formats, and functional extensions. PepsiCo and Coca-Cola are intensifying penetration through D2C and quick-commerce channels in metro clusters, bundling coconut water with low-calorie or immunity-led SKUs.

Pricing strategies have shifted from premium static to value-tiered dynamic pricing, targeting impulse and bulk buys differently. Players like Malee and All Market Inc. are expanding portfolios with caffeinated, collagen-infused, or adaptogen-enhanced coconut water, backed by micro-influencer campaigns on short-video platforms. Retail execution emphasizes limited-edition flavors and cross-category shelf placement near plant-based milks or isotonic drinks to trigger discovery-led purchases.

In 2025, coconut water market strategies are shifting beyond legacy players. Startups like TAIKA (USA) are integrating coconut water into ready-to-drink functional blends combining caffeine and adaptogens, targeting wellness-conscious Gen Z consumers. Australia’s HuskeeHydrate is launching coconut water in reusable plant-based pods for soda-machine systems, merging hydration with sustainability and convenience.

Vietnam’s CoCoSyn uses smart NFC labelling for batch-level traceability, boosting consumer trust in origin and quality. These innovators are focusing on hybrid products, like collagen-coconut elixirs or low-GI coconut-based pre-workouts, and emphasize social-first branding, leveraging TikTok, fitness creators, and QR-based referral discounts. This approach counters premium fatigue and builds strong brand intimacy among niche lifestyle communities.

  • PepsiCo, Inc. - Owns O.N.E. Coconut Water and Tropicana Coco Blends, actively expanding functional variants and D2C distribution.
  • The Coca-Cola Company - Markets ZICO brand, recently repositioned with added-electrolyte SKUs and e-commerce bundling.
  • All Market Inc. (Vita Coco) - Dominant global player with flavored, protein-infused, and sparkling coconut water products.
  • Nestlé S.A. - Expands into coconut-based hydration under Nestlé Pure Life and Buxton extensions.
  • Malee Group PCL (Thailand) - Leading APAC manufacturer focused on sustainable sourcing and plant-based beverage innovation.
  • Goya Foods - Strong ethnic market penetration in the USA, offering value-tier and shelf-stable coconut water.
  • The Coconut Collaborative (UK) - Focuses on plant-based desserts and drinks, including premium chilled coconut water.
  • Singabera (Indonesia) - Artisan coconut water brand emphasizing traceability and wild-harvest sourcing.
  • Niulife (Australia) - Fair-trade certified producer, innovating in zero-waste packaging and probiotic coconut water.
  • Wichy Plantation Company (Sri Lanka) - Major exporter of organic coconut water concentrate to Europe and Japan.

Report Scope of Coconut Water Market

Attributes Details
Estimated Market Size (2025) USD 7.1 billion
Projected Market Size (2035) USD 14.5 billion
CAGR (2025 to 2035) 7.2%
Base Year 2024
Historical Period 2020 to 2024
Forecast Period 2025 to 2035
Reporting Units Revenue (USD billion), volume trends cited in million litres where available
Segments Covered Nature: Conventional, Organic, Flavour: Original/Unflavoured, Flavoured, Application: Food, Beverages, Personal Care &, Cosmetics, Nutraceutical, Animal Feed, Retail-pack Hydration, Sales Channel: Direct (gyms, airlines, food-service) and Indirect (modern trade, grocery, convenience, discount, online), Region: North America, Latin America, Europe, East Asia, South Asia, Oceania, Middle East &, Africa
Countries Analysed in Detail United States, United Kingdom, Germany, France, Japan, Thailand, Indonesia, Vietnam, Philippines, and 40+ countries
Key Companies Profiled PepsiCo (O.N.E., Tropicana Coco Blends), The Coca-Cola Company (ZICO), All Market Inc. (Vita Coco), Nestlé, S.A., Malee Group PCL, Goya Foods, The Coconut Collaborative, Singabera, Niulife, Wichy Plantation Company
Coverage Highlights Market sizing and growth outlook, segment-wise and country-level analysis, pricing snapshot, supply-chain and inventory dynamics, competitive landscape, and strategic opportunity mapping through 2035

Key Segmentation

By Nature:

  • Conventional
  • Organic

By Application:

  • Food
  • Bakery & Confectionery
  • Breakfast Cereal
  • Dairy Products
  • Sauces and Salads
  • Other Food Products
  • Beverages
  • Alcoholic Beverages
  • Tea & Coffee
  • Other Beverages
  • Cosmetics & Personal Care
  • Skin Care
  • Hair Care
  • Nutraceutical
  • Animal Feed & Pet Food
  • Retail

By Flavour:

  • Unflavored/Original
  • Flavored

By Sales Channel:

  • B2B/Direct
  • B2C/Indirect

By Region:

  • North America
  • Latin America
  • Europe
  • East Asia
  • Southeast Asia and Pacific
  • Middle East and Africa

Table of Content

  1. Executive Summary
    • Global Market Outlook
    • Demand-side Trends
    • Supply-side Trends
    • Technology Roadmap Analysis
    • Analysis and Recommendations
  2. Market Overview
    • Market Coverage/Taxonomy
    • Market Definition/Scope/Limitations
  3. Market Background
    • Market Dynamics
      • Drivers
      • Restraints
      • Opportunity
      • Trends
    • Scenario Forecast
      • Demand in Optimistic Scenario
      • Demand in Likely Scenario
      • Demand in Conservative Scenario
    • Opportunity Map Analysis
    • Product Life Cycle Analysis
    • Supply Chain Analysis
      • Supply Side Participants and their Roles
        • Producers
        • Mid-Level Participants (Traders/ Agents/ Brokers)
        • Wholesalers and Distributors
      • Value Added and Value Created at Node in the Supply Chain
      • List of Raw Material Suppliers
      • List of Existing and Potential Buyer’s
    • Investment Feasibility Matrix
    • Value Chain Analysis
      • Profit Margin Analysis
      • Wholesalers and Distributors
      • Retailers
    • PESTLE and Porter’s Analysis
    • Regulatory Landscape
      • By Key Regions
      • By Key Countries
    • Regional Parent Market Outlook
    • Production and Consumption Statistics
    • Import and Export Statistics
  4. Global Market Analysis 2020 to 2024 and Forecast, 2025 to 2035
    • Historical Market Size Value (USD Billion) & Volume (million litres) Analysis, 2020 to 2024
    • Current and Future Market Size Value (USD Billion) & Volume (million litres) Projections, 2025 to 2035
      • Y-o-Y Growth Trend Analysis
      • Absolute $ Opportunity Analysis
  5. Global Market Pricing Analysis 2020 to 2024 and Forecast 2025 to 2035
  6. Global Market Analysis 2020 to 2024 and Forecast 2025 to 2035, By Nature
    • Introduction / Key Findings
    • Historical Market Size Value (USD Billion) & Volume (million litres) Analysis By Nature, 2020 to 2024
    • Current and Future Market Size Value (USD Billion) & Volume (million litres) Analysis and Forecast By Nature, 2025 to 2035
      • Conventional
      • Organic
    • Y-o-Y Growth Trend Analysis By Nature, 2020 to 2024
    • Absolute $ Opportunity Analysis By Nature, 2025 to 2035
  7. Global Market Analysis 2020 to 2024 and Forecast 2025 to 2035, By Flavour
    • Introduction / Key Findings
    • Historical Market Size Value (USD Billion) & Volume (million litres) Analysis By Flavour, 2020 to 2024
    • Current and Future Market Size Value (USD Billion) & Volume (million litres) Analysis and Forecast By Flavour, 2025 to 2035
      • Original/Unflavoured
      • Flavoured
    • Y-o-Y Growth Trend Analysis By Flavour, 2020 to 2024
    • Absolute $ Opportunity Analysis By Flavour, 2025 to 2035
  8. Global Market Analysis 2020 to 2024 and Forecast 2025 to 2035, By Application
    • Introduction / Key Findings
    • Historical Market Size Value (USD Billion) & Volume (million litres) Analysis By Application, 2020 to 2024
    • Current and Future Market Size Value (USD Billion) & Volume (million litres) Analysis and Forecast By Application, 2025 to 2035
      • Food
        • Bakery and Confectionery
        • Dairy Products
        • Breakfast Cereal
        • Sauces and Salads
        • Other Food Products
      • Beverages
        • Alcoholic Beverages
        • Tea and Coffee
        • Other Beverages
      • Personal Care & Cosmetics
        • Skincare
        • Haircare
      • Nutraceutical
      • Animal Feed
      • Retail
    • Y-o-Y Growth Trend Analysis By Application, 2020 to 2024
    • Absolute $ Opportunity Analysis By Application, 2025 to 2035
  9. Global Market Analysis 2020 to 2024 and Forecast 2025 to 2035, By Region
    • Introduction
    • Historical Market Size Value (USD Billion) & Volume (million litres) Analysis By Region, 2020 to 2024
    • Current Market Size Value (USD Billion) & Volume (million litres) Analysis and Forecast By Region, 2025 to 2035
      • North America
      • Latin America
      • Western Europe
      • Eastern Europe
      • East Asia
      • South Asia & Pacific
      • Middle East and Africa
    • Market Attractiveness Analysis By Region
  10. North America Market Analysis 2020 to 2024 and Forecast 2025 to 2035, By Country
    • Historical Market Size Value (USD Billion) & Volume (million litres) Trend Analysis By Market Taxonomy, 2020 to 2024
    • Market Size Value (USD Billion) & Volume (million litres) Forecast By Market Taxonomy, 2025 to 2035
      • By Country
        • USA
        • Canada
        • Mexico
      • By Nature
      • By Flavour
      • By Application
    • Market Attractiveness Analysis
      • By Country
      • By Nature
      • By Flavour
      • By Application
    • Key Takeaways
  11. Latin America Market Analysis 2020 to 2024 and Forecast 2025 to 2035, By Country
    • Historical Market Size Value (USD Billion) & Volume (million litres) Trend Analysis By Market Taxonomy, 2020 to 2024
    • Market Size Value (USD Billion) & Volume (million litres) Forecast By Market Taxonomy, 2025 to 2035
      • By Country
        • Brazil
        • Argentina
        • Rest of LATAM
      • By Nature
      • By Flavour
      • By Application
    • Market Attractiveness Analysis
      • By Country
      • By Nature
      • By Flavour
      • By Application
    • Key Takeaways
  12. Western Europe Market Analysis 2020 to 2024 and Forecast 2025 to 2035, By Country
    • Historical Market Size Value (USD Billion) & Volume (million litres) Trend Analysis By Market Taxonomy, 2020 to 2024
    • Market Size Value (USD Billion) & Volume (million litres) Forecast By Market Taxonomy, 2025 to 2035
      • By Country
        • Germany
        • Italy
        • France
        • UK
        • Spain
        • BENELUX
        • Nordic
        • Rest of W.Europe
      • By Nature
      • By Flavour
      • By Application
    • Market Attractiveness Analysis
      • By Country
      • By Nature
      • By Flavour
      • By Application
    • Key Takeaways
  13. Eastern Europe Market Analysis 2020 to 2024 and Forecast 2025 to 2035, By Country
    • Historical Market Size Value (USD Billion) & Volume (million litres) Trend Analysis By Market Taxonomy, 2020 to 2024
    • Market Size Value (USD Billion) & Volume (million litres) Forecast By Market Taxonomy, 2025 to 2035
      • By Country
        • Russia
        • Hungary
        • Poland
        • Balkan & Baltics
        • Rest of E. Europe
      • By Nature
      • By Flavour
      • By Application
    • Market Attractiveness Analysis
      • By Country
      • By Nature
      • By Flavour
      • By Application
    • Key Takeaways
  14. East Asia Market Analysis 2020 to 2024 and Forecast 2025 to 2035, By Country
    • Historical Market Size Value (USD Billion) & Volume (million litres) Trend Analysis By Market Taxonomy, 2020 to 2024
    • Market Size Value (USD Billion) & Volume (million litres) Forecast By Market Taxonomy, 2025 to 2035
      • By Country
        • China
        • Japan
        • South Korea
      • By Nature
      • By Flavour
      • By Application
    • Market Attractiveness Analysis
      • By Country
      • By Nature
      • By Flavour
      • By Application
    • Key Takeaways
  15. South Asia & Pacific Market Analysis 2020 to 2024 and Forecast 2025 to 2035, By Country
    • Historical Market Size Value (USD Billion) & Volume (million litres) Trend Analysis By Market Taxonomy, 2020 to 2024
    • Market Size Value (USD Billion) & Volume (million litres) Forecast By Market Taxonomy, 2025 to 2035
      • By Country
        • India
        • Australia & New Zealand
        • ASEAN
        • Rest of SAP
      • By Nature
      • By Flavour
      • By Application
    • Market Attractiveness Analysis
      • By Country
      • By Nature
      • By Flavour
      • By Application
    • Key Takeaways
  16. Middle East and Africa Market Analysis 2020 to 2024 and Forecast 2025 to 2035, By Country
    • Historical Market Size Value (USD Billion) & Volume (million litres) Trend Analysis By Market Taxonomy, 2020 to 2024
    • Market Size Value (USD Billion) & Volume (million litres) Forecast By Market Taxonomy, 2025 to 2035
      • By Country
        • GCC Countries
        • Northern Africa
        • South Africa
        • Turkiye
        • Rest of MEA
      • By Nature
      • By Flavour
      • By Application
    • Market Attractiveness Analysis
      • By Country
      • By Nature
      • By Flavour
      • By Application
    • Key Takeaways
  17. Key Countries Market Analysis
    • USA
      • Pricing Analysis
      • Market Share Analysis, 2024
        • By Nature
        • By Flavour
        • By Application
    • Canada
      • Pricing Analysis
      • Market Share Analysis, 2024
        • By Nature
        • By Flavour
        • By Application
    • Brazil
      • Pricing Analysis
      • Market Share Analysis, 2024
        • By Nature
        • By Flavour
        • By Application
    • Mexico
      • Pricing Analysis
      • Market Share Analysis, 2024
        • By Nature
        • By Flavour
        • By Application
    • Argentina
      • Pricing Analysis
      • Market Share Analysis, 2024
        • By Nature
        • By Flavour
        • By Application
  18. Market Structure Analysis
    • Competition Dashboard
    • Competition Benchmarking
    • Market Share Analysis of Top Players
      • By Regional
      • By Nature
      • By Flavour
      • By Application
  19. Competition Analysis
    • Competition Deep Dive
      • PepsiCo
        • Overview
        • Product Portfolio
        • Profitability by Market Segments (Product/Age /Sales Channel/Region)
        • Sales Footprint
        • Strategy Overview
          • Marketing Strategy
          • Product Strategy
          • Channel Strategy
      • The Coca-Cola Company (ZICO)
        • Overview
        • Product Portfolio
        • Profitability by Market Segments (Product/Age /Sales Channel/Region)
        • Sales Footprint
        • Strategy Overview
          • Marketing Strategy
          • Product Strategy
          • Channel Strategy
      • All Market Inc. (Vita Coco)
        • Overview
        • Product Portfolio
        • Profitability by Market Segments (Product/Age /Sales Channel/Region)
        • Sales Footprint
        • Strategy Overview
          • Marketing Strategy
          • Product Strategy
          • Channel Strategy
      • Nestlé S.A.
        • Overview
        • Product Portfolio
        • Profitability by Market Segments (Product/Age /Sales Channel/Region)
        • Sales Footprint
        • Strategy Overview
          • Marketing Strategy
          • Product Strategy
          • Channel Strategy
      • Malee Group PCL
        • Overview
        • Product Portfolio
        • Profitability by Market Segments (Product/Age /Sales Channel/Region)
        • Sales Footprint
        • Strategy Overview
          • Marketing Strategy
          • Product Strategy
          • Channel Strategy
      • Goya Foods
        • Overview
        • Product Portfolio
        • Profitability by Market Segments (Product/Age /Sales Channel/Region)
        • Sales Footprint
        • Strategy Overview
          • Marketing Strategy
          • Product Strategy
          • Channel Strategy
      • The Coconut Collaborative
        • Overview
        • Product Portfolio
        • Profitability by Market Segments (Product/Age /Sales Channel/Region)
        • Sales Footprint
        • Strategy Overview
          • Marketing Strategy
          • Product Strategy
          • Channel Strategy
      • Singabera
        • Overview
        • Product Portfolio
        • Profitability by Market Segments (Product/Age /Sales Channel/Region)
        • Sales Footprint
        • Strategy Overview
          • Marketing Strategy
          • Product Strategy
          • Channel Strategy
      • Niulife
        • Overview
        • Product Portfolio
        • Profitability by Market Segments (Product/Age /Sales Channel/Region)
        • Sales Footprint
        • Strategy Overview
          • Marketing Strategy
          • Product Strategy
          • Channel Strategy
      • Wichy Plantation Company
        • Overview
        • Product Portfolio
        • Profitability by Market Segments (Product/Age /Sales Channel/Region)
        • Sales Footprint
        • Strategy Overview
          • Marketing Strategy
          • Product Strategy
          • Channel Strategy
  20. Assumptions & Acronyms Used
  21. Research Methodology

List of Tables

  • Table 1: Global Market Value (USD Billion) Forecast by Region, 2020-2035
  • Table 2: Global Market Volume (million litres) Forecast by Region, 2020-2035
  • Table 3: Global Market Value (USD Billion) Forecast by Nature, 2020-2035
  • Table 4: Global Market Volume (million litres) Forecast by Nature, 2020-2035
  • Table 5: Global Market Value (USD Billion) Forecast by Flavour, 2020-2035
  • Table 6: Global Market Volume (million litres) Forecast by Flavour, 2020-2035
  • Table 7: Global Market Value (USD Billion) Forecast by Application, 2020-2035
  • Table 8: Global Market Volume (million litres) Forecast by Application, 2020-2035
  • Table 9: North America Market Value (USD Billion) Forecast by Country, 2020-2035
  • Table 10: North America Market Volume (million litres) Forecast by Country, 2020-2035
  • Table 11: North America Market Value (USD Billion) Forecast by Nature, 2020-2035
  • Table 12: North America Market Volume (million litres) Forecast by Nature, 2020-2035
  • Table 13: North America Market Value (USD Billion) Forecast by Flavour, 2020-2035
  • Table 14: North America Market Volume (million litres) Forecast by Flavour, 2020-2035
  • Table 15: North America Market Value (USD Billion) Forecast by Application, 2020-2035
  • Table 16: North America Market Volume (million litres) Forecast by Application, 2020-2035
  • Table 17: Latin America Market Value (USD Billion) Forecast by Country, 2020-2035
  • Table 18: Latin America Market Volume (million litres) Forecast by Country, 2020-2035
  • Table 19: Latin America Market Value (USD Billion) Forecast by Nature, 2020-2035
  • Table 20: Latin America Market Volume (million litres) Forecast by Nature, 2020-2035
  • Table 21: Latin America Market Value (USD Billion) Forecast by Flavour, 2020-2035
  • Table 22: Latin America Market Volume (million litres) Forecast by Flavour, 2020-2035
  • Table 23: Latin America Market Value (USD Billion) Forecast by Application, 2020-2035
  • Table 24: Latin America Market Volume (million litres) Forecast by Application, 2020-2035
  • Table 25: Western Europe Market Value (USD Billion) Forecast by Country, 2020-2035
  • Table 26: Western Europe Market Volume (million litres) Forecast by Country, 2020-2035
  • Table 27: Western Europe Market Value (USD Billion) Forecast by Nature, 2020-2035
  • Table 28: Western Europe Market Volume (million litres) Forecast by Nature, 2020-2035
  • Table 29: Western Europe Market Value (USD Billion) Forecast by Flavour, 2020-2035
  • Table 30: Western Europe Market Volume (million litres) Forecast by Flavour, 2020-2035
  • Table 31: Western Europe Market Value (USD Billion) Forecast by Application, 2020-2035
  • Table 32: Western Europe Market Volume (million litres) Forecast by Application, 2020-2035
  • Table 33: Eastern Europe Market Value (USD Billion) Forecast by Country, 2020-2035
  • Table 34: Eastern Europe Market Volume (million litres) Forecast by Country, 2020-2035
  • Table 35: Eastern Europe Market Value (USD Billion) Forecast by Nature, 2020-2035
  • Table 36: Eastern Europe Market Volume (million litres) Forecast by Nature, 2020-2035
  • Table 37: Eastern Europe Market Value (USD Billion) Forecast by Flavour, 2020-2035
  • Table 38: Eastern Europe Market Volume (million litres) Forecast by Flavour, 2020-2035
  • Table 39: Eastern Europe Market Value (USD Billion) Forecast by Application, 2020-2035
  • Table 40: Eastern Europe Market Volume (million litres) Forecast by Application, 2020-2035
  • Table 41: East Asia Market Value (USD Billion) Forecast by Country, 2020-2035
  • Table 42: East Asia Market Volume (million litres) Forecast by Country, 2020-2035
  • Table 43: East Asia Market Value (USD Billion) Forecast by Nature, 2020-2035
  • Table 44: East Asia Market Volume (million litres) Forecast by Nature, 2020-2035
  • Table 45: East Asia Market Value (USD Billion) Forecast by Flavour, 2020-2035
  • Table 46: East Asia Market Volume (million litres) Forecast by Flavour, 2020-2035
  • Table 47: East Asia Market Value (USD Billion) Forecast by Application, 2020-2035
  • Table 48: East Asia Market Volume (million litres) Forecast by Application, 2020-2035
  • Table 49: South Asia & Pacific Market Value (USD Billion) Forecast by Country, 2020-2035
  • Table 50: South Asia & Pacific Market Volume (million litres) Forecast by Country, 2020-2035
  • Table 51: South Asia & Pacific Market Value (USD Billion) Forecast by Nature, 2020-2035
  • Table 52: South Asia & Pacific Market Volume (million litres) Forecast by Nature, 2020-2035
  • Table 53: South Asia & Pacific Market Value (USD Billion) Forecast by Flavour, 2020-2035
  • Table 54: South Asia & Pacific Market Volume (million litres) Forecast by Flavour, 2020-2035
  • Table 55: South Asia & Pacific Market Value (USD Billion) Forecast by Application, 2020-2035
  • Table 56: South Asia & Pacific Market Volume (million litres) Forecast by Application, 2020-2035
  • Table 57: Middle East and Africa Market Value (USD Billion) Forecast by Country, 2020-2035
  • Table 58: Middle East and Africa Market Volume (million litres) Forecast by Country, 2020-2035
  • Table 59: Middle East and Africa Market Value (USD Billion) Forecast by Nature, 2020-2035
  • Table 60: Middle East and Africa Market Volume (million litres) Forecast by Nature, 2020-2035
  • Table 61: Middle East and Africa Market Value (USD Billion) Forecast by Flavour, 2020-2035
  • Table 62: Middle East and Africa Market Volume (million litres) Forecast by Flavour, 2020-2035
  • Table 63: Middle East and Africa Market Value (USD Billion) Forecast by Application, 2020-2035
  • Table 64: Middle East and Africa Market Volume (million litres) Forecast by Application, 2020-2035

List of Figures

  • Figure 1: Global Market Volume (million litres) Forecast 2020-2035
  • Figure 2: Global Market Pricing Analysis
  • Figure 3: Global Market Value (USD Billion) Forecast 2020-2035
  • Figure 4: Global Market Value Share and BPS Analysis by Nature, 2025 and 2035
  • Figure 5: Global Market Y-o-Y Growth Comparison by Nature, 2025-2035
  • Figure 6: Global Market Attractiveness Analysis by Nature
  • Figure 7: Global Market Value Share and BPS Analysis by Flavour, 2025 and 2035
  • Figure 8: Global Market Y-o-Y Growth Comparison by Flavour, 2025-2035
  • Figure 9: Global Market Attractiveness Analysis by Flavour
  • Figure 10: Global Market Value Share and BPS Analysis by Application, 2025 and 2035
  • Figure 11: Global Market Y-o-Y Growth Comparison by Application, 2025-2035
  • Figure 12: Global Market Attractiveness Analysis by Application
  • Figure 13: Global Market Value (USD Billion) Share and BPS Analysis by Region, 2025 and 2035
  • Figure 14: Global Market Y-o-Y Growth Comparison by Region, 2025-2035
  • Figure 15: Global Market Attractiveness Analysis by Region
  • Figure 16: North America Market Incremental $ Opportunity, 2025-2035
  • Figure 17: Latin America Market Incremental $ Opportunity, 2025-2035
  • Figure 18: Western Europe Market Incremental $ Opportunity, 2025-2035
  • Figure 19: Eastern Europe Market Incremental $ Opportunity, 2025-2035
  • Figure 20: East Asia Market Incremental $ Opportunity, 2025-2035
  • Figure 21: South Asia & Pacific Market Incremental $ Opportunity, 2025-2035
  • Figure 22: Middle East and Africa Market Incremental $ Opportunity, 2025-2035
  • Figure 23: North America Market Value Share and BPS Analysis by Country, 2025 and 2035
  • Figure 24: North America Market Value Share and BPS Analysis by Nature, 2025 and 2035
  • Figure 25: North America Market Y-o-Y Growth Comparison by Nature, 2025-2035
  • Figure 26: North America Market Attractiveness Analysis by Nature
  • Figure 27: North America Market Value Share and BPS Analysis by Flavour, 2025 and 2035
  • Figure 28: North America Market Y-o-Y Growth Comparison by Flavour, 2025-2035
  • Figure 29: North America Market Attractiveness Analysis by Flavour
  • Figure 30: North America Market Value Share and BPS Analysis by Application, 2025 and 2035
  • Figure 31: North America Market Y-o-Y Growth Comparison by Application, 2025-2035
  • Figure 32: North America Market Attractiveness Analysis by Application
  • Figure 33: Latin America Market Value Share and BPS Analysis by Country, 2025 and 2035
  • Figure 34: Latin America Market Value Share and BPS Analysis by Nature, 2025 and 2035
  • Figure 35: Latin America Market Y-o-Y Growth Comparison by Nature, 2025-2035
  • Figure 36: Latin America Market Attractiveness Analysis by Nature
  • Figure 37: Latin America Market Value Share and BPS Analysis by Flavour, 2025 and 2035
  • Figure 38: Latin America Market Y-o-Y Growth Comparison by Flavour, 2025-2035
  • Figure 39: Latin America Market Attractiveness Analysis by Flavour
  • Figure 40: Latin America Market Value Share and BPS Analysis by Application, 2025 and 2035
  • Figure 41: Latin America Market Y-o-Y Growth Comparison by Application, 2025-2035
  • Figure 42: Latin America Market Attractiveness Analysis by Application
  • Figure 43: Western Europe Market Value Share and BPS Analysis by Country, 2025 and 2035
  • Figure 44: Western Europe Market Value Share and BPS Analysis by Nature, 2025 and 2035
  • Figure 45: Western Europe Market Y-o-Y Growth Comparison by Nature, 2025-2035
  • Figure 46: Western Europe Market Attractiveness Analysis by Nature
  • Figure 47: Western Europe Market Value Share and BPS Analysis by Flavour, 2025 and 2035
  • Figure 48: Western Europe Market Y-o-Y Growth Comparison by Flavour, 2025-2035
  • Figure 49: Western Europe Market Attractiveness Analysis by Flavour
  • Figure 50: Western Europe Market Value Share and BPS Analysis by Application, 2025 and 2035
  • Figure 51: Western Europe Market Y-o-Y Growth Comparison by Application, 2025-2035
  • Figure 52: Western Europe Market Attractiveness Analysis by Application
  • Figure 53: Eastern Europe Market Value Share and BPS Analysis by Country, 2025 and 2035
  • Figure 54: Eastern Europe Market Value Share and BPS Analysis by Nature, 2025 and 2035
  • Figure 55: Eastern Europe Market Y-o-Y Growth Comparison by Nature, 2025-2035
  • Figure 56: Eastern Europe Market Attractiveness Analysis by Nature
  • Figure 57: Eastern Europe Market Value Share and BPS Analysis by Flavour, 2025 and 2035
  • Figure 58: Eastern Europe Market Y-o-Y Growth Comparison by Flavour, 2025-2035
  • Figure 59: Eastern Europe Market Attractiveness Analysis by Flavour
  • Figure 60: Eastern Europe Market Value Share and BPS Analysis by Application, 2025 and 2035
  • Figure 61: Eastern Europe Market Y-o-Y Growth Comparison by Application, 2025-2035
  • Figure 62: Eastern Europe Market Attractiveness Analysis by Application
  • Figure 63: East Asia Market Value Share and BPS Analysis by Country, 2025 and 2035
  • Figure 64: East Asia Market Value Share and BPS Analysis by Nature, 2025 and 2035
  • Figure 65: East Asia Market Y-o-Y Growth Comparison by Nature, 2025-2035
  • Figure 66: East Asia Market Attractiveness Analysis by Nature
  • Figure 67: East Asia Market Value Share and BPS Analysis by Flavour, 2025 and 2035
  • Figure 68: East Asia Market Y-o-Y Growth Comparison by Flavour, 2025-2035
  • Figure 69: East Asia Market Attractiveness Analysis by Flavour
  • Figure 70: East Asia Market Value Share and BPS Analysis by Application, 2025 and 2035
  • Figure 71: East Asia Market Y-o-Y Growth Comparison by Application, 2025-2035
  • Figure 72: East Asia Market Attractiveness Analysis by Application
  • Figure 73: South Asia & Pacific Market Value Share and BPS Analysis by Country, 2025 and 2035
  • Figure 74: South Asia & Pacific Market Value Share and BPS Analysis by Nature, 2025 and 2035
  • Figure 75: South Asia & Pacific Market Y-o-Y Growth Comparison by Nature, 2025-2035
  • Figure 76: South Asia & Pacific Market Attractiveness Analysis by Nature
  • Figure 77: South Asia & Pacific Market Value Share and BPS Analysis by Flavour, 2025 and 2035
  • Figure 78: South Asia & Pacific Market Y-o-Y Growth Comparison by Flavour, 2025-2035
  • Figure 79: South Asia & Pacific Market Attractiveness Analysis by Flavour
  • Figure 80: South Asia & Pacific Market Value Share and BPS Analysis by Application, 2025 and 2035
  • Figure 81: South Asia & Pacific Market Y-o-Y Growth Comparison by Application, 2025-2035
  • Figure 82: South Asia & Pacific Market Attractiveness Analysis by Application
  • Figure 83: Middle East and Africa Market Value Share and BPS Analysis by Country, 2025 and 2035
  • Figure 84: Middle East and Africa Market Value Share and BPS Analysis by Nature, 2025 and 2035
  • Figure 85: Middle East and Africa Market Y-o-Y Growth Comparison by Nature, 2025-2035
  • Figure 86: Middle East and Africa Market Attractiveness Analysis by Nature
  • Figure 87: Middle East and Africa Market Value Share and BPS Analysis by Flavour, 2025 and 2035
  • Figure 88: Middle East and Africa Market Y-o-Y Growth Comparison by Flavour, 2025-2035
  • Figure 89: Middle East and Africa Market Attractiveness Analysis by Flavour
  • Figure 90: Middle East and Africa Market Value Share and BPS Analysis by Application, 2025 and 2035
  • Figure 91: Middle East and Africa Market Y-o-Y Growth Comparison by Application, 2025-2035
  • Figure 92: Middle East and Africa Market Attractiveness Analysis by Application
  • Figure 93: Global Market - Tier Structure Analysis
  • Figure 94: Global Market - Company Share Analysis

Frequently Asked Questions

How large is the coconut water market in 2025?

The global coconut water market is valued at USD 7.1 billion in 2025.

What size is the market projected to reach by 2035?

It is forecast to attain USD 14.5 billion by 2035.

Which nature segment leads the coconut water market in 2025?

Conventional coconut water is estimated to command 92.6% of global revenue.

Which flavour segment holds the largest share in coconut water market?

Original/unflavoured coconut water captures 73.0% of total volume.

Explore Similar Insights

Future Market Insights

Coconut Water Market